Evaporative Demand Drought Index (EDDI) Subseasonal Forecasts
University of California, Merced
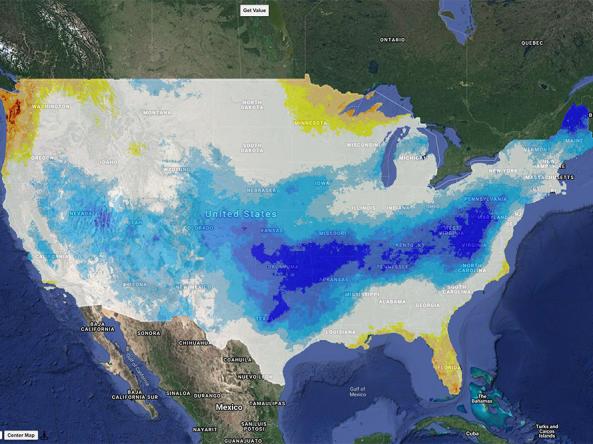
Evaporative Demand Drought Index (EDDI) subseasonal forecasts are available for the next 1-7 days (Week 1), 8-14 days (Week 2), 15-21 days (Week 3), 22-28 days (Week 4) as well as the next 1-14 days (Week 1-2), 1-21 days (Week 1-3) and 1-28 days (Week 1-4) from the CFS-gridMET dataset at 4-km gridded resolution over the contiguous U.S. These represent forecasts of 1-week, 2-week, 3-week and 4-week EDDI depending on which future time period is selected.
The Evaporative Demand Drought Index (EDDI) is an experimental drought monitoring and early warning guidance tool. It examines how anomalous the atmospheric evaporative demand (E0; also known as "the thirst of the atmosphere") is for a given location and across a time period of interest. This experimental subseasonal EDDI forecast shows projected evaporative demand for the next 14 days from the CFS-gridMET dataset at 4-km gridded resolution.
The Evaporative Demand Drought Index (EDDI) is an experimental drought monitoring and early warning guidance tool. It examines how anomalous the atmospheric evaporative demand (E0; also known as "the thirst of the atmosphere") is for a given location and across a time period of interest. This experimental subseasonal EDDI forecast shows projected evaporative demand for the next 28 days from the CFS-gridMET dataset at 4-km gridded resolution.
Dry Conditions
Wet Conditions
Dry Conditions
Wet Conditions
The Evaporative Demand Drought Index (EDDI) is an experimental drought monitoring and early warning guidance tool. It examines how anomalous the atmospheric evaporative demand (E0; also known as "the thirst of the atmosphere") is for a given location and across a time period of interest. This experimental subseasonal EDDI forecast shows projected evaporative demand for the next 14 days from the CFS-gridMET dataset at 4-km gridded resolution.
The Evaporative Demand Drought Index (EDDI) is an experimental drought monitoring and early warning guidance tool. It examines how anomalous the atmospheric evaporative demand (E0; also known as "the thirst of the atmosphere") is for a given location and across a time period of interest. This experimental subseasonal EDDI forecast shows projected evaporative demand for the next 28 days from the CFS-gridMET dataset at 4-km gridded resolution.
How To
What can I do with these data?
EDDI has been shown to offer early warning of drought stress relative to current operational drought indicators, such as the U.S. Drought Monitor (USDM). A particular strength of EDDI is in capturing the precursor signals of water stress at weekly to monthly timescales, which makes EDDI a potent tool for drought preparedness at those timescales. EDDI also uses the same classification scheme as the USDM to define drought conditions, so it is easy to read EDDI maps.
How do I use the Climate Engine site?
- Under Map Options tab, for the “Type” select “Climate Forecasts”
- Under Map Options tab, for the “Data” select “CFS GRIDMET 28-day Forecasts”
- Under Map Options tab, for the “Variable” select “EDDI”
- Under Map Options tab, for the “Statistic(over Forecast Ensemble)” select one of the statistics from the 48-member ensemble
- Under Map Options tab, for the “Aggregation Period” select Week 1 (Next 1-7 days), Week 2, Week 3, Week 4, Week 1-2, Week 1-3 or Week 1-4 (Next 1-28 days)
- Click the button “Get Map Layer”
How do I use the Climate Mapper site?
- Under “Time Scale”, select “Forecasts: Experimental Subseasonal (next 28 days)”
- Under “Impact Area”, select “Weather”
- Under “Variable”, select “EDDI”
- Under “Calendar Time Period”, select Week 1 (Next 1-7 days), Week 2, Week 3, Week 4, Week 1-2, Week 1-3 or Week 1-4 (Next 1-28 days)
- The map will automatically update with the selections
Access
Maps Visualization: Forecast maps from Climate Engine and Climate Mapper (from the Climate Toolbox)
Time Series Download: Time series of forecasts available from the Subseasonal Forecast Tool (a new Climate Toolbox tool launching by Jan 31, 2021)
Data Download: Data from the 48 ensemble members of the EDDI forecasts are available on the CFS-gridMET THREDDS server at the Northwest Knowledge Network at the University of Idaho. The relevant files are the files cfsv2_metdata_forecast_48ENS_{variable}_daily_4d.nc which contain a 4 dimensional (lat,lon,day,ensemble) array of the 48 ensemble forecasts of the variable for the next 28 days from the initial date specified in the metadata over the contiguous U.S.
Documentation
Description
EDDI is a drought indicator that uses atmospheric evaporative demand (E0) anomalies across a time window of interest relative to its climatology to indicate the spatial extent and severity of drought.
The EDDI forecasts come from the CFS-gridMET dataset, which is generated daily from 4 CFS ensemble forecasts initialized at 6-hour intervals from 3 consecutive days to create a 48-member ensemble of forecasts. These raw CFS forecasts are downscaled utilizing bias-correction techniques with the gridMET climate dataset (4-km gridded resolution) as training data. Reference evapotranspiration is created using the Penman Monteith FAO56 formulation with the CFS-gridMET variables for min/max temperature, specific humidity, downward solar radiation and wind speed.
Reference evapotranspiration over the time period 1979-2018 using non-parametric probability-based methods where plotting positions are transformed to indices assuming an inverse-normal distribution.
EDDI is estimated by standardizing the reference evapotranspiration anomalies relative to the years 1979-2018, using a non-parametric method (see Hobbins et al., 2016).
The EDDI forecasts for each of the time periods are created by standardizing reference evapotranspiration totals for the next 1-7 days (Week 1), 8-14 days (Week 2), 15-21 days (Week 3), 22-28 days (Week 4), 1-14 days (Week 1-2), 1-21 days (Week 1-3) and 1-28 days (Week 1-4). The ET totals over a week are used to create a 1-week EDDI, while the ET totals over 2,3 or 4 weeks are used to create a 2-week, 3-week or 4-week EDDI.
EDDI has the potential to offer early warning of agricultural drought, hydrologic drought, and fire-weather risk by providing real-time information on the emergence or persistence of anomalous evaporative demand in a region. A particular strength of EDDI is in capturing the precursor signals of water stress at weekly to monthly timescales, which makes EDDI a strong tool for drought preparedness at those timescales.
For more information regarding these data, please contact John Abatzoglou (jabatzoglou@ucmerced.edu).
References
- Abatzoglou, J. T. (2013): Development of gridded surface meteorological data for ecological applications and modelling. Int. J. Climatol., 33: 121–131. doi: 10.1002/joc.3413
- Suranjana Saha, and Coauthors, 2010: The NCEP Climate Forecast System Reanalysis. Bull. Amer. Meteor. Soc., 91, 1015.1057. doi: 10.1175/2010BAMS3001.1
- Michael Hobbins, Andrew Wood, Daniel McEvoy, Justin Huntington, Charles Morton, James Verdin, Martha Anderson, and Christopher Hain (June 2016): The Evaporative Demand Drought index: Part I – Linking Drought Evolution to Variations in Evaporative Demand. J. Hydrometeor., 17(6),1745-1761. doi:10.1175/JHM-D-15-0121.1
- Daniel J. McEvoy, Justin L. Huntington, Michael T. Hobbins, Andrew Wood, Charles Morton, James Verdin, Martha Anderson, and Christopher Hain (June 2016) The Evaporative Demand Drought index: Part II – CONUS-wide Assessment Against Common Drought Indicators. J. Hydrometeor., 17(6), 1763-1779. doi:10.1175/JHM-D-15-0121.1
Acknowledgements
This work is supported in part by grants from
- NOAA’s Sectoral Applications Research Program (SARP): Coping with Drought in Support of the National Integrated Drought Information System (NIDIS) program for the project, “Developing a wildfire component for the NIDIS California Drought Early Warning System"
- NOAA through the RISA program support to Climate Impacts Research Consortium (CIRC)
- NIDIS “Expansion of DEWS Activities Through the Development of New Technologies to Improve Processing Speeds, Access, and Visualization of Drought Metrics, Impacts, and Forecasts”