Warning: Undefined variable $index in Drupal\responsive_bg_image_formatter\Plugin\Field\FieldFormatter\ResponsiveBgImageFormatter->viewElements() (line 95 of modules/custom/responsive_bg_image_formatter/src/Plugin/Field/FieldFormatter/ResponsiveBgImageFormatter.php).
Drupal\responsive_bg_image_formatter\Plugin\Field\FieldFormatter\ResponsiveBgImageFormatter->viewElements(Object, 'en') (Line: 91) Drupal\Core\Field\FormatterBase->view(Object, 'en') (Line: 76) Drupal\Core\Field\Plugin\Field\FieldFormatter\EntityReferenceFormatterBase->view(Object, NULL) (Line: 268) Drupal\Core\Entity\Entity\EntityViewDisplay->buildMultiple(Array) (Line: 339) Drupal\Core\Entity\EntityViewBuilder->buildComponents(Array, Array, Array, 'full') (Line: 24) Drupal\node\NodeViewBuilder->buildComponents(Array, Array, Array, 'full') (Line: 281) Drupal\Core\Entity\EntityViewBuilder->buildMultiple(Array) (Line: 238) Drupal\Core\Entity\EntityViewBuilder->build(Array) call_user_func_array(Array, Array) (Line: 111) Drupal\Core\Render\Renderer->doTrustedCallback(Array, Array, 'Render #pre_render callbacks must be methods of a class that implements \Drupal\Core\Security\TrustedCallbackInterface or be an anonymous function. The callback was %s. See https://www.drupal.org/node/2966725', 'exception', 'Drupal\Core\Render\Element\RenderCallbackInterface') (Line: 859) Drupal\Core\Render\Renderer->doCallback('#pre_render', Array, Array) (Line: 421) Drupal\Core\Render\Renderer->doRender(Array, ) (Line: 240) Drupal\Core\Render\Renderer->render(Array, ) (Line: 238) Drupal\Core\Render\MainContent\HtmlRenderer->Drupal\Core\Render\MainContent\{closure}() (Line: 627) Drupal\Core\Render\Renderer->executeInRenderContext(Object, Object) (Line: 239) Drupal\Core\Render\MainContent\HtmlRenderer->prepare(Array, Object, Object) (Line: 128) Drupal\Core\Render\MainContent\HtmlRenderer->renderResponse(Array, Object, Object) (Line: 90) Drupal\Core\EventSubscriber\MainContentViewSubscriber->onViewRenderArray(Object, 'kernel.view', Object) call_user_func(Array, Object, 'kernel.view', Object) (Line: 111) Drupal\Component\EventDispatcher\ContainerAwareEventDispatcher->dispatch(Object, 'kernel.view') (Line: 186) Symfony\Component\HttpKernel\HttpKernel->handleRaw(Object, 1) (Line: 76) Symfony\Component\HttpKernel\HttpKernel->handle(Object, 1, 1) (Line: 58) Drupal\Core\StackMiddleware\Session->handle(Object, 1, 1) (Line: 48) Drupal\Core\StackMiddleware\KernelPreHandle->handle(Object, 1, 1) (Line: 28) Drupal\Core\StackMiddleware\ContentLength->handle(Object, 1, 1) (Line: 32) Drupal\big_pipe\StackMiddleware\ContentLength->handle(Object, 1, 1) (Line: 191) Drupal\page_cache\StackMiddleware\PageCache->fetch(Object, 1, 1) (Line: 128) Drupal\page_cache\StackMiddleware\PageCache->lookup(Object, 1, 1) (Line: 82) Drupal\page_cache\StackMiddleware\PageCache->handle(Object, 1, 1) (Line: 48) Drupal\Core\StackMiddleware\ReverseProxyMiddleware->handle(Object, 1, 1) (Line: 51) Drupal\Core\StackMiddleware\NegotiationMiddleware->handle(Object, 1, 1) (Line: 36) Drupal\Core\StackMiddleware\AjaxPageState->handle(Object, 1, 1) (Line: 51) Drupal\Core\StackMiddleware\StackedHttpKernel->handle(Object, 1, 1) (Line: 704) Drupal\Core\DrupalKernel->handle(Object) (Line: 19)Warning: Undefined array key "width" in template_preprocess_responsive_image() (line 209 of core/modules/responsive_image/responsive_image.module).
template_preprocess_responsive_image(Array) (Line: 101) Drupal\responsive_bg_image_formatter\Plugin\Field\FieldFormatter\ResponsiveBgImageFormatter->viewElements(Object, 'en') (Line: 91) Drupal\Core\Field\FormatterBase->view(Object, 'en') (Line: 76) Drupal\Core\Field\Plugin\Field\FieldFormatter\EntityReferenceFormatterBase->view(Object, NULL) (Line: 268) Drupal\Core\Entity\Entity\EntityViewDisplay->buildMultiple(Array) (Line: 339) Drupal\Core\Entity\EntityViewBuilder->buildComponents(Array, Array, Array, 'full') (Line: 24) Drupal\node\NodeViewBuilder->buildComponents(Array, Array, Array, 'full') (Line: 281) Drupal\Core\Entity\EntityViewBuilder->buildMultiple(Array) (Line: 238) Drupal\Core\Entity\EntityViewBuilder->build(Array) call_user_func_array(Array, Array) (Line: 111) Drupal\Core\Render\Renderer->doTrustedCallback(Array, Array, 'Render #pre_render callbacks must be methods of a class that implements \Drupal\Core\Security\TrustedCallbackInterface or be an anonymous function. The callback was %s. See https://www.drupal.org/node/2966725', 'exception', 'Drupal\Core\Render\Element\RenderCallbackInterface') (Line: 859) Drupal\Core\Render\Renderer->doCallback('#pre_render', Array, Array) (Line: 421) Drupal\Core\Render\Renderer->doRender(Array, ) (Line: 240) Drupal\Core\Render\Renderer->render(Array, ) (Line: 238) Drupal\Core\Render\MainContent\HtmlRenderer->Drupal\Core\Render\MainContent\{closure}() (Line: 627) Drupal\Core\Render\Renderer->executeInRenderContext(Object, Object) (Line: 239) Drupal\Core\Render\MainContent\HtmlRenderer->prepare(Array, Object, Object) (Line: 128) Drupal\Core\Render\MainContent\HtmlRenderer->renderResponse(Array, Object, Object) (Line: 90) Drupal\Core\EventSubscriber\MainContentViewSubscriber->onViewRenderArray(Object, 'kernel.view', Object) call_user_func(Array, Object, 'kernel.view', Object) (Line: 111) Drupal\Component\EventDispatcher\ContainerAwareEventDispatcher->dispatch(Object, 'kernel.view') (Line: 186) Symfony\Component\HttpKernel\HttpKernel->handleRaw(Object, 1) (Line: 76) Symfony\Component\HttpKernel\HttpKernel->handle(Object, 1, 1) (Line: 58) Drupal\Core\StackMiddleware\Session->handle(Object, 1, 1) (Line: 48) Drupal\Core\StackMiddleware\KernelPreHandle->handle(Object, 1, 1) (Line: 28) Drupal\Core\StackMiddleware\ContentLength->handle(Object, 1, 1) (Line: 32) Drupal\big_pipe\StackMiddleware\ContentLength->handle(Object, 1, 1) (Line: 191) Drupal\page_cache\StackMiddleware\PageCache->fetch(Object, 1, 1) (Line: 128) Drupal\page_cache\StackMiddleware\PageCache->lookup(Object, 1, 1) (Line: 82) Drupal\page_cache\StackMiddleware\PageCache->handle(Object, 1, 1) (Line: 48) Drupal\Core\StackMiddleware\ReverseProxyMiddleware->handle(Object, 1, 1) (Line: 51) Drupal\Core\StackMiddleware\NegotiationMiddleware->handle(Object, 1, 1) (Line: 36) Drupal\Core\StackMiddleware\AjaxPageState->handle(Object, 1, 1) (Line: 51) Drupal\Core\StackMiddleware\StackedHttpKernel->handle(Object, 1, 1) (Line: 704) Drupal\Core\DrupalKernel->handle(Object) (Line: 19)Warning: Undefined array key "height" in template_preprocess_responsive_image() (line 210 of core/modules/responsive_image/responsive_image.module).
template_preprocess_responsive_image(Array) (Line: 101) Drupal\responsive_bg_image_formatter\Plugin\Field\FieldFormatter\ResponsiveBgImageFormatter->viewElements(Object, 'en') (Line: 91) Drupal\Core\Field\FormatterBase->view(Object, 'en') (Line: 76) Drupal\Core\Field\Plugin\Field\FieldFormatter\EntityReferenceFormatterBase->view(Object, NULL) (Line: 268) Drupal\Core\Entity\Entity\EntityViewDisplay->buildMultiple(Array) (Line: 339) Drupal\Core\Entity\EntityViewBuilder->buildComponents(Array, Array, Array, 'full') (Line: 24) Drupal\node\NodeViewBuilder->buildComponents(Array, Array, Array, 'full') (Line: 281) Drupal\Core\Entity\EntityViewBuilder->buildMultiple(Array) (Line: 238) Drupal\Core\Entity\EntityViewBuilder->build(Array) call_user_func_array(Array, Array) (Line: 111) Drupal\Core\Render\Renderer->doTrustedCallback(Array, Array, 'Render #pre_render callbacks must be methods of a class that implements \Drupal\Core\Security\TrustedCallbackInterface or be an anonymous function. The callback was %s. See https://www.drupal.org/node/2966725', 'exception', 'Drupal\Core\Render\Element\RenderCallbackInterface') (Line: 859) Drupal\Core\Render\Renderer->doCallback('#pre_render', Array, Array) (Line: 421) Drupal\Core\Render\Renderer->doRender(Array, ) (Line: 240) Drupal\Core\Render\Renderer->render(Array, ) (Line: 238) Drupal\Core\Render\MainContent\HtmlRenderer->Drupal\Core\Render\MainContent\{closure}() (Line: 627) Drupal\Core\Render\Renderer->executeInRenderContext(Object, Object) (Line: 239) Drupal\Core\Render\MainContent\HtmlRenderer->prepare(Array, Object, Object) (Line: 128) Drupal\Core\Render\MainContent\HtmlRenderer->renderResponse(Array, Object, Object) (Line: 90) Drupal\Core\EventSubscriber\MainContentViewSubscriber->onViewRenderArray(Object, 'kernel.view', Object) call_user_func(Array, Object, 'kernel.view', Object) (Line: 111) Drupal\Component\EventDispatcher\ContainerAwareEventDispatcher->dispatch(Object, 'kernel.view') (Line: 186) Symfony\Component\HttpKernel\HttpKernel->handleRaw(Object, 1) (Line: 76) Symfony\Component\HttpKernel\HttpKernel->handle(Object, 1, 1) (Line: 58) Drupal\Core\StackMiddleware\Session->handle(Object, 1, 1) (Line: 48) Drupal\Core\StackMiddleware\KernelPreHandle->handle(Object, 1, 1) (Line: 28) Drupal\Core\StackMiddleware\ContentLength->handle(Object, 1, 1) (Line: 32) Drupal\big_pipe\StackMiddleware\ContentLength->handle(Object, 1, 1) (Line: 191) Drupal\page_cache\StackMiddleware\PageCache->fetch(Object, 1, 1) (Line: 128) Drupal\page_cache\StackMiddleware\PageCache->lookup(Object, 1, 1) (Line: 82) Drupal\page_cache\StackMiddleware\PageCache->handle(Object, 1, 1) (Line: 48) Drupal\Core\StackMiddleware\ReverseProxyMiddleware->handle(Object, 1, 1) (Line: 51) Drupal\Core\StackMiddleware\NegotiationMiddleware->handle(Object, 1, 1) (Line: 36) Drupal\Core\StackMiddleware\AjaxPageState->handle(Object, 1, 1) (Line: 51) Drupal\Core\StackMiddleware\StackedHttpKernel->handle(Object, 1, 1) (Line: 704) Drupal\Core\DrupalKernel->handle(Object) (Line: 19)Warning: Undefined array key "media" in Drupal\responsive_bg_image_formatter\Plugin\Field\FieldFormatter\ResponsiveBgImageFormatter->viewElements() (line 112 of modules/custom/responsive_bg_image_formatter/src/Plugin/Field/FieldFormatter/ResponsiveBgImageFormatter.php).
Drupal\responsive_bg_image_formatter\Plugin\Field\FieldFormatter\ResponsiveBgImageFormatter->viewElements(Object, 'en') (Line: 91)
Drupal\Core\Field\FormatterBase->view(Object, 'en') (Line: 76)
Drupal\Core\Field\Plugin\Field\FieldFormatter\EntityReferenceFormatterBase->view(Object, NULL) (Line: 268)
Drupal\Core\Entity\Entity\EntityViewDisplay->buildMultiple(Array) (Line: 339)
Drupal\Core\Entity\EntityViewBuilder->buildComponents(Array, Array, Array, 'full') (Line: 24)
Drupal\node\NodeViewBuilder->buildComponents(Array, Array, Array, 'full') (Line: 281)
Drupal\Core\Entity\EntityViewBuilder->buildMultiple(Array) (Line: 238)
Drupal\Core\Entity\EntityViewBuilder->build(Array)
call_user_func_array(Array, Array) (Line: 111)
Drupal\Core\Render\Renderer->doTrustedCallback(Array, Array, 'Render #pre_render callbacks must be methods of a class that implements \Drupal\Core\Security\TrustedCallbackInterface or be an anonymous function. The callback was %s. See https://www.drupal.org/node/2966725', 'exception', 'Drupal\Core\Render\Element\RenderCallbackInterface') (Line: 859)
Drupal\Core\Render\Renderer->doCallback('#pre_render', Array, Array) (Line: 421)
Drupal\Core\Render\Renderer->doRender(Array, ) (Line: 240)
Drupal\Core\Render\Renderer->render(Array, ) (Line: 238)
Drupal\Core\Render\MainContent\HtmlRenderer->Drupal\Core\Render\MainContent\{closure}() (Line: 627)
Drupal\Core\Render\Renderer->executeInRenderContext(Object, Object) (Line: 239)
Drupal\Core\Render\MainContent\HtmlRenderer->prepare(Array, Object, Object) (Line: 128)
Drupal\Core\Render\MainContent\HtmlRenderer->renderResponse(Array, Object, Object) (Line: 90)
Drupal\Core\EventSubscriber\MainContentViewSubscriber->onViewRenderArray(Object, 'kernel.view', Object)
call_user_func(Array, Object, 'kernel.view', Object) (Line: 111)
Drupal\Component\EventDispatcher\ContainerAwareEventDispatcher->dispatch(Object, 'kernel.view') (Line: 186)
Symfony\Component\HttpKernel\HttpKernel->handleRaw(Object, 1) (Line: 76)
Symfony\Component\HttpKernel\HttpKernel->handle(Object, 1, 1) (Line: 58)
Drupal\Core\StackMiddleware\Session->handle(Object, 1, 1) (Line: 48)
Drupal\Core\StackMiddleware\KernelPreHandle->handle(Object, 1, 1) (Line: 28)
Drupal\Core\StackMiddleware\ContentLength->handle(Object, 1, 1) (Line: 32)
Drupal\big_pipe\StackMiddleware\ContentLength->handle(Object, 1, 1) (Line: 191)
Drupal\page_cache\StackMiddleware\PageCache->fetch(Object, 1, 1) (Line: 128)
Drupal\page_cache\StackMiddleware\PageCache->lookup(Object, 1, 1) (Line: 82)
Drupal\page_cache\StackMiddleware\PageCache->handle(Object, 1, 1) (Line: 48)
Drupal\Core\StackMiddleware\ReverseProxyMiddleware->handle(Object, 1, 1) (Line: 51)
Drupal\Core\StackMiddleware\NegotiationMiddleware->handle(Object, 1, 1) (Line: 36)
Drupal\Core\StackMiddleware\AjaxPageState->handle(Object, 1, 1) (Line: 51)
Drupal\Core\StackMiddleware\StackedHttpKernel->handle(Object, 1, 1) (Line: 704)
Drupal\Core\DrupalKernel->handle(Object) (Line: 19)
Deprecated function: str_replace(): Passing null to parameter #3 ($subject) of type array|string is deprecated in Drupal\responsive_bg_image_formatter\Plugin\Field\FieldFormatter\ResponsiveBgImageFormatter->viewElements() (line 126 of modules/custom/responsive_bg_image_formatter/src/Plugin/Field/FieldFormatter/ResponsiveBgImageFormatter.php).
Drupal\responsive_bg_image_formatter\Plugin\Field\FieldFormatter\ResponsiveBgImageFormatter->viewElements(Object, 'en') (Line: 91) Drupal\Core\Field\FormatterBase->view(Object, 'en') (Line: 76) Drupal\Core\Field\Plugin\Field\FieldFormatter\EntityReferenceFormatterBase->view(Object, NULL) (Line: 268) Drupal\Core\Entity\Entity\EntityViewDisplay->buildMultiple(Array) (Line: 339) Drupal\Core\Entity\EntityViewBuilder->buildComponents(Array, Array, Array, 'full') (Line: 24) Drupal\node\NodeViewBuilder->buildComponents(Array, Array, Array, 'full') (Line: 281) Drupal\Core\Entity\EntityViewBuilder->buildMultiple(Array) (Line: 238) Drupal\Core\Entity\EntityViewBuilder->build(Array) call_user_func_array(Array, Array) (Line: 111) Drupal\Core\Render\Renderer->doTrustedCallback(Array, Array, 'Render #pre_render callbacks must be methods of a class that implements \Drupal\Core\Security\TrustedCallbackInterface or be an anonymous function. The callback was %s. See https://www.drupal.org/node/2966725', 'exception', 'Drupal\Core\Render\Element\RenderCallbackInterface') (Line: 859) Drupal\Core\Render\Renderer->doCallback('#pre_render', Array, Array) (Line: 421) Drupal\Core\Render\Renderer->doRender(Array, ) (Line: 240) Drupal\Core\Render\Renderer->render(Array, ) (Line: 238) Drupal\Core\Render\MainContent\HtmlRenderer->Drupal\Core\Render\MainContent\{closure}() (Line: 627) Drupal\Core\Render\Renderer->executeInRenderContext(Object, Object) (Line: 239) Drupal\Core\Render\MainContent\HtmlRenderer->prepare(Array, Object, Object) (Line: 128) Drupal\Core\Render\MainContent\HtmlRenderer->renderResponse(Array, Object, Object) (Line: 90) Drupal\Core\EventSubscriber\MainContentViewSubscriber->onViewRenderArray(Object, 'kernel.view', Object) call_user_func(Array, Object, 'kernel.view', Object) (Line: 111) Drupal\Component\EventDispatcher\ContainerAwareEventDispatcher->dispatch(Object, 'kernel.view') (Line: 186) Symfony\Component\HttpKernel\HttpKernel->handleRaw(Object, 1) (Line: 76) Symfony\Component\HttpKernel\HttpKernel->handle(Object, 1, 1) (Line: 58) Drupal\Core\StackMiddleware\Session->handle(Object, 1, 1) (Line: 48) Drupal\Core\StackMiddleware\KernelPreHandle->handle(Object, 1, 1) (Line: 28) Drupal\Core\StackMiddleware\ContentLength->handle(Object, 1, 1) (Line: 32) Drupal\big_pipe\StackMiddleware\ContentLength->handle(Object, 1, 1) (Line: 191) Drupal\page_cache\StackMiddleware\PageCache->fetch(Object, 1, 1) (Line: 128) Drupal\page_cache\StackMiddleware\PageCache->lookup(Object, 1, 1) (Line: 82) Drupal\page_cache\StackMiddleware\PageCache->handle(Object, 1, 1) (Line: 48) Drupal\Core\StackMiddleware\ReverseProxyMiddleware->handle(Object, 1, 1) (Line: 51) Drupal\Core\StackMiddleware\NegotiationMiddleware->handle(Object, 1, 1) (Line: 36) Drupal\Core\StackMiddleware\AjaxPageState->handle(Object, 1, 1) (Line: 51) Drupal\Core\StackMiddleware\StackedHttpKernel->handle(Object, 1, 1) (Line: 704) Drupal\Core\DrupalKernel->handle(Object) (Line: 19)Warning: Undefined variable $index in Drupal\responsive_bg_image_formatter\Plugin\Field\FieldFormatter\ResponsiveBgImageFormatter->viewElements() (line 153 of modules/custom/responsive_bg_image_formatter/src/Plugin/Field/FieldFormatter/ResponsiveBgImageFormatter.php).
Drupal\responsive_bg_image_formatter\Plugin\Field\FieldFormatter\ResponsiveBgImageFormatter->viewElements(Object, 'en') (Line: 91)
Drupal\Core\Field\FormatterBase->view(Object, 'en') (Line: 76)
Drupal\Core\Field\Plugin\Field\FieldFormatter\EntityReferenceFormatterBase->view(Object, NULL) (Line: 268)
Drupal\Core\Entity\Entity\EntityViewDisplay->buildMultiple(Array) (Line: 339)
Drupal\Core\Entity\EntityViewBuilder->buildComponents(Array, Array, Array, 'full') (Line: 24)
Drupal\node\NodeViewBuilder->buildComponents(Array, Array, Array, 'full') (Line: 281)
Drupal\Core\Entity\EntityViewBuilder->buildMultiple(Array) (Line: 238)
Drupal\Core\Entity\EntityViewBuilder->build(Array)
call_user_func_array(Array, Array) (Line: 111)
Drupal\Core\Render\Renderer->doTrustedCallback(Array, Array, 'Render #pre_render callbacks must be methods of a class that implements \Drupal\Core\Security\TrustedCallbackInterface or be an anonymous function. The callback was %s. See https://www.drupal.org/node/2966725', 'exception', 'Drupal\Core\Render\Element\RenderCallbackInterface') (Line: 859)
Drupal\Core\Render\Renderer->doCallback('#pre_render', Array, Array) (Line: 421)
Drupal\Core\Render\Renderer->doRender(Array, ) (Line: 240)
Drupal\Core\Render\Renderer->render(Array, ) (Line: 238)
Drupal\Core\Render\MainContent\HtmlRenderer->Drupal\Core\Render\MainContent\{closure}() (Line: 627)
Drupal\Core\Render\Renderer->executeInRenderContext(Object, Object) (Line: 239)
Drupal\Core\Render\MainContent\HtmlRenderer->prepare(Array, Object, Object) (Line: 128)
Drupal\Core\Render\MainContent\HtmlRenderer->renderResponse(Array, Object, Object) (Line: 90)
Drupal\Core\EventSubscriber\MainContentViewSubscriber->onViewRenderArray(Object, 'kernel.view', Object)
call_user_func(Array, Object, 'kernel.view', Object) (Line: 111)
Drupal\Component\EventDispatcher\ContainerAwareEventDispatcher->dispatch(Object, 'kernel.view') (Line: 186)
Symfony\Component\HttpKernel\HttpKernel->handleRaw(Object, 1) (Line: 76)
Symfony\Component\HttpKernel\HttpKernel->handle(Object, 1, 1) (Line: 58)
Drupal\Core\StackMiddleware\Session->handle(Object, 1, 1) (Line: 48)
Drupal\Core\StackMiddleware\KernelPreHandle->handle(Object, 1, 1) (Line: 28)
Drupal\Core\StackMiddleware\ContentLength->handle(Object, 1, 1) (Line: 32)
Drupal\big_pipe\StackMiddleware\ContentLength->handle(Object, 1, 1) (Line: 191)
Drupal\page_cache\StackMiddleware\PageCache->fetch(Object, 1, 1) (Line: 128)
Drupal\page_cache\StackMiddleware\PageCache->lookup(Object, 1, 1) (Line: 82)
Drupal\page_cache\StackMiddleware\PageCache->handle(Object, 1, 1) (Line: 48)
Drupal\Core\StackMiddleware\ReverseProxyMiddleware->handle(Object, 1, 1) (Line: 51)
Drupal\Core\StackMiddleware\NegotiationMiddleware->handle(Object, 1, 1) (Line: 36)
Drupal\Core\StackMiddleware\AjaxPageState->handle(Object, 1, 1) (Line: 51)
Drupal\Core\StackMiddleware\StackedHttpKernel->handle(Object, 1, 1) (Line: 704)
Drupal\Core\DrupalKernel->handle(Object) (Line: 19)
Please note: Due to a system outage with NOAA's National Centers for Environmental Information, certain maps and statistics on Drought.gov may be experiencing issues. We apologize for any inconvenience and are working to resolve these issues quickly
Snow drought impacts have intensified as snow melted weeks early this spring.
Key Points
- Remaining higher-elevation western snowpack is well below normal with the exception of Washington, parts of Montana, and the South Platte Basin that drains the Front Range of Colorado.
- The 2020–2021 snow drought was initially caused primarily by a lack of precipitation and storminess, and intensified after April 1. A huge, and in some cases record breaking, decline in snow water equivalent percent of normal was observed throughout April due to warm and dry conditions.
- Much of the western snow melted one to four weeks early, including three to four weeks early in the Sierra.
- Low snowpack, rapid melt out, and poor runoff efficiency have led to significant water supply concerns going into summer of 2021. Click here to learn more about the impacts of snow drought.
This USDA Natural Resources Conservation Service (NRCS) map shows Snow Telemetry (SNOTEL) snow water equivalent (SWE) basin values over the western U.S. as a percent of the NRCS 1981–2010 median. Only stations with at least 20 years of data are included in the station averages.
The SWE percent of normal represents the current SWE found at selected SNOTEL sites in or near the basin compared to the average value for those sites on this day. This map is valid as of June 8, 2021.
For an interactive version of this map, please visit NRCS.
This USDA Natural Resources Conservation Service (NRCS) map shows Snow Telemetry (SNOTEL) water year-to-date precipitation basin values over the western U.S. as a percent of the NRCS 1981–2010 median. Only stations with at least 20 years of data are included in the station averages.
The precipitation percent of normal represents the current precipitation found at selected SNOTEL sites in or near the basin compared to the average value for those sites on this day. This map is valid as of June 6, 2021.
For an interactive version of this map, please visit NRCS.
This USDA Natural Resources Conservation Service (NRCS) map shows Snow Telemetry (SNOTEL) water year-to-date precipitation basin values over Alaska as a percent of the NRCS 1981–2010 median. Only stations with at least 20 years of data are included in the station averages.
The precipitation percent of normal represents the current precipitation found at selected SNOTEL sites in or near the basin compared to the average value for those sites on this day. This map is valid as of June 6, 2021.
For an interactive version of this map, please visit NRCS.
SWE Percent of NRCS 1981-2010 Median
This USDA Natural Resources Conservation Service (NRCS) map shows Snow Telemetry (SNOTEL) snow water equivalent (SWE) basin values over the western U.S. as a percent of the NRCS 1981–2010 median. Only stations with at least 20 years of data are included in the station averages.
The SWE percent of normal represents the current SWE found at selected SNOTEL sites in or near the basin compared to the average value for those sites on this day. This map is valid as of June 8, 2021.
For an interactive version of this map, please visit NRCS.
This USDA Natural Resources Conservation Service (NRCS) map shows Snow Telemetry (SNOTEL) water year-to-date precipitation basin values over the western U.S. as a percent of the NRCS 1981–2010 median. Only stations with at least 20 years of data are included in the station averages.
The precipitation percent of normal represents the current precipitation found at selected SNOTEL sites in or near the basin compared to the average value for those sites on this day. This map is valid as of June 6, 2021.
For an interactive version of this map, please visit NRCS.
This USDA Natural Resources Conservation Service (NRCS) map shows Snow Telemetry (SNOTEL) water year-to-date precipitation basin values over Alaska as a percent of the NRCS 1981–2010 median. Only stations with at least 20 years of data are included in the station averages.
The precipitation percent of normal represents the current precipitation found at selected SNOTEL sites in or near the basin compared to the average value for those sites on this day. This map is valid as of June 6, 2021.
For an interactive version of this map, please visit NRCS.
Water Year 2021 Snow Drought Conditions Summary
Higher-elevation snowpack that remains throughout the West is well below normal with the exception of Washington, parts of Montana, and the South Platte Basin that drains the Front Range of Colorado. In the Sierra Nevada, snowpack is just about gone at SNOTEL elevations. For example, Mount Rose Ski Area, Nevada, on the northeast side of Lake Tahoe in the Carson Range, melted out on May 14, and the median melt out date was June 10. Melt out three to four weeks early was common throughout the Sierra. Throughout Utah, the Upper Colorado, and northern Rockies states of Idaho, Wyoming, and Montana, many sites melted out one to three weeks early.
Alaska mountain snowpack was generally typical for early June in the Chugach and Kenai mountains of south-central Alaska. A cool and wet spring has maintained higher-elevation snowpack in much of southeast Alaska except the far south, where precipitation and temperatures have been closer to normal.
Snow drought conditions developed early in the winter throughout California, the Great Basin, parts of Oregon, the Lower Colorado, and the Upper Colorado, with the most severe conditions initially in the Lower Colorado. Lack of precipitation and storminess was the initial driver of this snow drought, although temperatures throughout the West were above normal much of the winter and spring, particularly during the long dry spells. Strong storms in January brought some improvement to California, the Great Basin, and the Lower Colorado, but most basins still remained about 60%–80% of normal snow water equivalent (SWE) at the end of January. A series of atmospheric rivers in February brought a brief recovery from snow drought through heavy precipitation and snowfall to the mountains of the Pacific Northwest and Oregon into the northern Rockies. March was a very dry month except for parts of Utah, eastern Colorado, and Wyoming.
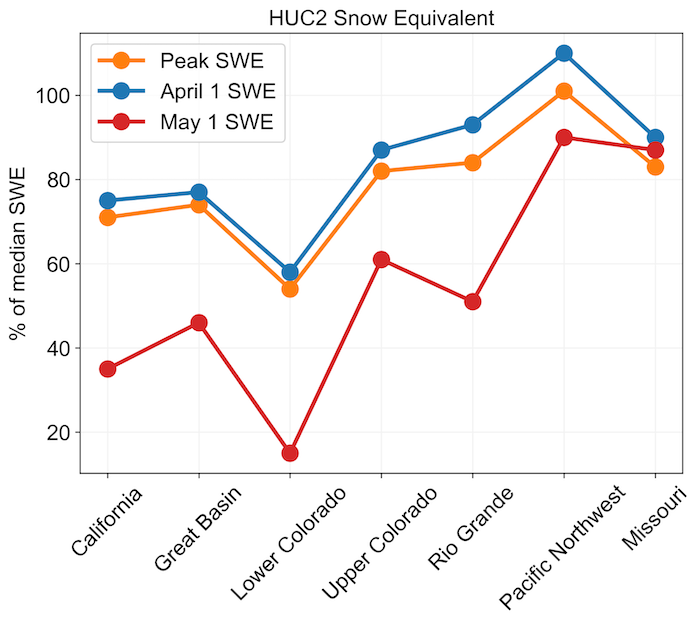
April 1 is a critical date for Western snowpack as it is often near peak SWE and, more importantly, is used as input for spring and summer water supply forecasts. Much of the West had below-normal SWE on April 1, although the severity of the snow drought was not nearly as bad as the benchmark 2015 snow drought when huge areas of the West were below 50% of normal SWE by April 1. Large river basin (HUC2) April 1 SWE percent of normal was at 75% for California, 77% for the Great Basin, 58% for the Lower Colorado, 87% for the Upper Colorado, 93% for the Rio Grande, 110% for the Pacific Northwest, and 90% for the Missouri. A huge, and in some cases record breaking, decline in SWE percent of normal was observed throughout April, and snow drought conditions intensified rapidly in just one month. By May 1, all of the HUC2 basins except for the Pacific Northwest and Missouri were between 15% and 61% of normal SWE. Temperatures soared to well above normal the first week of April, and dry conditions persisted throughout the whole month, leading to rapid snow melt rates. The dry and warm conditions allowed rapid melt to occur even in higher elevation basins like the Upper Colorado that typically have peak SWE several weeks after April 1.
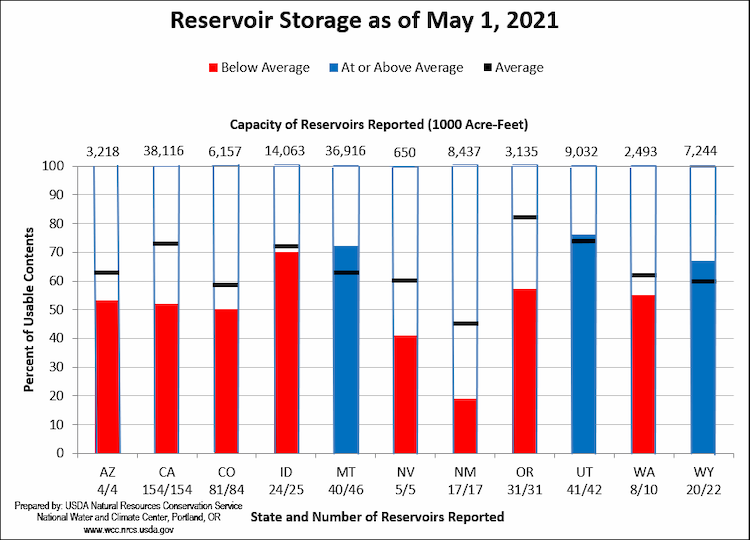
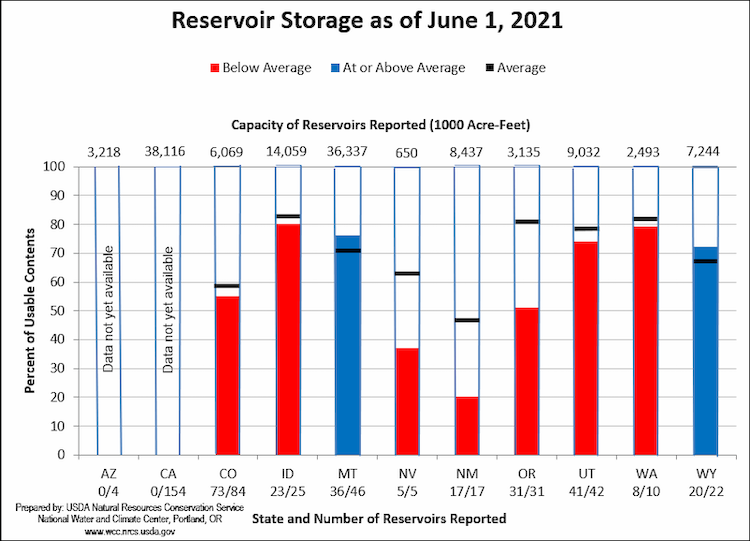
The 2021 snow drought in the West highlights the need to track these events from the beginning of the snow accumulation season throughout the melt season. If April 1 or peak SWE was used as the snow drought indicator this year, the severity and downstream impacts that occurred throughout April would be lost. Low snowpack, rapid melt out, and poor runoff efficiency have led to significant water supply concerns going into the summer of 2021. The two biggest reservoirs in the U.S., Lake Powell and Lake Mead, are nearing historic lows, and a Colorado River water shortage is looming; many reservoirs throughout California are as low or lower for early June than during any of the 2012–2015 drought years. Click here to learn more about the impacts of snow drought on water management, ecosystems, recreation and tourism, and more.
April 2021 Precipitation: Western U.S.
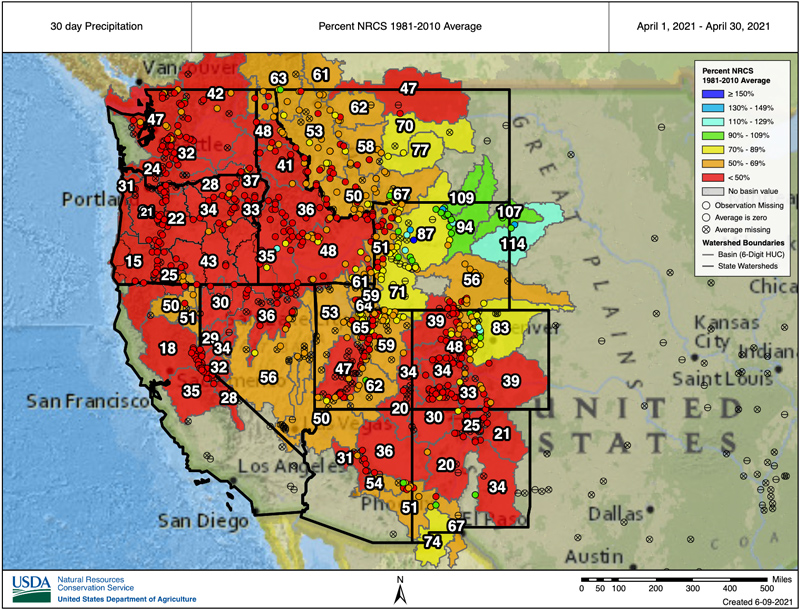
The precipitation percent of normal represents the current precipitation found at selected SNOTEL sites in or near the basin compared to the average value for those sites on this day. This map is valid as of April 30, 2021. For an interactive version of this map, please visit NRCS.
HUC2 River Basin Snow Water Equivalent
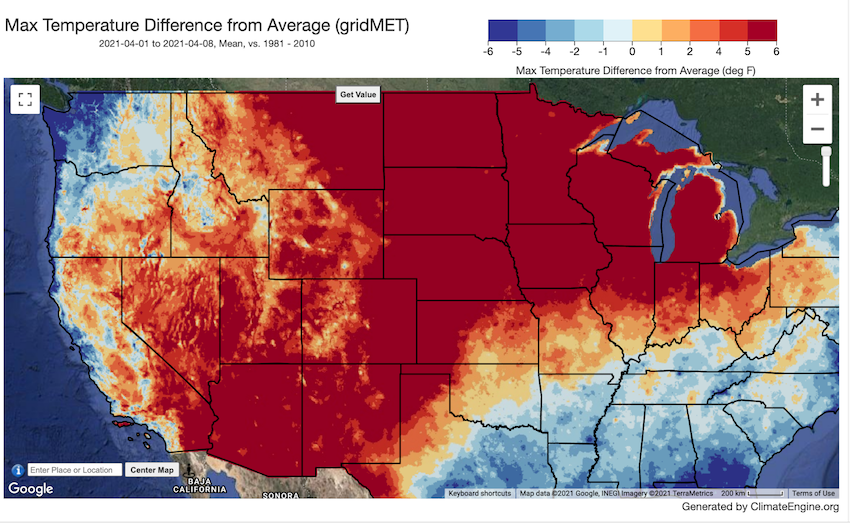
Maximum Temperature Departure from Average: April 1–8, 2021
Reservoir Storage for the Western U.S.
For More Information, Please Contact:
Daniel McEvoy
Western Regional Climate Center
Daniel.McEvoy@dri.edu
Amanda Sheffield
NOAA/NIDIS California-Nevada Regional Drought Information Coordinator
Amanda.Sheffield@noaa.gov
Britt Parker
NOAA/NIDIS Pacific Northwest and Missouri River Basin Regional Drought Information Coordinator
Britt.Parker@noaa.gov
NIDIS and its partners launched this snow drought effort in 2018 to provide data, maps, and tools for monitoring snow drought and its impacts as well as communicating the status of snow drought across the United States, including Alaska. Thank you to our partners for your continued support of this effort and review of these updates. If you would like to report snow drought impacts, please use the link below. Information collected will be shared with the states affected to help us better understand the short term, long term, and cumulative impacts of snow drought to the citizens and the economy of the regions reliant on snowpack.
Report your Snow Drought Impacts Data and Maps | Snow Drought Research and Learn | Snow Drought

