Warning: Undefined variable $index in Drupal\responsive_bg_image_formatter\Plugin\Field\FieldFormatter\ResponsiveBgImageFormatter->viewElements() (line 95 of modules/custom/responsive_bg_image_formatter/src/Plugin/Field/FieldFormatter/ResponsiveBgImageFormatter.php).
Drupal\responsive_bg_image_formatter\Plugin\Field\FieldFormatter\ResponsiveBgImageFormatter->viewElements(Object, 'en') (Line: 91) Drupal\Core\Field\FormatterBase->view(Object, 'en') (Line: 76) Drupal\Core\Field\Plugin\Field\FieldFormatter\EntityReferenceFormatterBase->view(Object, NULL) (Line: 268) Drupal\Core\Entity\Entity\EntityViewDisplay->buildMultiple(Array) (Line: 339) Drupal\Core\Entity\EntityViewBuilder->buildComponents(Array, Array, Array, 'full') (Line: 24) Drupal\node\NodeViewBuilder->buildComponents(Array, Array, Array, 'full') (Line: 281) Drupal\Core\Entity\EntityViewBuilder->buildMultiple(Array) (Line: 238) Drupal\Core\Entity\EntityViewBuilder->build(Array) call_user_func_array(Array, Array) (Line: 111) Drupal\Core\Render\Renderer->doTrustedCallback(Array, Array, 'Render #pre_render callbacks must be methods of a class that implements \Drupal\Core\Security\TrustedCallbackInterface or be an anonymous function. The callback was %s. See https://www.drupal.org/node/2966725', 'exception', 'Drupal\Core\Render\Element\RenderCallbackInterface') (Line: 859) Drupal\Core\Render\Renderer->doCallback('#pre_render', Array, Array) (Line: 421) Drupal\Core\Render\Renderer->doRender(Array, ) (Line: 240) Drupal\Core\Render\Renderer->render(Array, ) (Line: 238) Drupal\Core\Render\MainContent\HtmlRenderer->Drupal\Core\Render\MainContent\{closure}() (Line: 627) Drupal\Core\Render\Renderer->executeInRenderContext(Object, Object) (Line: 239) Drupal\Core\Render\MainContent\HtmlRenderer->prepare(Array, Object, Object) (Line: 128) Drupal\Core\Render\MainContent\HtmlRenderer->renderResponse(Array, Object, Object) (Line: 90) Drupal\Core\EventSubscriber\MainContentViewSubscriber->onViewRenderArray(Object, 'kernel.view', Object) call_user_func(Array, Object, 'kernel.view', Object) (Line: 111) Drupal\Component\EventDispatcher\ContainerAwareEventDispatcher->dispatch(Object, 'kernel.view') (Line: 186) Symfony\Component\HttpKernel\HttpKernel->handleRaw(Object, 1) (Line: 76) Symfony\Component\HttpKernel\HttpKernel->handle(Object, 1, 1) (Line: 58) Drupal\Core\StackMiddleware\Session->handle(Object, 1, 1) (Line: 48) Drupal\Core\StackMiddleware\KernelPreHandle->handle(Object, 1, 1) (Line: 28) Drupal\Core\StackMiddleware\ContentLength->handle(Object, 1, 1) (Line: 32) Drupal\big_pipe\StackMiddleware\ContentLength->handle(Object, 1, 1) (Line: 191) Drupal\page_cache\StackMiddleware\PageCache->fetch(Object, 1, 1) (Line: 128) Drupal\page_cache\StackMiddleware\PageCache->lookup(Object, 1, 1) (Line: 82) Drupal\page_cache\StackMiddleware\PageCache->handle(Object, 1, 1) (Line: 48) Drupal\Core\StackMiddleware\ReverseProxyMiddleware->handle(Object, 1, 1) (Line: 51) Drupal\Core\StackMiddleware\NegotiationMiddleware->handle(Object, 1, 1) (Line: 36) Drupal\Core\StackMiddleware\AjaxPageState->handle(Object, 1, 1) (Line: 51) Drupal\Core\StackMiddleware\StackedHttpKernel->handle(Object, 1, 1) (Line: 704) Drupal\Core\DrupalKernel->handle(Object) (Line: 19)Warning: Undefined array key "width" in template_preprocess_responsive_image() (line 209 of core/modules/responsive_image/responsive_image.module).
template_preprocess_responsive_image(Array) (Line: 101) Drupal\responsive_bg_image_formatter\Plugin\Field\FieldFormatter\ResponsiveBgImageFormatter->viewElements(Object, 'en') (Line: 91) Drupal\Core\Field\FormatterBase->view(Object, 'en') (Line: 76) Drupal\Core\Field\Plugin\Field\FieldFormatter\EntityReferenceFormatterBase->view(Object, NULL) (Line: 268) Drupal\Core\Entity\Entity\EntityViewDisplay->buildMultiple(Array) (Line: 339) Drupal\Core\Entity\EntityViewBuilder->buildComponents(Array, Array, Array, 'full') (Line: 24) Drupal\node\NodeViewBuilder->buildComponents(Array, Array, Array, 'full') (Line: 281) Drupal\Core\Entity\EntityViewBuilder->buildMultiple(Array) (Line: 238) Drupal\Core\Entity\EntityViewBuilder->build(Array) call_user_func_array(Array, Array) (Line: 111) Drupal\Core\Render\Renderer->doTrustedCallback(Array, Array, 'Render #pre_render callbacks must be methods of a class that implements \Drupal\Core\Security\TrustedCallbackInterface or be an anonymous function. The callback was %s. See https://www.drupal.org/node/2966725', 'exception', 'Drupal\Core\Render\Element\RenderCallbackInterface') (Line: 859) Drupal\Core\Render\Renderer->doCallback('#pre_render', Array, Array) (Line: 421) Drupal\Core\Render\Renderer->doRender(Array, ) (Line: 240) Drupal\Core\Render\Renderer->render(Array, ) (Line: 238) Drupal\Core\Render\MainContent\HtmlRenderer->Drupal\Core\Render\MainContent\{closure}() (Line: 627) Drupal\Core\Render\Renderer->executeInRenderContext(Object, Object) (Line: 239) Drupal\Core\Render\MainContent\HtmlRenderer->prepare(Array, Object, Object) (Line: 128) Drupal\Core\Render\MainContent\HtmlRenderer->renderResponse(Array, Object, Object) (Line: 90) Drupal\Core\EventSubscriber\MainContentViewSubscriber->onViewRenderArray(Object, 'kernel.view', Object) call_user_func(Array, Object, 'kernel.view', Object) (Line: 111) Drupal\Component\EventDispatcher\ContainerAwareEventDispatcher->dispatch(Object, 'kernel.view') (Line: 186) Symfony\Component\HttpKernel\HttpKernel->handleRaw(Object, 1) (Line: 76) Symfony\Component\HttpKernel\HttpKernel->handle(Object, 1, 1) (Line: 58) Drupal\Core\StackMiddleware\Session->handle(Object, 1, 1) (Line: 48) Drupal\Core\StackMiddleware\KernelPreHandle->handle(Object, 1, 1) (Line: 28) Drupal\Core\StackMiddleware\ContentLength->handle(Object, 1, 1) (Line: 32) Drupal\big_pipe\StackMiddleware\ContentLength->handle(Object, 1, 1) (Line: 191) Drupal\page_cache\StackMiddleware\PageCache->fetch(Object, 1, 1) (Line: 128) Drupal\page_cache\StackMiddleware\PageCache->lookup(Object, 1, 1) (Line: 82) Drupal\page_cache\StackMiddleware\PageCache->handle(Object, 1, 1) (Line: 48) Drupal\Core\StackMiddleware\ReverseProxyMiddleware->handle(Object, 1, 1) (Line: 51) Drupal\Core\StackMiddleware\NegotiationMiddleware->handle(Object, 1, 1) (Line: 36) Drupal\Core\StackMiddleware\AjaxPageState->handle(Object, 1, 1) (Line: 51) Drupal\Core\StackMiddleware\StackedHttpKernel->handle(Object, 1, 1) (Line: 704) Drupal\Core\DrupalKernel->handle(Object) (Line: 19)Warning: Undefined array key "height" in template_preprocess_responsive_image() (line 210 of core/modules/responsive_image/responsive_image.module).
template_preprocess_responsive_image(Array) (Line: 101) Drupal\responsive_bg_image_formatter\Plugin\Field\FieldFormatter\ResponsiveBgImageFormatter->viewElements(Object, 'en') (Line: 91) Drupal\Core\Field\FormatterBase->view(Object, 'en') (Line: 76) Drupal\Core\Field\Plugin\Field\FieldFormatter\EntityReferenceFormatterBase->view(Object, NULL) (Line: 268) Drupal\Core\Entity\Entity\EntityViewDisplay->buildMultiple(Array) (Line: 339) Drupal\Core\Entity\EntityViewBuilder->buildComponents(Array, Array, Array, 'full') (Line: 24) Drupal\node\NodeViewBuilder->buildComponents(Array, Array, Array, 'full') (Line: 281) Drupal\Core\Entity\EntityViewBuilder->buildMultiple(Array) (Line: 238) Drupal\Core\Entity\EntityViewBuilder->build(Array) call_user_func_array(Array, Array) (Line: 111) Drupal\Core\Render\Renderer->doTrustedCallback(Array, Array, 'Render #pre_render callbacks must be methods of a class that implements \Drupal\Core\Security\TrustedCallbackInterface or be an anonymous function. The callback was %s. See https://www.drupal.org/node/2966725', 'exception', 'Drupal\Core\Render\Element\RenderCallbackInterface') (Line: 859) Drupal\Core\Render\Renderer->doCallback('#pre_render', Array, Array) (Line: 421) Drupal\Core\Render\Renderer->doRender(Array, ) (Line: 240) Drupal\Core\Render\Renderer->render(Array, ) (Line: 238) Drupal\Core\Render\MainContent\HtmlRenderer->Drupal\Core\Render\MainContent\{closure}() (Line: 627) Drupal\Core\Render\Renderer->executeInRenderContext(Object, Object) (Line: 239) Drupal\Core\Render\MainContent\HtmlRenderer->prepare(Array, Object, Object) (Line: 128) Drupal\Core\Render\MainContent\HtmlRenderer->renderResponse(Array, Object, Object) (Line: 90) Drupal\Core\EventSubscriber\MainContentViewSubscriber->onViewRenderArray(Object, 'kernel.view', Object) call_user_func(Array, Object, 'kernel.view', Object) (Line: 111) Drupal\Component\EventDispatcher\ContainerAwareEventDispatcher->dispatch(Object, 'kernel.view') (Line: 186) Symfony\Component\HttpKernel\HttpKernel->handleRaw(Object, 1) (Line: 76) Symfony\Component\HttpKernel\HttpKernel->handle(Object, 1, 1) (Line: 58) Drupal\Core\StackMiddleware\Session->handle(Object, 1, 1) (Line: 48) Drupal\Core\StackMiddleware\KernelPreHandle->handle(Object, 1, 1) (Line: 28) Drupal\Core\StackMiddleware\ContentLength->handle(Object, 1, 1) (Line: 32) Drupal\big_pipe\StackMiddleware\ContentLength->handle(Object, 1, 1) (Line: 191) Drupal\page_cache\StackMiddleware\PageCache->fetch(Object, 1, 1) (Line: 128) Drupal\page_cache\StackMiddleware\PageCache->lookup(Object, 1, 1) (Line: 82) Drupal\page_cache\StackMiddleware\PageCache->handle(Object, 1, 1) (Line: 48) Drupal\Core\StackMiddleware\ReverseProxyMiddleware->handle(Object, 1, 1) (Line: 51) Drupal\Core\StackMiddleware\NegotiationMiddleware->handle(Object, 1, 1) (Line: 36) Drupal\Core\StackMiddleware\AjaxPageState->handle(Object, 1, 1) (Line: 51) Drupal\Core\StackMiddleware\StackedHttpKernel->handle(Object, 1, 1) (Line: 704) Drupal\Core\DrupalKernel->handle(Object) (Line: 19)Warning: Undefined array key "media" in Drupal\responsive_bg_image_formatter\Plugin\Field\FieldFormatter\ResponsiveBgImageFormatter->viewElements() (line 112 of modules/custom/responsive_bg_image_formatter/src/Plugin/Field/FieldFormatter/ResponsiveBgImageFormatter.php).
Drupal\responsive_bg_image_formatter\Plugin\Field\FieldFormatter\ResponsiveBgImageFormatter->viewElements(Object, 'en') (Line: 91)
Drupal\Core\Field\FormatterBase->view(Object, 'en') (Line: 76)
Drupal\Core\Field\Plugin\Field\FieldFormatter\EntityReferenceFormatterBase->view(Object, NULL) (Line: 268)
Drupal\Core\Entity\Entity\EntityViewDisplay->buildMultiple(Array) (Line: 339)
Drupal\Core\Entity\EntityViewBuilder->buildComponents(Array, Array, Array, 'full') (Line: 24)
Drupal\node\NodeViewBuilder->buildComponents(Array, Array, Array, 'full') (Line: 281)
Drupal\Core\Entity\EntityViewBuilder->buildMultiple(Array) (Line: 238)
Drupal\Core\Entity\EntityViewBuilder->build(Array)
call_user_func_array(Array, Array) (Line: 111)
Drupal\Core\Render\Renderer->doTrustedCallback(Array, Array, 'Render #pre_render callbacks must be methods of a class that implements \Drupal\Core\Security\TrustedCallbackInterface or be an anonymous function. The callback was %s. See https://www.drupal.org/node/2966725', 'exception', 'Drupal\Core\Render\Element\RenderCallbackInterface') (Line: 859)
Drupal\Core\Render\Renderer->doCallback('#pre_render', Array, Array) (Line: 421)
Drupal\Core\Render\Renderer->doRender(Array, ) (Line: 240)
Drupal\Core\Render\Renderer->render(Array, ) (Line: 238)
Drupal\Core\Render\MainContent\HtmlRenderer->Drupal\Core\Render\MainContent\{closure}() (Line: 627)
Drupal\Core\Render\Renderer->executeInRenderContext(Object, Object) (Line: 239)
Drupal\Core\Render\MainContent\HtmlRenderer->prepare(Array, Object, Object) (Line: 128)
Drupal\Core\Render\MainContent\HtmlRenderer->renderResponse(Array, Object, Object) (Line: 90)
Drupal\Core\EventSubscriber\MainContentViewSubscriber->onViewRenderArray(Object, 'kernel.view', Object)
call_user_func(Array, Object, 'kernel.view', Object) (Line: 111)
Drupal\Component\EventDispatcher\ContainerAwareEventDispatcher->dispatch(Object, 'kernel.view') (Line: 186)
Symfony\Component\HttpKernel\HttpKernel->handleRaw(Object, 1) (Line: 76)
Symfony\Component\HttpKernel\HttpKernel->handle(Object, 1, 1) (Line: 58)
Drupal\Core\StackMiddleware\Session->handle(Object, 1, 1) (Line: 48)
Drupal\Core\StackMiddleware\KernelPreHandle->handle(Object, 1, 1) (Line: 28)
Drupal\Core\StackMiddleware\ContentLength->handle(Object, 1, 1) (Line: 32)
Drupal\big_pipe\StackMiddleware\ContentLength->handle(Object, 1, 1) (Line: 191)
Drupal\page_cache\StackMiddleware\PageCache->fetch(Object, 1, 1) (Line: 128)
Drupal\page_cache\StackMiddleware\PageCache->lookup(Object, 1, 1) (Line: 82)
Drupal\page_cache\StackMiddleware\PageCache->handle(Object, 1, 1) (Line: 48)
Drupal\Core\StackMiddleware\ReverseProxyMiddleware->handle(Object, 1, 1) (Line: 51)
Drupal\Core\StackMiddleware\NegotiationMiddleware->handle(Object, 1, 1) (Line: 36)
Drupal\Core\StackMiddleware\AjaxPageState->handle(Object, 1, 1) (Line: 51)
Drupal\Core\StackMiddleware\StackedHttpKernel->handle(Object, 1, 1) (Line: 704)
Drupal\Core\DrupalKernel->handle(Object) (Line: 19)
Deprecated function: str_replace(): Passing null to parameter #3 ($subject) of type array|string is deprecated in Drupal\responsive_bg_image_formatter\Plugin\Field\FieldFormatter\ResponsiveBgImageFormatter->viewElements() (line 126 of modules/custom/responsive_bg_image_formatter/src/Plugin/Field/FieldFormatter/ResponsiveBgImageFormatter.php).
Drupal\responsive_bg_image_formatter\Plugin\Field\FieldFormatter\ResponsiveBgImageFormatter->viewElements(Object, 'en') (Line: 91) Drupal\Core\Field\FormatterBase->view(Object, 'en') (Line: 76) Drupal\Core\Field\Plugin\Field\FieldFormatter\EntityReferenceFormatterBase->view(Object, NULL) (Line: 268) Drupal\Core\Entity\Entity\EntityViewDisplay->buildMultiple(Array) (Line: 339) Drupal\Core\Entity\EntityViewBuilder->buildComponents(Array, Array, Array, 'full') (Line: 24) Drupal\node\NodeViewBuilder->buildComponents(Array, Array, Array, 'full') (Line: 281) Drupal\Core\Entity\EntityViewBuilder->buildMultiple(Array) (Line: 238) Drupal\Core\Entity\EntityViewBuilder->build(Array) call_user_func_array(Array, Array) (Line: 111) Drupal\Core\Render\Renderer->doTrustedCallback(Array, Array, 'Render #pre_render callbacks must be methods of a class that implements \Drupal\Core\Security\TrustedCallbackInterface or be an anonymous function. The callback was %s. See https://www.drupal.org/node/2966725', 'exception', 'Drupal\Core\Render\Element\RenderCallbackInterface') (Line: 859) Drupal\Core\Render\Renderer->doCallback('#pre_render', Array, Array) (Line: 421) Drupal\Core\Render\Renderer->doRender(Array, ) (Line: 240) Drupal\Core\Render\Renderer->render(Array, ) (Line: 238) Drupal\Core\Render\MainContent\HtmlRenderer->Drupal\Core\Render\MainContent\{closure}() (Line: 627) Drupal\Core\Render\Renderer->executeInRenderContext(Object, Object) (Line: 239) Drupal\Core\Render\MainContent\HtmlRenderer->prepare(Array, Object, Object) (Line: 128) Drupal\Core\Render\MainContent\HtmlRenderer->renderResponse(Array, Object, Object) (Line: 90) Drupal\Core\EventSubscriber\MainContentViewSubscriber->onViewRenderArray(Object, 'kernel.view', Object) call_user_func(Array, Object, 'kernel.view', Object) (Line: 111) Drupal\Component\EventDispatcher\ContainerAwareEventDispatcher->dispatch(Object, 'kernel.view') (Line: 186) Symfony\Component\HttpKernel\HttpKernel->handleRaw(Object, 1) (Line: 76) Symfony\Component\HttpKernel\HttpKernel->handle(Object, 1, 1) (Line: 58) Drupal\Core\StackMiddleware\Session->handle(Object, 1, 1) (Line: 48) Drupal\Core\StackMiddleware\KernelPreHandle->handle(Object, 1, 1) (Line: 28) Drupal\Core\StackMiddleware\ContentLength->handle(Object, 1, 1) (Line: 32) Drupal\big_pipe\StackMiddleware\ContentLength->handle(Object, 1, 1) (Line: 191) Drupal\page_cache\StackMiddleware\PageCache->fetch(Object, 1, 1) (Line: 128) Drupal\page_cache\StackMiddleware\PageCache->lookup(Object, 1, 1) (Line: 82) Drupal\page_cache\StackMiddleware\PageCache->handle(Object, 1, 1) (Line: 48) Drupal\Core\StackMiddleware\ReverseProxyMiddleware->handle(Object, 1, 1) (Line: 51) Drupal\Core\StackMiddleware\NegotiationMiddleware->handle(Object, 1, 1) (Line: 36) Drupal\Core\StackMiddleware\AjaxPageState->handle(Object, 1, 1) (Line: 51) Drupal\Core\StackMiddleware\StackedHttpKernel->handle(Object, 1, 1) (Line: 704) Drupal\Core\DrupalKernel->handle(Object) (Line: 19)Warning: Undefined variable $index in Drupal\responsive_bg_image_formatter\Plugin\Field\FieldFormatter\ResponsiveBgImageFormatter->viewElements() (line 153 of modules/custom/responsive_bg_image_formatter/src/Plugin/Field/FieldFormatter/ResponsiveBgImageFormatter.php).
Drupal\responsive_bg_image_formatter\Plugin\Field\FieldFormatter\ResponsiveBgImageFormatter->viewElements(Object, 'en') (Line: 91)
Drupal\Core\Field\FormatterBase->view(Object, 'en') (Line: 76)
Drupal\Core\Field\Plugin\Field\FieldFormatter\EntityReferenceFormatterBase->view(Object, NULL) (Line: 268)
Drupal\Core\Entity\Entity\EntityViewDisplay->buildMultiple(Array) (Line: 339)
Drupal\Core\Entity\EntityViewBuilder->buildComponents(Array, Array, Array, 'full') (Line: 24)
Drupal\node\NodeViewBuilder->buildComponents(Array, Array, Array, 'full') (Line: 281)
Drupal\Core\Entity\EntityViewBuilder->buildMultiple(Array) (Line: 238)
Drupal\Core\Entity\EntityViewBuilder->build(Array)
call_user_func_array(Array, Array) (Line: 111)
Drupal\Core\Render\Renderer->doTrustedCallback(Array, Array, 'Render #pre_render callbacks must be methods of a class that implements \Drupal\Core\Security\TrustedCallbackInterface or be an anonymous function. The callback was %s. See https://www.drupal.org/node/2966725', 'exception', 'Drupal\Core\Render\Element\RenderCallbackInterface') (Line: 859)
Drupal\Core\Render\Renderer->doCallback('#pre_render', Array, Array) (Line: 421)
Drupal\Core\Render\Renderer->doRender(Array, ) (Line: 240)
Drupal\Core\Render\Renderer->render(Array, ) (Line: 238)
Drupal\Core\Render\MainContent\HtmlRenderer->Drupal\Core\Render\MainContent\{closure}() (Line: 627)
Drupal\Core\Render\Renderer->executeInRenderContext(Object, Object) (Line: 239)
Drupal\Core\Render\MainContent\HtmlRenderer->prepare(Array, Object, Object) (Line: 128)
Drupal\Core\Render\MainContent\HtmlRenderer->renderResponse(Array, Object, Object) (Line: 90)
Drupal\Core\EventSubscriber\MainContentViewSubscriber->onViewRenderArray(Object, 'kernel.view', Object)
call_user_func(Array, Object, 'kernel.view', Object) (Line: 111)
Drupal\Component\EventDispatcher\ContainerAwareEventDispatcher->dispatch(Object, 'kernel.view') (Line: 186)
Symfony\Component\HttpKernel\HttpKernel->handleRaw(Object, 1) (Line: 76)
Symfony\Component\HttpKernel\HttpKernel->handle(Object, 1, 1) (Line: 58)
Drupal\Core\StackMiddleware\Session->handle(Object, 1, 1) (Line: 48)
Drupal\Core\StackMiddleware\KernelPreHandle->handle(Object, 1, 1) (Line: 28)
Drupal\Core\StackMiddleware\ContentLength->handle(Object, 1, 1) (Line: 32)
Drupal\big_pipe\StackMiddleware\ContentLength->handle(Object, 1, 1) (Line: 191)
Drupal\page_cache\StackMiddleware\PageCache->fetch(Object, 1, 1) (Line: 128)
Drupal\page_cache\StackMiddleware\PageCache->lookup(Object, 1, 1) (Line: 82)
Drupal\page_cache\StackMiddleware\PageCache->handle(Object, 1, 1) (Line: 48)
Drupal\Core\StackMiddleware\ReverseProxyMiddleware->handle(Object, 1, 1) (Line: 51)
Drupal\Core\StackMiddleware\NegotiationMiddleware->handle(Object, 1, 1) (Line: 36)
Drupal\Core\StackMiddleware\AjaxPageState->handle(Object, 1, 1) (Line: 51)
Drupal\Core\StackMiddleware\StackedHttpKernel->handle(Object, 1, 1) (Line: 704)
Drupal\Core\DrupalKernel->handle(Object) (Line: 19)
Drought Worsens for Southern Texas with Dry Conditions Forecasted to Persist Through Spring.
Key Points
- Extreme (D3) and Exceptional (D4) drought conditions are in place for western Texas, southern Texas, and most of New Mexico.
- Moderate (D1) to Severe (D2) drought conditions have developed through central Texas and southern Oklahoma.
- Precipitation, temperature, and drought condition forecasts all suggest an expansion and intensification of drought conditions is likely over the next three months.
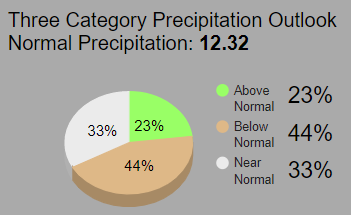
- May and June are typically the wettest months of the year in the Southern Plains, and rainfall in these months are critical for productive agriculture. The latest seasonal outlook for April–June favors above-normal temperatures and slightly favors below-normal precipitation for the season, with near-average rainfall being the next most likely outcome. If this forecast verifies, agriculture in the region will be impacted by warm and dry conditions.
The U.S. Drought Monitor (USDM) is updated each Thursday to show the location and intensity of drought across the country. Drought categories show experts’ assessments of conditions related to dryness and drought including observations of how much water is available in streams, lakes, and soils compared to usual for the same time of year.
Extreme (D3) to Exceptional (D4) drought persists across western parts of Texas (20% of the state), and most of New Mexico (80% of the state).
U.S. Drought Monitor Categories
The U.S. Drought Monitor (USDM) is updated each Thursday to show the location and intensity of drought across the country. Drought categories show experts’ assessments of conditions related to dryness and drought including observations of how much water is available in streams, lakes, and soils compared to usual for the same time of year.
Extreme (D3) to Exceptional (D4) drought persists across western parts of Texas (20% of the state), and most of New Mexico (80% of the state).
Recent and Current Conditions
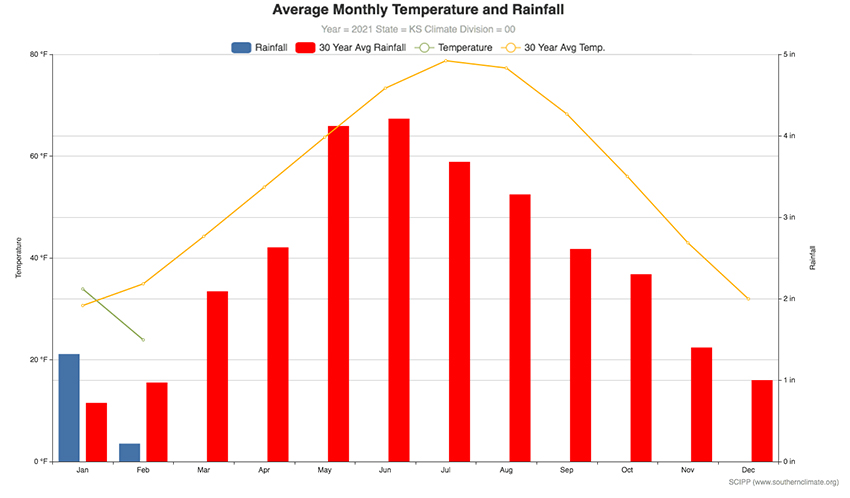
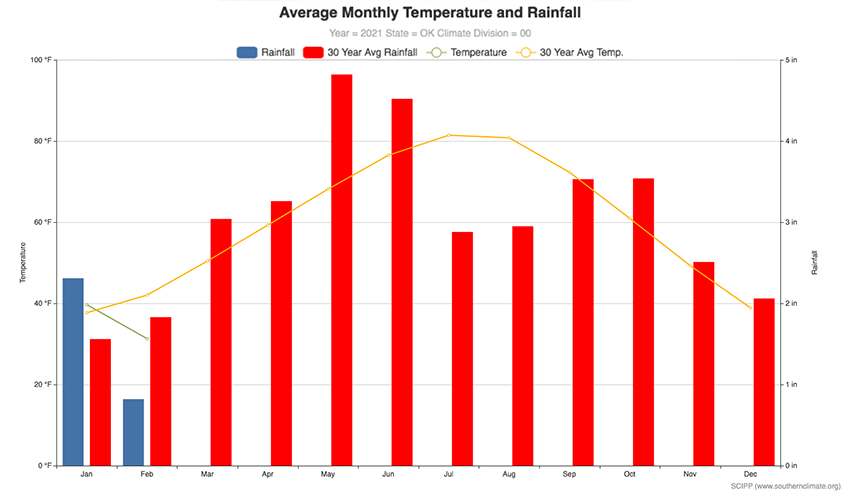
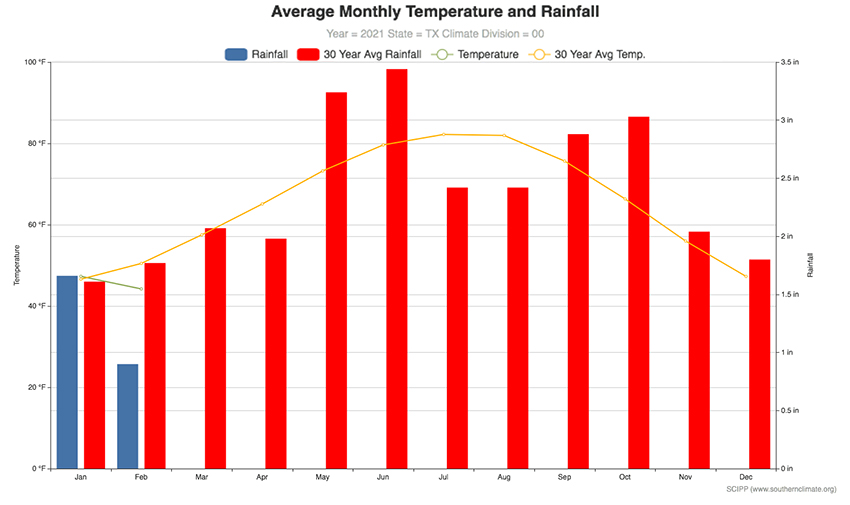
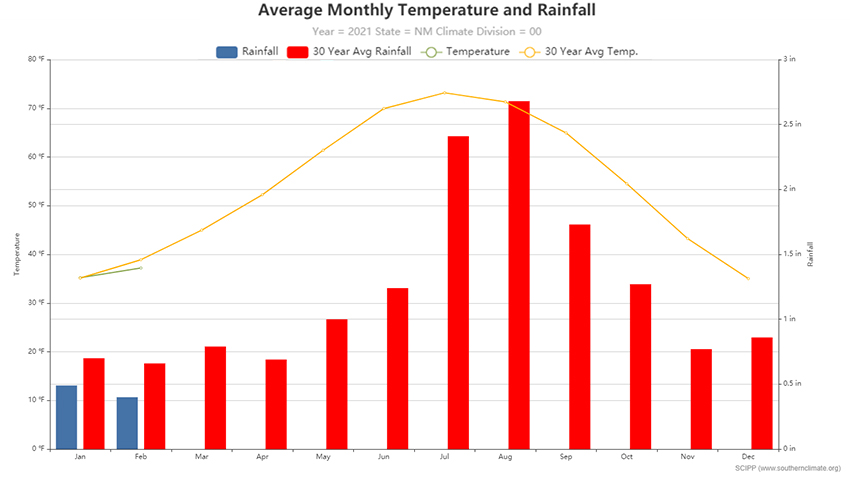
2021 So Far
- Across the region, January precipitation was near normal while February precipitation was nearly half of the long-term average for Kansas, Oklahoma, Texas, and New Mexico.
- Kansas, Oklahoma, and Texas are approaching what are typically the wettest months of the year and a critical point in the growing season.
Kansas Average Monthly Temperature and Rainfall
Oklahoma Average Monthly Temperature and Rainfall
Texas Average Monthly Temperature and Rainfall
New Mexico Average Monthly Temperature and Rainfall
U.S. Drought Monitor Conditions
- Extreme (D3) to Exceptional (D4) drought persists across western parts of Texas (20% of the state), and most of New Mexico (80% of the state).
- Exceptional (D4) drought conditions have been in place in west Texas since August 2020.
- Moderate (D1) to Severe (D2) drought developed across parts of southern, central, and eastern Texas in February and intensified in early March.
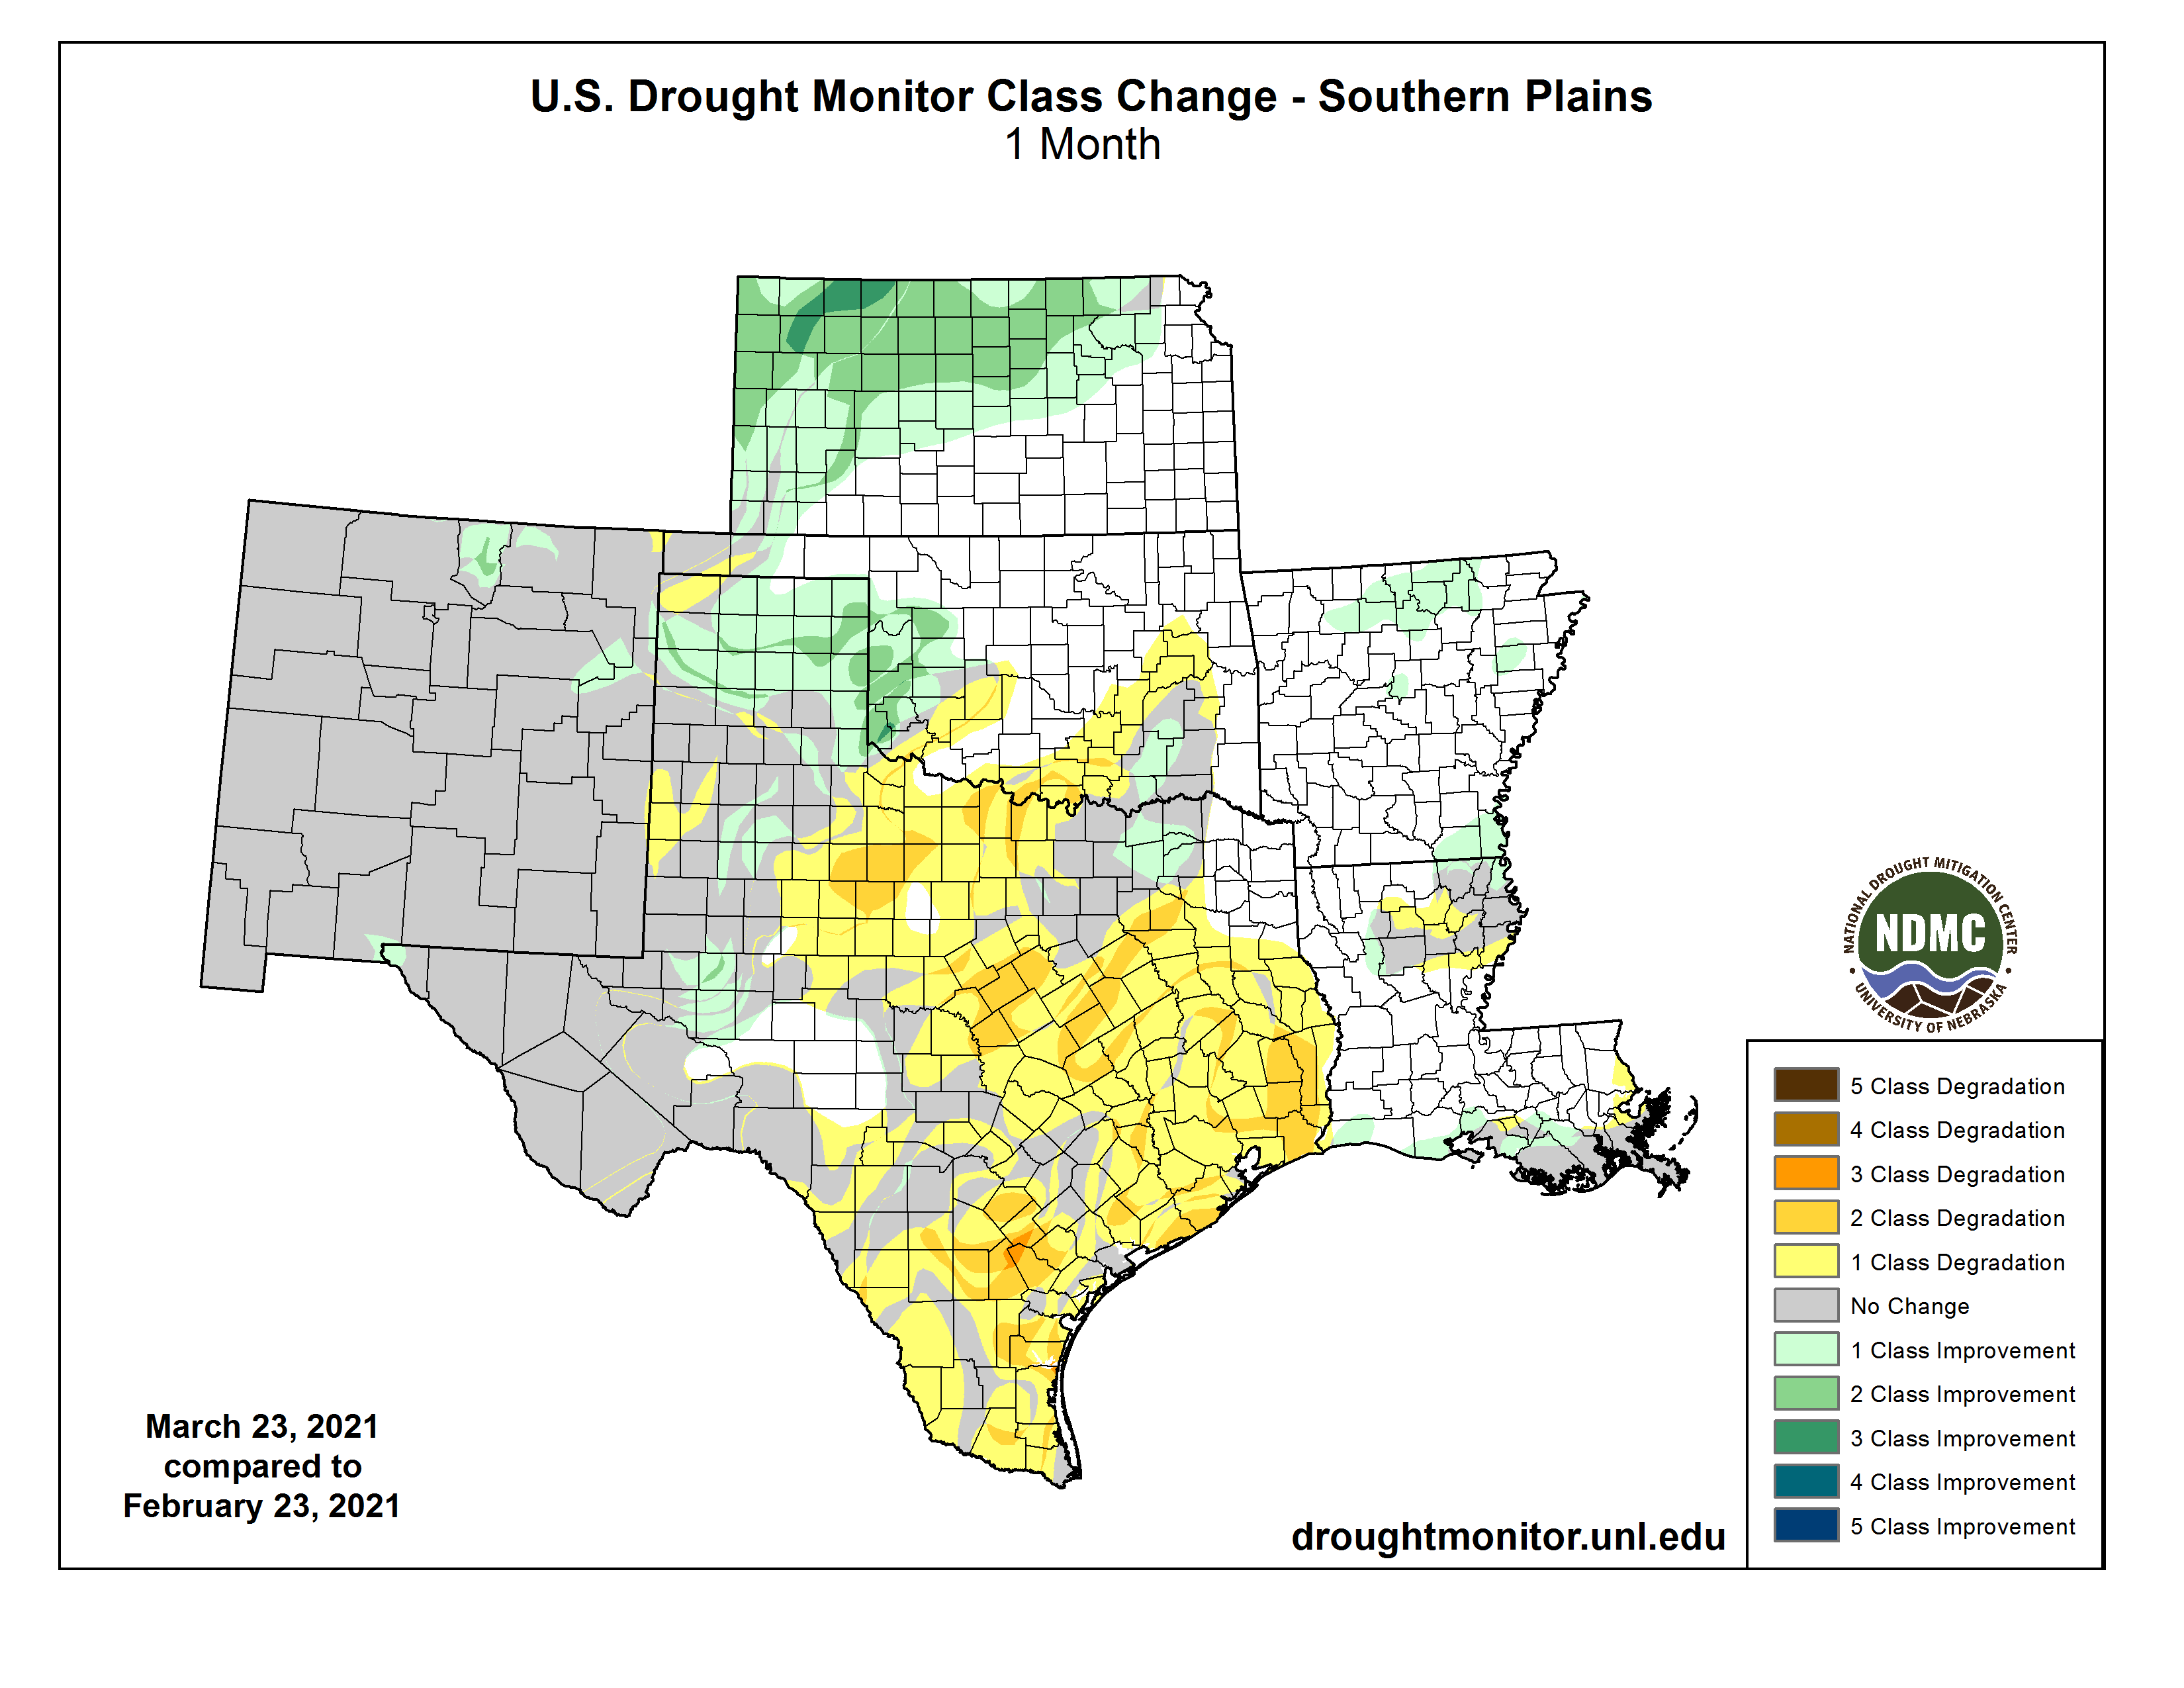
U.S. Drought Monitor Change Map: Southern Plains
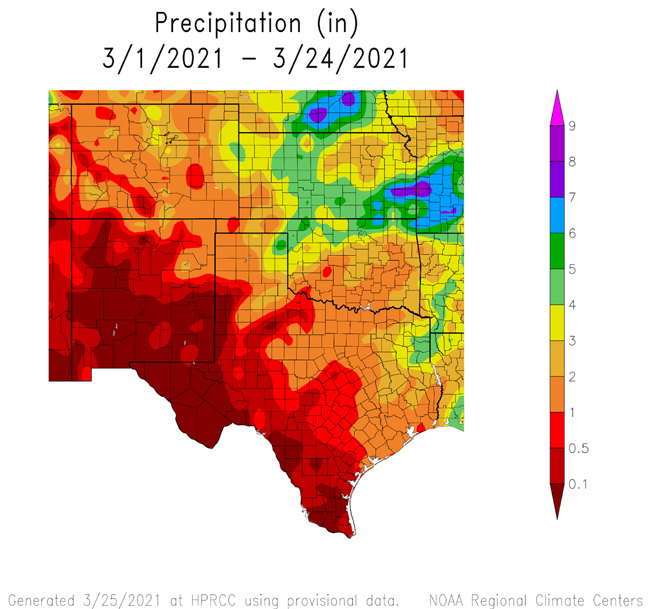
March Precipitation
- A major rain storm crossed western Kansas and Oklahoma on March 14–19.
- 2+ inches of rainfall for most of Kansas and northern Oklahoma.
- 4+ inches rainfall for southeast Kansas.
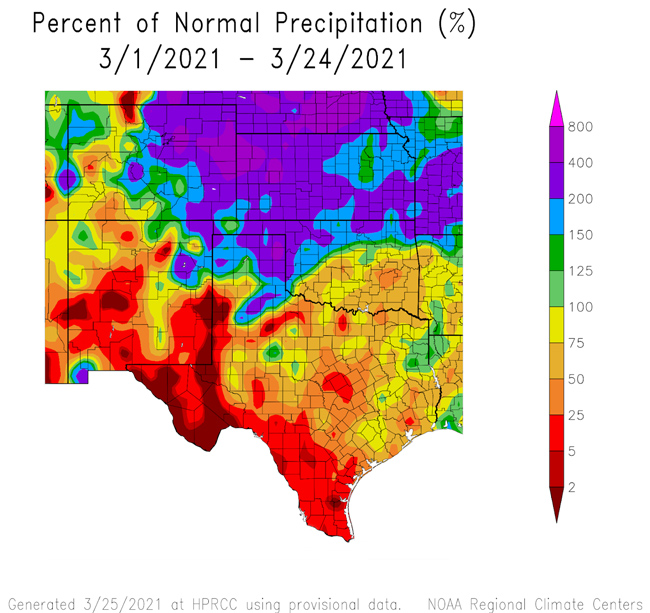
- March-to-date has not had any measurable precipitation over far western Texas and less than 0.1 inches along most of the southern border.
30-Day Precipitation Conditions for the Southern Plains
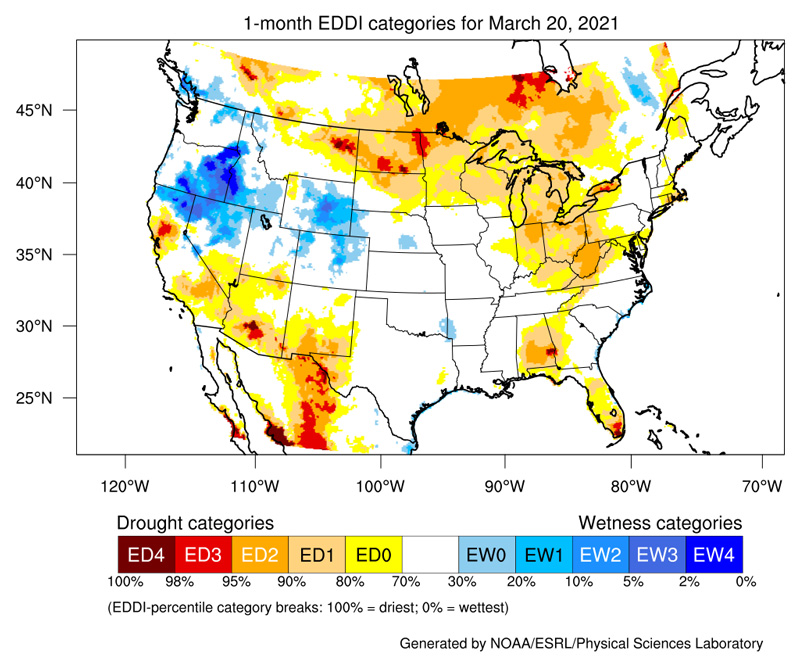
Evaporative Drought Demand Index (EDDI)
4-Week EDDI for March 20, 2021
- EDDI values have been near normal across the Southern Plains over the past month.
- Far western Texas has experienced high evaporation demand for this time of year.
Seasonal Outlooks: April–June 2021
Temperature Outlook
For April–June, there is a greater chance for above-normal temperatures across the Southern Plains.
Precipitation Outlook
The Climate Prediction Center's precipitation outlook shows that below-average rainfall is the most likely outcome for April–June across the Southern Plains.
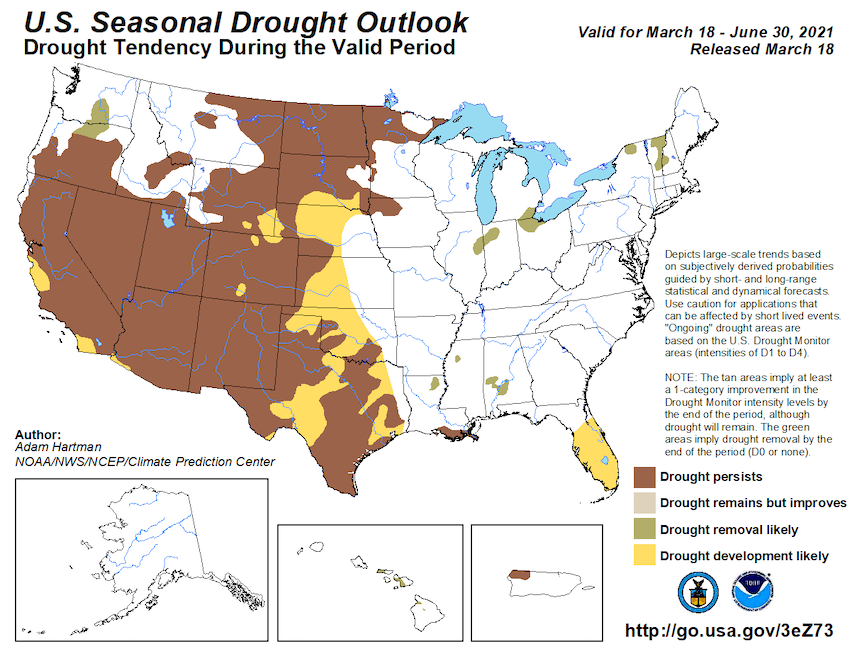
Drought Outlook
- Should the seasonal precipitation and temperature outlooks verify with below-normal precipitation and above-normal temperatures occurring during a typically wetter and critical juncture in the growing season, there could be significant impacts to agriculture in the region.
- With encroaching drought conditions and the precipitation outlook favoring below-normal rainfall for the season, drought conditions are forecast to continue at least through June for western and central Texas, and drought development across the rest of the Southern Plains is likely.
Climate Patterns
- NOAA’s El Niño–Southern Oscillation (ENSO) alert system status is currently a La Niña advisory with moderate, but waning, La Niña conditions over the equatorial Pacific.
- There is a ~60% chance of a transition from La Niña to ENSO-Neutral during the Northern Hemisphere spring 2021 (April–June).
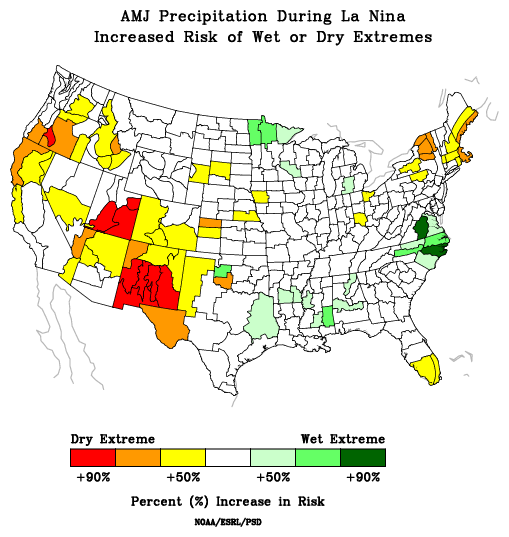
- Historically, much of the southwest U.S., including western Texas, has experienced continued dryness into spring during La Niña conditions, while the rest of the region does not experience a strong influence from the weakening La Niña conditions.
April–June Precipitation During La Niña: Increased Risk of Wet or Dry Extremes
- For more information, please check out the NOAA ENSO blog.
- ENSO forecasts from the International Research Institute (IRI) for Climate and Society show ENSO-neutral conditions returning within the coming months. Earlier forecasts showed an increased likelihood of La Niña returning in autumn 2021, but more recent forecasts have lowered this likelihood, although it cannot be ruled out yet.
State-Based Conditions and Impacts
Texas
- Drought (D3 and D4) has generally persisted across western Texas and has developed or worsened across portions of southern, central, and eastern Texas so far in 2021.
- February state-wide average precipitation was nearly half of the long-term average for the month.
- So far in March, the southern border has experienced less than 25% of normal March monthly precipitation. Drought conditions in southern Texas and western Texas are worsening.
- April–June are usually the wetter months of the year, for Texas, and rainfall over these months is critical for water availability throughout the rest of the year. The latest precipitation outlook for April–June shows a 40%–50% chance of below-normal precipitation for these months (leaving a 50%–60% chance of near-normal or above-normal conditions).
Oklahoma
- February state-wide average precipitation was nearly half of the long-term average for the month.
- Significant moisture brought much needed relief across hard hit drought areas of western Oklahoma and the far western Panhandle during March.
- Much of the southeastern quarter of Oklahoma was 6–10 inches below normal since the start of the 2020–21 Water Year (October 1, 2020–September 30, 2021).
Kansas
- There has been significant improvement state-wide, with the elimination of Extreme (D3) drought.
- The state has seen reduced fire danger and behavior after significant fires in early March.
- Soil moisture is favorable, with improvement in wheat conditions.
- Cool/wet soils are hampering field activities and may possibly delay spring planting.
New Mexico
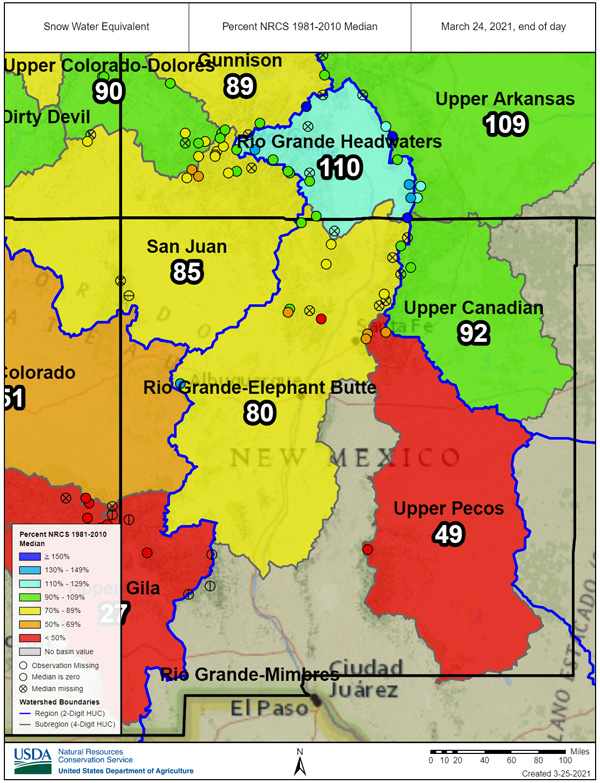
- Snowpack across the state is still low to very low.
- SWE in the Upper Gila is 27% of normal for this time of the season, Upper Pecos is at 49%, and Rio Grande-Elephant Butte is at 80% of normal.
- The Rio Grande headwaters is the only region that has above-normal SWE at 110% of normal.
- Precipitation for March-to-date has been below average, overall, for the state. Northern and northeastern New Mexico has had a wetter month than the rest of the state.
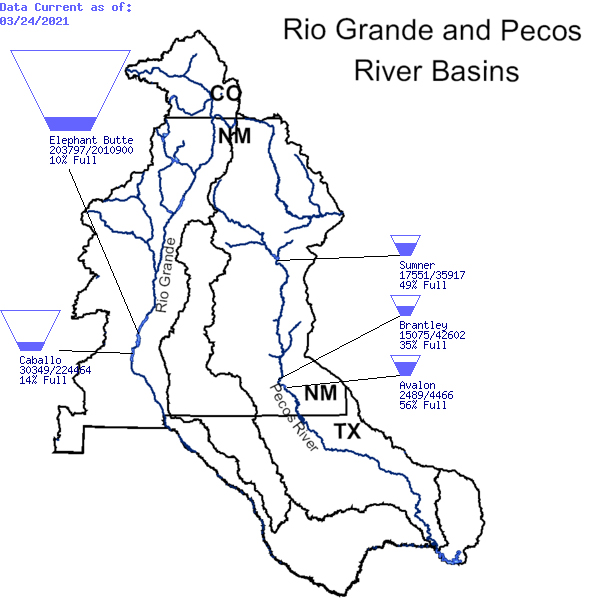
- Long-term drought shows up clearly in surface water levels in the Rio Grande and Pecos basins. For example, Elephant Butte storage is 10% of capacity.
Rio Grande and Pecos River Basin Reservoir Storage
Snow Water Equivalent Percent of Median: New Mexico Basins
For More Information
More local information is available from the following resources:
Prepared By
Joel Lisonbee
NOAA/National Integrated Drought Information System (NIDIS)
Mary Knapp
Weather Data Library and Kansas Assistant State Climatologist
Dept. of Agronomy, Kansas State University
Gary McManus
State Climatologist, Oklahoma Mesonet, Oklahoma Climatological Survey
Kyle Brehe
Southern Regional Climate Center/Louisiana Office of State Climatology, Louisiana State University
This drought early warning update is issued in partnership between the National Oceanic and Atmospheric Administration (NOAA) and the offices of the state climatologist for Texas, Oklahoma, and Kansas. The purpose of the update is to communicate a potential area of concern for drought expansion and/or development within the Southern Plains based on recent conditions and the upcoming forecast. NIDIS and its partners will issue future drought updates as conditions evolve.
