Warning: Undefined variable $index in Drupal\responsive_bg_image_formatter\Plugin\Field\FieldFormatter\ResponsiveBgImageFormatter->viewElements() (line 95 of modules/custom/responsive_bg_image_formatter/src/Plugin/Field/FieldFormatter/ResponsiveBgImageFormatter.php).
Drupal\responsive_bg_image_formatter\Plugin\Field\FieldFormatter\ResponsiveBgImageFormatter->viewElements(Object, 'en') (Line: 91) Drupal\Core\Field\FormatterBase->view(Object, 'en') (Line: 76) Drupal\Core\Field\Plugin\Field\FieldFormatter\EntityReferenceFormatterBase->view(Object, NULL) (Line: 268) Drupal\Core\Entity\Entity\EntityViewDisplay->buildMultiple(Array) (Line: 339) Drupal\Core\Entity\EntityViewBuilder->buildComponents(Array, Array, Array, 'full') (Line: 24) Drupal\node\NodeViewBuilder->buildComponents(Array, Array, Array, 'full') (Line: 281) Drupal\Core\Entity\EntityViewBuilder->buildMultiple(Array) (Line: 238) Drupal\Core\Entity\EntityViewBuilder->build(Array) call_user_func_array(Array, Array) (Line: 111) Drupal\Core\Render\Renderer->doTrustedCallback(Array, Array, 'Render #pre_render callbacks must be methods of a class that implements \Drupal\Core\Security\TrustedCallbackInterface or be an anonymous function. The callback was %s. See https://www.drupal.org/node/2966725', 'exception', 'Drupal\Core\Render\Element\RenderCallbackInterface') (Line: 859) Drupal\Core\Render\Renderer->doCallback('#pre_render', Array, Array) (Line: 421) Drupal\Core\Render\Renderer->doRender(Array, ) (Line: 240) Drupal\Core\Render\Renderer->render(Array, ) (Line: 238) Drupal\Core\Render\MainContent\HtmlRenderer->Drupal\Core\Render\MainContent\{closure}() (Line: 627) Drupal\Core\Render\Renderer->executeInRenderContext(Object, Object) (Line: 239) Drupal\Core\Render\MainContent\HtmlRenderer->prepare(Array, Object, Object) (Line: 128) Drupal\Core\Render\MainContent\HtmlRenderer->renderResponse(Array, Object, Object) (Line: 90) Drupal\Core\EventSubscriber\MainContentViewSubscriber->onViewRenderArray(Object, 'kernel.view', Object) call_user_func(Array, Object, 'kernel.view', Object) (Line: 111) Drupal\Component\EventDispatcher\ContainerAwareEventDispatcher->dispatch(Object, 'kernel.view') (Line: 186) Symfony\Component\HttpKernel\HttpKernel->handleRaw(Object, 1) (Line: 76) Symfony\Component\HttpKernel\HttpKernel->handle(Object, 1, 1) (Line: 58) Drupal\Core\StackMiddleware\Session->handle(Object, 1, 1) (Line: 48) Drupal\Core\StackMiddleware\KernelPreHandle->handle(Object, 1, 1) (Line: 28) Drupal\Core\StackMiddleware\ContentLength->handle(Object, 1, 1) (Line: 32) Drupal\big_pipe\StackMiddleware\ContentLength->handle(Object, 1, 1) (Line: 191) Drupal\page_cache\StackMiddleware\PageCache->fetch(Object, 1, 1) (Line: 128) Drupal\page_cache\StackMiddleware\PageCache->lookup(Object, 1, 1) (Line: 82) Drupal\page_cache\StackMiddleware\PageCache->handle(Object, 1, 1) (Line: 48) Drupal\Core\StackMiddleware\ReverseProxyMiddleware->handle(Object, 1, 1) (Line: 51) Drupal\Core\StackMiddleware\NegotiationMiddleware->handle(Object, 1, 1) (Line: 36) Drupal\Core\StackMiddleware\AjaxPageState->handle(Object, 1, 1) (Line: 51) Drupal\Core\StackMiddleware\StackedHttpKernel->handle(Object, 1, 1) (Line: 704) Drupal\Core\DrupalKernel->handle(Object) (Line: 19)Warning: Undefined array key "width" in template_preprocess_responsive_image() (line 209 of core/modules/responsive_image/responsive_image.module).
template_preprocess_responsive_image(Array) (Line: 101) Drupal\responsive_bg_image_formatter\Plugin\Field\FieldFormatter\ResponsiveBgImageFormatter->viewElements(Object, 'en') (Line: 91) Drupal\Core\Field\FormatterBase->view(Object, 'en') (Line: 76) Drupal\Core\Field\Plugin\Field\FieldFormatter\EntityReferenceFormatterBase->view(Object, NULL) (Line: 268) Drupal\Core\Entity\Entity\EntityViewDisplay->buildMultiple(Array) (Line: 339) Drupal\Core\Entity\EntityViewBuilder->buildComponents(Array, Array, Array, 'full') (Line: 24) Drupal\node\NodeViewBuilder->buildComponents(Array, Array, Array, 'full') (Line: 281) Drupal\Core\Entity\EntityViewBuilder->buildMultiple(Array) (Line: 238) Drupal\Core\Entity\EntityViewBuilder->build(Array) call_user_func_array(Array, Array) (Line: 111) Drupal\Core\Render\Renderer->doTrustedCallback(Array, Array, 'Render #pre_render callbacks must be methods of a class that implements \Drupal\Core\Security\TrustedCallbackInterface or be an anonymous function. The callback was %s. See https://www.drupal.org/node/2966725', 'exception', 'Drupal\Core\Render\Element\RenderCallbackInterface') (Line: 859) Drupal\Core\Render\Renderer->doCallback('#pre_render', Array, Array) (Line: 421) Drupal\Core\Render\Renderer->doRender(Array, ) (Line: 240) Drupal\Core\Render\Renderer->render(Array, ) (Line: 238) Drupal\Core\Render\MainContent\HtmlRenderer->Drupal\Core\Render\MainContent\{closure}() (Line: 627) Drupal\Core\Render\Renderer->executeInRenderContext(Object, Object) (Line: 239) Drupal\Core\Render\MainContent\HtmlRenderer->prepare(Array, Object, Object) (Line: 128) Drupal\Core\Render\MainContent\HtmlRenderer->renderResponse(Array, Object, Object) (Line: 90) Drupal\Core\EventSubscriber\MainContentViewSubscriber->onViewRenderArray(Object, 'kernel.view', Object) call_user_func(Array, Object, 'kernel.view', Object) (Line: 111) Drupal\Component\EventDispatcher\ContainerAwareEventDispatcher->dispatch(Object, 'kernel.view') (Line: 186) Symfony\Component\HttpKernel\HttpKernel->handleRaw(Object, 1) (Line: 76) Symfony\Component\HttpKernel\HttpKernel->handle(Object, 1, 1) (Line: 58) Drupal\Core\StackMiddleware\Session->handle(Object, 1, 1) (Line: 48) Drupal\Core\StackMiddleware\KernelPreHandle->handle(Object, 1, 1) (Line: 28) Drupal\Core\StackMiddleware\ContentLength->handle(Object, 1, 1) (Line: 32) Drupal\big_pipe\StackMiddleware\ContentLength->handle(Object, 1, 1) (Line: 191) Drupal\page_cache\StackMiddleware\PageCache->fetch(Object, 1, 1) (Line: 128) Drupal\page_cache\StackMiddleware\PageCache->lookup(Object, 1, 1) (Line: 82) Drupal\page_cache\StackMiddleware\PageCache->handle(Object, 1, 1) (Line: 48) Drupal\Core\StackMiddleware\ReverseProxyMiddleware->handle(Object, 1, 1) (Line: 51) Drupal\Core\StackMiddleware\NegotiationMiddleware->handle(Object, 1, 1) (Line: 36) Drupal\Core\StackMiddleware\AjaxPageState->handle(Object, 1, 1) (Line: 51) Drupal\Core\StackMiddleware\StackedHttpKernel->handle(Object, 1, 1) (Line: 704) Drupal\Core\DrupalKernel->handle(Object) (Line: 19)Warning: Undefined array key "height" in template_preprocess_responsive_image() (line 210 of core/modules/responsive_image/responsive_image.module).
template_preprocess_responsive_image(Array) (Line: 101) Drupal\responsive_bg_image_formatter\Plugin\Field\FieldFormatter\ResponsiveBgImageFormatter->viewElements(Object, 'en') (Line: 91) Drupal\Core\Field\FormatterBase->view(Object, 'en') (Line: 76) Drupal\Core\Field\Plugin\Field\FieldFormatter\EntityReferenceFormatterBase->view(Object, NULL) (Line: 268) Drupal\Core\Entity\Entity\EntityViewDisplay->buildMultiple(Array) (Line: 339) Drupal\Core\Entity\EntityViewBuilder->buildComponents(Array, Array, Array, 'full') (Line: 24) Drupal\node\NodeViewBuilder->buildComponents(Array, Array, Array, 'full') (Line: 281) Drupal\Core\Entity\EntityViewBuilder->buildMultiple(Array) (Line: 238) Drupal\Core\Entity\EntityViewBuilder->build(Array) call_user_func_array(Array, Array) (Line: 111) Drupal\Core\Render\Renderer->doTrustedCallback(Array, Array, 'Render #pre_render callbacks must be methods of a class that implements \Drupal\Core\Security\TrustedCallbackInterface or be an anonymous function. The callback was %s. See https://www.drupal.org/node/2966725', 'exception', 'Drupal\Core\Render\Element\RenderCallbackInterface') (Line: 859) Drupal\Core\Render\Renderer->doCallback('#pre_render', Array, Array) (Line: 421) Drupal\Core\Render\Renderer->doRender(Array, ) (Line: 240) Drupal\Core\Render\Renderer->render(Array, ) (Line: 238) Drupal\Core\Render\MainContent\HtmlRenderer->Drupal\Core\Render\MainContent\{closure}() (Line: 627) Drupal\Core\Render\Renderer->executeInRenderContext(Object, Object) (Line: 239) Drupal\Core\Render\MainContent\HtmlRenderer->prepare(Array, Object, Object) (Line: 128) Drupal\Core\Render\MainContent\HtmlRenderer->renderResponse(Array, Object, Object) (Line: 90) Drupal\Core\EventSubscriber\MainContentViewSubscriber->onViewRenderArray(Object, 'kernel.view', Object) call_user_func(Array, Object, 'kernel.view', Object) (Line: 111) Drupal\Component\EventDispatcher\ContainerAwareEventDispatcher->dispatch(Object, 'kernel.view') (Line: 186) Symfony\Component\HttpKernel\HttpKernel->handleRaw(Object, 1) (Line: 76) Symfony\Component\HttpKernel\HttpKernel->handle(Object, 1, 1) (Line: 58) Drupal\Core\StackMiddleware\Session->handle(Object, 1, 1) (Line: 48) Drupal\Core\StackMiddleware\KernelPreHandle->handle(Object, 1, 1) (Line: 28) Drupal\Core\StackMiddleware\ContentLength->handle(Object, 1, 1) (Line: 32) Drupal\big_pipe\StackMiddleware\ContentLength->handle(Object, 1, 1) (Line: 191) Drupal\page_cache\StackMiddleware\PageCache->fetch(Object, 1, 1) (Line: 128) Drupal\page_cache\StackMiddleware\PageCache->lookup(Object, 1, 1) (Line: 82) Drupal\page_cache\StackMiddleware\PageCache->handle(Object, 1, 1) (Line: 48) Drupal\Core\StackMiddleware\ReverseProxyMiddleware->handle(Object, 1, 1) (Line: 51) Drupal\Core\StackMiddleware\NegotiationMiddleware->handle(Object, 1, 1) (Line: 36) Drupal\Core\StackMiddleware\AjaxPageState->handle(Object, 1, 1) (Line: 51) Drupal\Core\StackMiddleware\StackedHttpKernel->handle(Object, 1, 1) (Line: 704) Drupal\Core\DrupalKernel->handle(Object) (Line: 19)Warning: Undefined array key "media" in Drupal\responsive_bg_image_formatter\Plugin\Field\FieldFormatter\ResponsiveBgImageFormatter->viewElements() (line 112 of modules/custom/responsive_bg_image_formatter/src/Plugin/Field/FieldFormatter/ResponsiveBgImageFormatter.php).
Drupal\responsive_bg_image_formatter\Plugin\Field\FieldFormatter\ResponsiveBgImageFormatter->viewElements(Object, 'en') (Line: 91)
Drupal\Core\Field\FormatterBase->view(Object, 'en') (Line: 76)
Drupal\Core\Field\Plugin\Field\FieldFormatter\EntityReferenceFormatterBase->view(Object, NULL) (Line: 268)
Drupal\Core\Entity\Entity\EntityViewDisplay->buildMultiple(Array) (Line: 339)
Drupal\Core\Entity\EntityViewBuilder->buildComponents(Array, Array, Array, 'full') (Line: 24)
Drupal\node\NodeViewBuilder->buildComponents(Array, Array, Array, 'full') (Line: 281)
Drupal\Core\Entity\EntityViewBuilder->buildMultiple(Array) (Line: 238)
Drupal\Core\Entity\EntityViewBuilder->build(Array)
call_user_func_array(Array, Array) (Line: 111)
Drupal\Core\Render\Renderer->doTrustedCallback(Array, Array, 'Render #pre_render callbacks must be methods of a class that implements \Drupal\Core\Security\TrustedCallbackInterface or be an anonymous function. The callback was %s. See https://www.drupal.org/node/2966725', 'exception', 'Drupal\Core\Render\Element\RenderCallbackInterface') (Line: 859)
Drupal\Core\Render\Renderer->doCallback('#pre_render', Array, Array) (Line: 421)
Drupal\Core\Render\Renderer->doRender(Array, ) (Line: 240)
Drupal\Core\Render\Renderer->render(Array, ) (Line: 238)
Drupal\Core\Render\MainContent\HtmlRenderer->Drupal\Core\Render\MainContent\{closure}() (Line: 627)
Drupal\Core\Render\Renderer->executeInRenderContext(Object, Object) (Line: 239)
Drupal\Core\Render\MainContent\HtmlRenderer->prepare(Array, Object, Object) (Line: 128)
Drupal\Core\Render\MainContent\HtmlRenderer->renderResponse(Array, Object, Object) (Line: 90)
Drupal\Core\EventSubscriber\MainContentViewSubscriber->onViewRenderArray(Object, 'kernel.view', Object)
call_user_func(Array, Object, 'kernel.view', Object) (Line: 111)
Drupal\Component\EventDispatcher\ContainerAwareEventDispatcher->dispatch(Object, 'kernel.view') (Line: 186)
Symfony\Component\HttpKernel\HttpKernel->handleRaw(Object, 1) (Line: 76)
Symfony\Component\HttpKernel\HttpKernel->handle(Object, 1, 1) (Line: 58)
Drupal\Core\StackMiddleware\Session->handle(Object, 1, 1) (Line: 48)
Drupal\Core\StackMiddleware\KernelPreHandle->handle(Object, 1, 1) (Line: 28)
Drupal\Core\StackMiddleware\ContentLength->handle(Object, 1, 1) (Line: 32)
Drupal\big_pipe\StackMiddleware\ContentLength->handle(Object, 1, 1) (Line: 191)
Drupal\page_cache\StackMiddleware\PageCache->fetch(Object, 1, 1) (Line: 128)
Drupal\page_cache\StackMiddleware\PageCache->lookup(Object, 1, 1) (Line: 82)
Drupal\page_cache\StackMiddleware\PageCache->handle(Object, 1, 1) (Line: 48)
Drupal\Core\StackMiddleware\ReverseProxyMiddleware->handle(Object, 1, 1) (Line: 51)
Drupal\Core\StackMiddleware\NegotiationMiddleware->handle(Object, 1, 1) (Line: 36)
Drupal\Core\StackMiddleware\AjaxPageState->handle(Object, 1, 1) (Line: 51)
Drupal\Core\StackMiddleware\StackedHttpKernel->handle(Object, 1, 1) (Line: 704)
Drupal\Core\DrupalKernel->handle(Object) (Line: 19)
Deprecated function: str_replace(): Passing null to parameter #3 ($subject) of type array|string is deprecated in Drupal\responsive_bg_image_formatter\Plugin\Field\FieldFormatter\ResponsiveBgImageFormatter->viewElements() (line 126 of modules/custom/responsive_bg_image_formatter/src/Plugin/Field/FieldFormatter/ResponsiveBgImageFormatter.php).
Drupal\responsive_bg_image_formatter\Plugin\Field\FieldFormatter\ResponsiveBgImageFormatter->viewElements(Object, 'en') (Line: 91) Drupal\Core\Field\FormatterBase->view(Object, 'en') (Line: 76) Drupal\Core\Field\Plugin\Field\FieldFormatter\EntityReferenceFormatterBase->view(Object, NULL) (Line: 268) Drupal\Core\Entity\Entity\EntityViewDisplay->buildMultiple(Array) (Line: 339) Drupal\Core\Entity\EntityViewBuilder->buildComponents(Array, Array, Array, 'full') (Line: 24) Drupal\node\NodeViewBuilder->buildComponents(Array, Array, Array, 'full') (Line: 281) Drupal\Core\Entity\EntityViewBuilder->buildMultiple(Array) (Line: 238) Drupal\Core\Entity\EntityViewBuilder->build(Array) call_user_func_array(Array, Array) (Line: 111) Drupal\Core\Render\Renderer->doTrustedCallback(Array, Array, 'Render #pre_render callbacks must be methods of a class that implements \Drupal\Core\Security\TrustedCallbackInterface or be an anonymous function. The callback was %s. See https://www.drupal.org/node/2966725', 'exception', 'Drupal\Core\Render\Element\RenderCallbackInterface') (Line: 859) Drupal\Core\Render\Renderer->doCallback('#pre_render', Array, Array) (Line: 421) Drupal\Core\Render\Renderer->doRender(Array, ) (Line: 240) Drupal\Core\Render\Renderer->render(Array, ) (Line: 238) Drupal\Core\Render\MainContent\HtmlRenderer->Drupal\Core\Render\MainContent\{closure}() (Line: 627) Drupal\Core\Render\Renderer->executeInRenderContext(Object, Object) (Line: 239) Drupal\Core\Render\MainContent\HtmlRenderer->prepare(Array, Object, Object) (Line: 128) Drupal\Core\Render\MainContent\HtmlRenderer->renderResponse(Array, Object, Object) (Line: 90) Drupal\Core\EventSubscriber\MainContentViewSubscriber->onViewRenderArray(Object, 'kernel.view', Object) call_user_func(Array, Object, 'kernel.view', Object) (Line: 111) Drupal\Component\EventDispatcher\ContainerAwareEventDispatcher->dispatch(Object, 'kernel.view') (Line: 186) Symfony\Component\HttpKernel\HttpKernel->handleRaw(Object, 1) (Line: 76) Symfony\Component\HttpKernel\HttpKernel->handle(Object, 1, 1) (Line: 58) Drupal\Core\StackMiddleware\Session->handle(Object, 1, 1) (Line: 48) Drupal\Core\StackMiddleware\KernelPreHandle->handle(Object, 1, 1) (Line: 28) Drupal\Core\StackMiddleware\ContentLength->handle(Object, 1, 1) (Line: 32) Drupal\big_pipe\StackMiddleware\ContentLength->handle(Object, 1, 1) (Line: 191) Drupal\page_cache\StackMiddleware\PageCache->fetch(Object, 1, 1) (Line: 128) Drupal\page_cache\StackMiddleware\PageCache->lookup(Object, 1, 1) (Line: 82) Drupal\page_cache\StackMiddleware\PageCache->handle(Object, 1, 1) (Line: 48) Drupal\Core\StackMiddleware\ReverseProxyMiddleware->handle(Object, 1, 1) (Line: 51) Drupal\Core\StackMiddleware\NegotiationMiddleware->handle(Object, 1, 1) (Line: 36) Drupal\Core\StackMiddleware\AjaxPageState->handle(Object, 1, 1) (Line: 51) Drupal\Core\StackMiddleware\StackedHttpKernel->handle(Object, 1, 1) (Line: 704) Drupal\Core\DrupalKernel->handle(Object) (Line: 19)Warning: Undefined variable $index in Drupal\responsive_bg_image_formatter\Plugin\Field\FieldFormatter\ResponsiveBgImageFormatter->viewElements() (line 153 of modules/custom/responsive_bg_image_formatter/src/Plugin/Field/FieldFormatter/ResponsiveBgImageFormatter.php).
Drupal\responsive_bg_image_formatter\Plugin\Field\FieldFormatter\ResponsiveBgImageFormatter->viewElements(Object, 'en') (Line: 91)
Drupal\Core\Field\FormatterBase->view(Object, 'en') (Line: 76)
Drupal\Core\Field\Plugin\Field\FieldFormatter\EntityReferenceFormatterBase->view(Object, NULL) (Line: 268)
Drupal\Core\Entity\Entity\EntityViewDisplay->buildMultiple(Array) (Line: 339)
Drupal\Core\Entity\EntityViewBuilder->buildComponents(Array, Array, Array, 'full') (Line: 24)
Drupal\node\NodeViewBuilder->buildComponents(Array, Array, Array, 'full') (Line: 281)
Drupal\Core\Entity\EntityViewBuilder->buildMultiple(Array) (Line: 238)
Drupal\Core\Entity\EntityViewBuilder->build(Array)
call_user_func_array(Array, Array) (Line: 111)
Drupal\Core\Render\Renderer->doTrustedCallback(Array, Array, 'Render #pre_render callbacks must be methods of a class that implements \Drupal\Core\Security\TrustedCallbackInterface or be an anonymous function. The callback was %s. See https://www.drupal.org/node/2966725', 'exception', 'Drupal\Core\Render\Element\RenderCallbackInterface') (Line: 859)
Drupal\Core\Render\Renderer->doCallback('#pre_render', Array, Array) (Line: 421)
Drupal\Core\Render\Renderer->doRender(Array, ) (Line: 240)
Drupal\Core\Render\Renderer->render(Array, ) (Line: 238)
Drupal\Core\Render\MainContent\HtmlRenderer->Drupal\Core\Render\MainContent\{closure}() (Line: 627)
Drupal\Core\Render\Renderer->executeInRenderContext(Object, Object) (Line: 239)
Drupal\Core\Render\MainContent\HtmlRenderer->prepare(Array, Object, Object) (Line: 128)
Drupal\Core\Render\MainContent\HtmlRenderer->renderResponse(Array, Object, Object) (Line: 90)
Drupal\Core\EventSubscriber\MainContentViewSubscriber->onViewRenderArray(Object, 'kernel.view', Object)
call_user_func(Array, Object, 'kernel.view', Object) (Line: 111)
Drupal\Component\EventDispatcher\ContainerAwareEventDispatcher->dispatch(Object, 'kernel.view') (Line: 186)
Symfony\Component\HttpKernel\HttpKernel->handleRaw(Object, 1) (Line: 76)
Symfony\Component\HttpKernel\HttpKernel->handle(Object, 1, 1) (Line: 58)
Drupal\Core\StackMiddleware\Session->handle(Object, 1, 1) (Line: 48)
Drupal\Core\StackMiddleware\KernelPreHandle->handle(Object, 1, 1) (Line: 28)
Drupal\Core\StackMiddleware\ContentLength->handle(Object, 1, 1) (Line: 32)
Drupal\big_pipe\StackMiddleware\ContentLength->handle(Object, 1, 1) (Line: 191)
Drupal\page_cache\StackMiddleware\PageCache->fetch(Object, 1, 1) (Line: 128)
Drupal\page_cache\StackMiddleware\PageCache->lookup(Object, 1, 1) (Line: 82)
Drupal\page_cache\StackMiddleware\PageCache->handle(Object, 1, 1) (Line: 48)
Drupal\Core\StackMiddleware\ReverseProxyMiddleware->handle(Object, 1, 1) (Line: 51)
Drupal\Core\StackMiddleware\NegotiationMiddleware->handle(Object, 1, 1) (Line: 36)
Drupal\Core\StackMiddleware\AjaxPageState->handle(Object, 1, 1) (Line: 51)
Drupal\Core\StackMiddleware\StackedHttpKernel->handle(Object, 1, 1) (Line: 704)
Drupal\Core\DrupalKernel->handle(Object) (Line: 19)
Snow drought and early, accelerated snowmelt raise concerns as we head into summer.
Key Points
- Snow drought conditions that have persisted throughout winter remain locked in place over a large expanse of the Western U.S. during the climatological peak of the snow season. Warm and dry weather over the past week has led to early and accelerated snowmelt throughout the West.
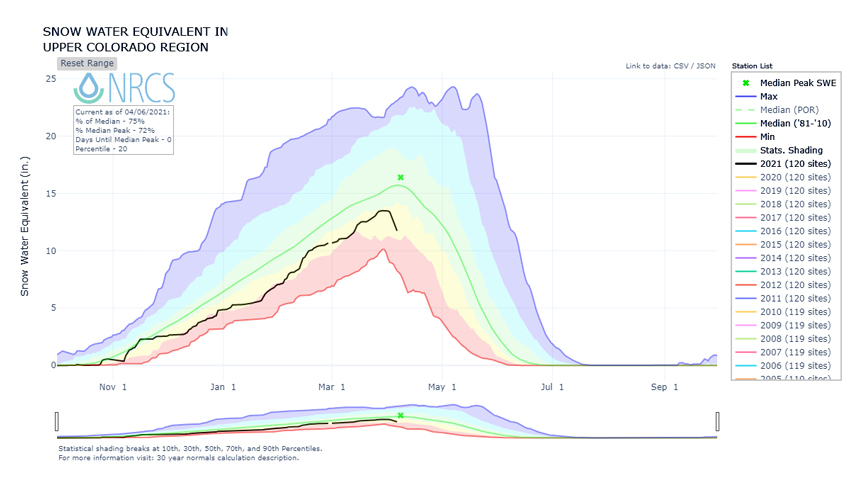
- The Upper Colorado River Basin–averaged snow water equivalent indicates peak snowpack a week earlier than normal and early, record or near-record melt from March 29–April 5, which raises major concerns for water supply and fire danger heading into the summer.
- A very similar situation is unfolding throughout the Sierra Nevada that will impact California and western Nevada this summer.
- Snowpack conditions in Alaska are generally good with the exception of basins along the Alaska-Yukon border.
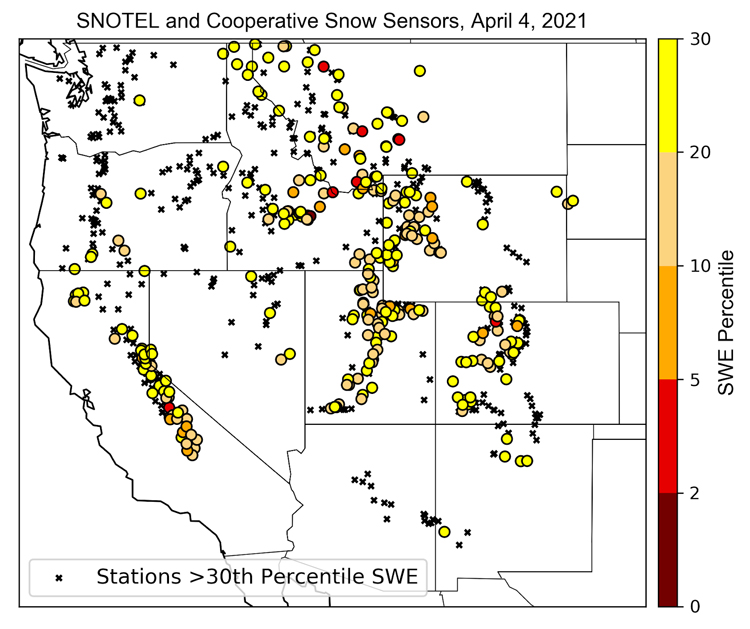
This USDA Natural Resources Conservation Service (NRCS) map shows Snow Telemetry (SNOTEL) snow water equivalent (SWE) basin values over the western U.S. as a percent of the NRCS 1981–2010 median. Only stations with at least 20 years of data are included in the station averages.
The SWE percent of normal represents the current SWE found at selected SNOTEL sites in or near the basin compared to the average value for those sites on this day. This map is valid as of April 4, 2021.
For an interactive version of this map please visit NRCS.
This USDA Natural Resources Conservation Service (NRCS) map shows Snow Telemetry (SNOTEL) and Snow Course snow water equivalent (SWE) basin values over Alaska as a percent of the NRCS 1981–2010 median. Only stations with at least 20 years of data are included in the station averages.
The SWE percent of normal represents the current SWE found at selected SNOTEL and Snow Course sites in or near the basin compared to the average value for those sites on this day. This map is valid through the end of March 2021.
For an interactive version of this map please visit NRCS.
SWE Percent of NRCS 1981-2010 Median
This USDA Natural Resources Conservation Service (NRCS) map shows Snow Telemetry (SNOTEL) snow water equivalent (SWE) basin values over the western U.S. as a percent of the NRCS 1981–2010 median. Only stations with at least 20 years of data are included in the station averages.
The SWE percent of normal represents the current SWE found at selected SNOTEL sites in or near the basin compared to the average value for those sites on this day. This map is valid as of April 4, 2021.
For an interactive version of this map please visit NRCS.
This USDA Natural Resources Conservation Service (NRCS) map shows Snow Telemetry (SNOTEL) and Snow Course snow water equivalent (SWE) basin values over Alaska as a percent of the NRCS 1981–2010 median. Only stations with at least 20 years of data are included in the station averages.
The SWE percent of normal represents the current SWE found at selected SNOTEL and Snow Course sites in or near the basin compared to the average value for those sites on this day. This map is valid through the end of March 2021.
For an interactive version of this map please visit NRCS.
Snow drought conditions that have persisted throughout winter remain locked in place over a large expanse of the Western U.S. during the climatological peak of the snow season. Subsequently, warm and dry weather over the past week has led to early and accelerated snowmelt throughout the West. The spatial extent of snow drought has increased a bit (5%–10%) since mid-March with 72% of stations reporting below-median snow water equivalent (SWE) and 42% of stations below the 30th percentile.*
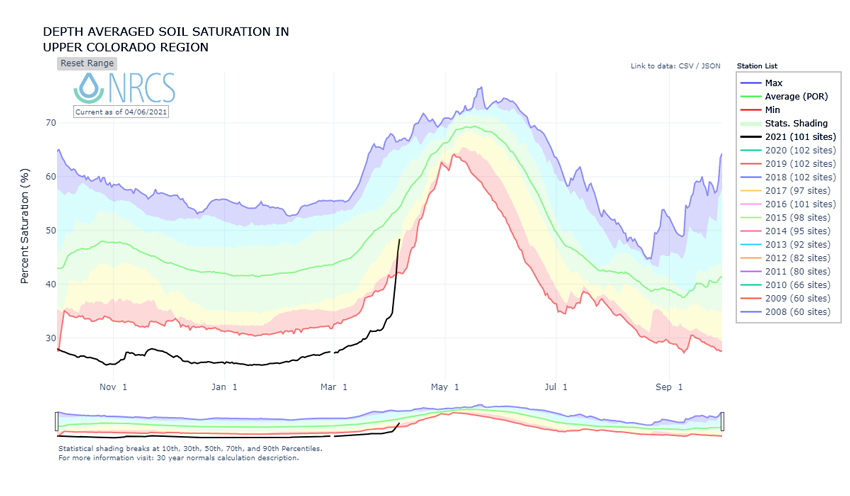
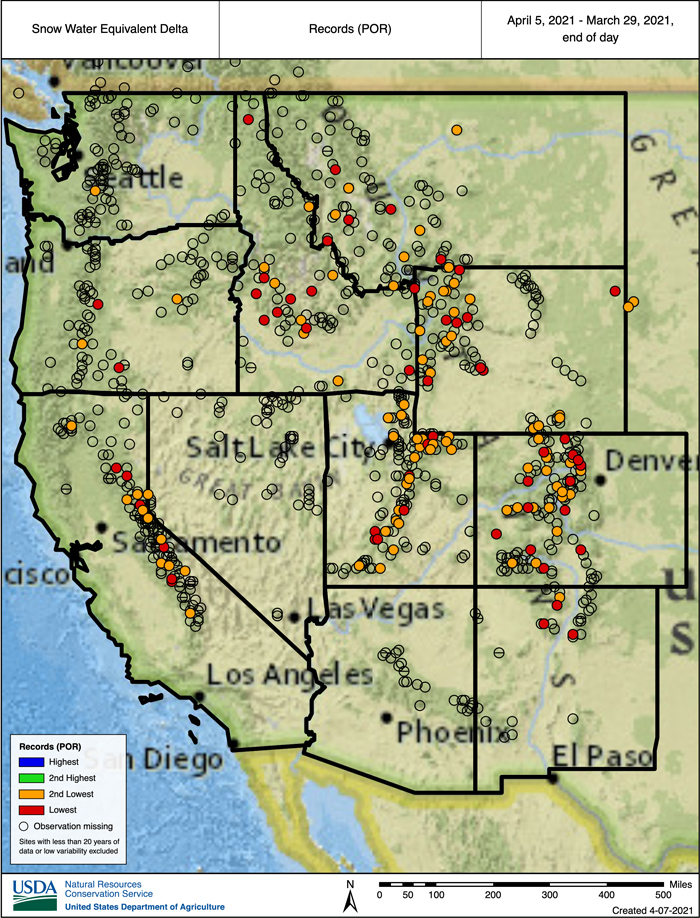
One area of concern heading into the spring and summer runoff season is the Upper Colorado River Basin (UCRB), which currently sits at 75% of normal SWE for this time of year. The U.S. Drought Monitor currently depicts widespread Extreme (D3) and Exceptional (D4) drought throughout the basin. The UCRB basin-averaged SWE indicates peak snowpack for this year occurred about one week earlier than normal with melt underway since April 1 due to a warm and dry spell. Melt rates based on changes in SWE from March 29 to April 5 show record or near-record SWE declines for the 7-day period. Due to a dry autumn, soil moisture in the UCRB was at record low levels (since 2008) throughout the water year until recent snowmelt-driven upticks have brought moisture levels back above the 10th percentile. This situation raises major concern for water supply and fire danger heading into the summer. A very similar situation is unfolding throughout the Sierra Nevada that will impact California and western Nevada this summer.
April 1st snowpack conditions are near or above normal for much of the Northwest, with persistent below-normal snowpack in southwest and southeast Oregon. Changes to statewide snowpack in March varied. Snowpack percent of normal increased for most basins in northern Oregon and remained consistent for Washington. In contrast, snowpack decreased for several basins in central and southern parts of Oregon and southern Idaho.
Snowpack conditions in Alaska are generally good with the exception of three HUC-6 basins along the Alaska-Yukon border that are 83%–88% of median SWE, based on the end of March SNOTEL and snow course measurements. Scattered individual stations throughout south-central Alaska are reporting 70%–89% of normal SWE, but surrounding stations are well above normal. A snowy stretch around the Fairbanks region of the Interior has led to well above-normal SWE and near-record snow depths for early April. According to the National Weather Service in Fairbanks, the April 3 snow depth was 40 inches and the second highest on record for that date.
Snow Water Equivalent (SWE) Values in the West: 30th Percentile or Lower
Snow Water Equivalent and Soil Saturation in the Upper Colorado Region
Record and Near-Record Snow Water Equivalent Changes: March 29–April 5
*Quantifying snow drought values is an ongoing research effort. Here we have used the 30th percentile as a starting point based on partner expertise. Get more information on the current definition of snow drought here.
For More Information, Please Contact:
Daniel McEvoy
Western Regional Climate Center
Daniel.McEvoy@dri.edu
Amanda Sheffield
NOAA/NIDIS California-Nevada Regional Drought Information Coordinator
Amanda.Sheffield@noaa.gov
Britt Parker
NOAA/NIDIS Pacific Northwest and Missouri River Basin Regional Drought Information Coordinator
Britt.Parker@noaa.gov
NIDIS and its partners launched this snow drought effort in 2018 to provide data, maps, and tools for monitoring snow drought and its impacts as well as communicating the status of snow drought across the United States, including Alaska. Thank you to our partners for your continued support of this effort and review of these updates. If you would like to report snow drought impacts, please use the link below. Information collected will be shared with the states affected to help us better understand the short term, long term, and cumulative impacts of snow drought to the citizens and the economy of the regions reliant on snowpack.
Report your Snow Drought Impacts Data and Maps | Snow Drought Research and Learn | Snow Drought

