Warning: Undefined variable $index in Drupal\responsive_bg_image_formatter\Plugin\Field\FieldFormatter\ResponsiveBgImageFormatter->viewElements() (line 95 of modules/custom/responsive_bg_image_formatter/src/Plugin/Field/FieldFormatter/ResponsiveBgImageFormatter.php).
Drupal\responsive_bg_image_formatter\Plugin\Field\FieldFormatter\ResponsiveBgImageFormatter->viewElements(Object, 'en') (Line: 91) Drupal\Core\Field\FormatterBase->view(Object, 'en') (Line: 76) Drupal\Core\Field\Plugin\Field\FieldFormatter\EntityReferenceFormatterBase->view(Object, NULL) (Line: 268) Drupal\Core\Entity\Entity\EntityViewDisplay->buildMultiple(Array) (Line: 339) Drupal\Core\Entity\EntityViewBuilder->buildComponents(Array, Array, Array, 'full') (Line: 24) Drupal\node\NodeViewBuilder->buildComponents(Array, Array, Array, 'full') (Line: 281) Drupal\Core\Entity\EntityViewBuilder->buildMultiple(Array) (Line: 238) Drupal\Core\Entity\EntityViewBuilder->build(Array) call_user_func_array(Array, Array) (Line: 111) Drupal\Core\Render\Renderer->doTrustedCallback(Array, Array, 'Render #pre_render callbacks must be methods of a class that implements \Drupal\Core\Security\TrustedCallbackInterface or be an anonymous function. The callback was %s. See https://www.drupal.org/node/2966725', 'exception', 'Drupal\Core\Render\Element\RenderCallbackInterface') (Line: 859) Drupal\Core\Render\Renderer->doCallback('#pre_render', Array, Array) (Line: 421) Drupal\Core\Render\Renderer->doRender(Array, ) (Line: 240) Drupal\Core\Render\Renderer->render(Array, ) (Line: 238) Drupal\Core\Render\MainContent\HtmlRenderer->Drupal\Core\Render\MainContent\{closure}() (Line: 627) Drupal\Core\Render\Renderer->executeInRenderContext(Object, Object) (Line: 239) Drupal\Core\Render\MainContent\HtmlRenderer->prepare(Array, Object, Object) (Line: 128) Drupal\Core\Render\MainContent\HtmlRenderer->renderResponse(Array, Object, Object) (Line: 90) Drupal\Core\EventSubscriber\MainContentViewSubscriber->onViewRenderArray(Object, 'kernel.view', Object) call_user_func(Array, Object, 'kernel.view', Object) (Line: 111) Drupal\Component\EventDispatcher\ContainerAwareEventDispatcher->dispatch(Object, 'kernel.view') (Line: 186) Symfony\Component\HttpKernel\HttpKernel->handleRaw(Object, 1) (Line: 76) Symfony\Component\HttpKernel\HttpKernel->handle(Object, 1, 1) (Line: 58) Drupal\Core\StackMiddleware\Session->handle(Object, 1, 1) (Line: 48) Drupal\Core\StackMiddleware\KernelPreHandle->handle(Object, 1, 1) (Line: 28) Drupal\Core\StackMiddleware\ContentLength->handle(Object, 1, 1) (Line: 32) Drupal\big_pipe\StackMiddleware\ContentLength->handle(Object, 1, 1) (Line: 191) Drupal\page_cache\StackMiddleware\PageCache->fetch(Object, 1, 1) (Line: 128) Drupal\page_cache\StackMiddleware\PageCache->lookup(Object, 1, 1) (Line: 82) Drupal\page_cache\StackMiddleware\PageCache->handle(Object, 1, 1) (Line: 48) Drupal\Core\StackMiddleware\ReverseProxyMiddleware->handle(Object, 1, 1) (Line: 51) Drupal\Core\StackMiddleware\NegotiationMiddleware->handle(Object, 1, 1) (Line: 36) Drupal\Core\StackMiddleware\AjaxPageState->handle(Object, 1, 1) (Line: 51) Drupal\Core\StackMiddleware\StackedHttpKernel->handle(Object, 1, 1) (Line: 704) Drupal\Core\DrupalKernel->handle(Object) (Line: 19)Warning: Undefined array key "width" in template_preprocess_responsive_image() (line 209 of core/modules/responsive_image/responsive_image.module).
template_preprocess_responsive_image(Array) (Line: 101) Drupal\responsive_bg_image_formatter\Plugin\Field\FieldFormatter\ResponsiveBgImageFormatter->viewElements(Object, 'en') (Line: 91) Drupal\Core\Field\FormatterBase->view(Object, 'en') (Line: 76) Drupal\Core\Field\Plugin\Field\FieldFormatter\EntityReferenceFormatterBase->view(Object, NULL) (Line: 268) Drupal\Core\Entity\Entity\EntityViewDisplay->buildMultiple(Array) (Line: 339) Drupal\Core\Entity\EntityViewBuilder->buildComponents(Array, Array, Array, 'full') (Line: 24) Drupal\node\NodeViewBuilder->buildComponents(Array, Array, Array, 'full') (Line: 281) Drupal\Core\Entity\EntityViewBuilder->buildMultiple(Array) (Line: 238) Drupal\Core\Entity\EntityViewBuilder->build(Array) call_user_func_array(Array, Array) (Line: 111) Drupal\Core\Render\Renderer->doTrustedCallback(Array, Array, 'Render #pre_render callbacks must be methods of a class that implements \Drupal\Core\Security\TrustedCallbackInterface or be an anonymous function. The callback was %s. See https://www.drupal.org/node/2966725', 'exception', 'Drupal\Core\Render\Element\RenderCallbackInterface') (Line: 859) Drupal\Core\Render\Renderer->doCallback('#pre_render', Array, Array) (Line: 421) Drupal\Core\Render\Renderer->doRender(Array, ) (Line: 240) Drupal\Core\Render\Renderer->render(Array, ) (Line: 238) Drupal\Core\Render\MainContent\HtmlRenderer->Drupal\Core\Render\MainContent\{closure}() (Line: 627) Drupal\Core\Render\Renderer->executeInRenderContext(Object, Object) (Line: 239) Drupal\Core\Render\MainContent\HtmlRenderer->prepare(Array, Object, Object) (Line: 128) Drupal\Core\Render\MainContent\HtmlRenderer->renderResponse(Array, Object, Object) (Line: 90) Drupal\Core\EventSubscriber\MainContentViewSubscriber->onViewRenderArray(Object, 'kernel.view', Object) call_user_func(Array, Object, 'kernel.view', Object) (Line: 111) Drupal\Component\EventDispatcher\ContainerAwareEventDispatcher->dispatch(Object, 'kernel.view') (Line: 186) Symfony\Component\HttpKernel\HttpKernel->handleRaw(Object, 1) (Line: 76) Symfony\Component\HttpKernel\HttpKernel->handle(Object, 1, 1) (Line: 58) Drupal\Core\StackMiddleware\Session->handle(Object, 1, 1) (Line: 48) Drupal\Core\StackMiddleware\KernelPreHandle->handle(Object, 1, 1) (Line: 28) Drupal\Core\StackMiddleware\ContentLength->handle(Object, 1, 1) (Line: 32) Drupal\big_pipe\StackMiddleware\ContentLength->handle(Object, 1, 1) (Line: 191) Drupal\page_cache\StackMiddleware\PageCache->fetch(Object, 1, 1) (Line: 128) Drupal\page_cache\StackMiddleware\PageCache->lookup(Object, 1, 1) (Line: 82) Drupal\page_cache\StackMiddleware\PageCache->handle(Object, 1, 1) (Line: 48) Drupal\Core\StackMiddleware\ReverseProxyMiddleware->handle(Object, 1, 1) (Line: 51) Drupal\Core\StackMiddleware\NegotiationMiddleware->handle(Object, 1, 1) (Line: 36) Drupal\Core\StackMiddleware\AjaxPageState->handle(Object, 1, 1) (Line: 51) Drupal\Core\StackMiddleware\StackedHttpKernel->handle(Object, 1, 1) (Line: 704) Drupal\Core\DrupalKernel->handle(Object) (Line: 19)Warning: Undefined array key "height" in template_preprocess_responsive_image() (line 210 of core/modules/responsive_image/responsive_image.module).
template_preprocess_responsive_image(Array) (Line: 101) Drupal\responsive_bg_image_formatter\Plugin\Field\FieldFormatter\ResponsiveBgImageFormatter->viewElements(Object, 'en') (Line: 91) Drupal\Core\Field\FormatterBase->view(Object, 'en') (Line: 76) Drupal\Core\Field\Plugin\Field\FieldFormatter\EntityReferenceFormatterBase->view(Object, NULL) (Line: 268) Drupal\Core\Entity\Entity\EntityViewDisplay->buildMultiple(Array) (Line: 339) Drupal\Core\Entity\EntityViewBuilder->buildComponents(Array, Array, Array, 'full') (Line: 24) Drupal\node\NodeViewBuilder->buildComponents(Array, Array, Array, 'full') (Line: 281) Drupal\Core\Entity\EntityViewBuilder->buildMultiple(Array) (Line: 238) Drupal\Core\Entity\EntityViewBuilder->build(Array) call_user_func_array(Array, Array) (Line: 111) Drupal\Core\Render\Renderer->doTrustedCallback(Array, Array, 'Render #pre_render callbacks must be methods of a class that implements \Drupal\Core\Security\TrustedCallbackInterface or be an anonymous function. The callback was %s. See https://www.drupal.org/node/2966725', 'exception', 'Drupal\Core\Render\Element\RenderCallbackInterface') (Line: 859) Drupal\Core\Render\Renderer->doCallback('#pre_render', Array, Array) (Line: 421) Drupal\Core\Render\Renderer->doRender(Array, ) (Line: 240) Drupal\Core\Render\Renderer->render(Array, ) (Line: 238) Drupal\Core\Render\MainContent\HtmlRenderer->Drupal\Core\Render\MainContent\{closure}() (Line: 627) Drupal\Core\Render\Renderer->executeInRenderContext(Object, Object) (Line: 239) Drupal\Core\Render\MainContent\HtmlRenderer->prepare(Array, Object, Object) (Line: 128) Drupal\Core\Render\MainContent\HtmlRenderer->renderResponse(Array, Object, Object) (Line: 90) Drupal\Core\EventSubscriber\MainContentViewSubscriber->onViewRenderArray(Object, 'kernel.view', Object) call_user_func(Array, Object, 'kernel.view', Object) (Line: 111) Drupal\Component\EventDispatcher\ContainerAwareEventDispatcher->dispatch(Object, 'kernel.view') (Line: 186) Symfony\Component\HttpKernel\HttpKernel->handleRaw(Object, 1) (Line: 76) Symfony\Component\HttpKernel\HttpKernel->handle(Object, 1, 1) (Line: 58) Drupal\Core\StackMiddleware\Session->handle(Object, 1, 1) (Line: 48) Drupal\Core\StackMiddleware\KernelPreHandle->handle(Object, 1, 1) (Line: 28) Drupal\Core\StackMiddleware\ContentLength->handle(Object, 1, 1) (Line: 32) Drupal\big_pipe\StackMiddleware\ContentLength->handle(Object, 1, 1) (Line: 191) Drupal\page_cache\StackMiddleware\PageCache->fetch(Object, 1, 1) (Line: 128) Drupal\page_cache\StackMiddleware\PageCache->lookup(Object, 1, 1) (Line: 82) Drupal\page_cache\StackMiddleware\PageCache->handle(Object, 1, 1) (Line: 48) Drupal\Core\StackMiddleware\ReverseProxyMiddleware->handle(Object, 1, 1) (Line: 51) Drupal\Core\StackMiddleware\NegotiationMiddleware->handle(Object, 1, 1) (Line: 36) Drupal\Core\StackMiddleware\AjaxPageState->handle(Object, 1, 1) (Line: 51) Drupal\Core\StackMiddleware\StackedHttpKernel->handle(Object, 1, 1) (Line: 704) Drupal\Core\DrupalKernel->handle(Object) (Line: 19)Warning: Undefined array key "media" in Drupal\responsive_bg_image_formatter\Plugin\Field\FieldFormatter\ResponsiveBgImageFormatter->viewElements() (line 112 of modules/custom/responsive_bg_image_formatter/src/Plugin/Field/FieldFormatter/ResponsiveBgImageFormatter.php).
Drupal\responsive_bg_image_formatter\Plugin\Field\FieldFormatter\ResponsiveBgImageFormatter->viewElements(Object, 'en') (Line: 91)
Drupal\Core\Field\FormatterBase->view(Object, 'en') (Line: 76)
Drupal\Core\Field\Plugin\Field\FieldFormatter\EntityReferenceFormatterBase->view(Object, NULL) (Line: 268)
Drupal\Core\Entity\Entity\EntityViewDisplay->buildMultiple(Array) (Line: 339)
Drupal\Core\Entity\EntityViewBuilder->buildComponents(Array, Array, Array, 'full') (Line: 24)
Drupal\node\NodeViewBuilder->buildComponents(Array, Array, Array, 'full') (Line: 281)
Drupal\Core\Entity\EntityViewBuilder->buildMultiple(Array) (Line: 238)
Drupal\Core\Entity\EntityViewBuilder->build(Array)
call_user_func_array(Array, Array) (Line: 111)
Drupal\Core\Render\Renderer->doTrustedCallback(Array, Array, 'Render #pre_render callbacks must be methods of a class that implements \Drupal\Core\Security\TrustedCallbackInterface or be an anonymous function. The callback was %s. See https://www.drupal.org/node/2966725', 'exception', 'Drupal\Core\Render\Element\RenderCallbackInterface') (Line: 859)
Drupal\Core\Render\Renderer->doCallback('#pre_render', Array, Array) (Line: 421)
Drupal\Core\Render\Renderer->doRender(Array, ) (Line: 240)
Drupal\Core\Render\Renderer->render(Array, ) (Line: 238)
Drupal\Core\Render\MainContent\HtmlRenderer->Drupal\Core\Render\MainContent\{closure}() (Line: 627)
Drupal\Core\Render\Renderer->executeInRenderContext(Object, Object) (Line: 239)
Drupal\Core\Render\MainContent\HtmlRenderer->prepare(Array, Object, Object) (Line: 128)
Drupal\Core\Render\MainContent\HtmlRenderer->renderResponse(Array, Object, Object) (Line: 90)
Drupal\Core\EventSubscriber\MainContentViewSubscriber->onViewRenderArray(Object, 'kernel.view', Object)
call_user_func(Array, Object, 'kernel.view', Object) (Line: 111)
Drupal\Component\EventDispatcher\ContainerAwareEventDispatcher->dispatch(Object, 'kernel.view') (Line: 186)
Symfony\Component\HttpKernel\HttpKernel->handleRaw(Object, 1) (Line: 76)
Symfony\Component\HttpKernel\HttpKernel->handle(Object, 1, 1) (Line: 58)
Drupal\Core\StackMiddleware\Session->handle(Object, 1, 1) (Line: 48)
Drupal\Core\StackMiddleware\KernelPreHandle->handle(Object, 1, 1) (Line: 28)
Drupal\Core\StackMiddleware\ContentLength->handle(Object, 1, 1) (Line: 32)
Drupal\big_pipe\StackMiddleware\ContentLength->handle(Object, 1, 1) (Line: 191)
Drupal\page_cache\StackMiddleware\PageCache->fetch(Object, 1, 1) (Line: 128)
Drupal\page_cache\StackMiddleware\PageCache->lookup(Object, 1, 1) (Line: 82)
Drupal\page_cache\StackMiddleware\PageCache->handle(Object, 1, 1) (Line: 48)
Drupal\Core\StackMiddleware\ReverseProxyMiddleware->handle(Object, 1, 1) (Line: 51)
Drupal\Core\StackMiddleware\NegotiationMiddleware->handle(Object, 1, 1) (Line: 36)
Drupal\Core\StackMiddleware\AjaxPageState->handle(Object, 1, 1) (Line: 51)
Drupal\Core\StackMiddleware\StackedHttpKernel->handle(Object, 1, 1) (Line: 704)
Drupal\Core\DrupalKernel->handle(Object) (Line: 19)
Deprecated function: str_replace(): Passing null to parameter #3 ($subject) of type array|string is deprecated in Drupal\responsive_bg_image_formatter\Plugin\Field\FieldFormatter\ResponsiveBgImageFormatter->viewElements() (line 126 of modules/custom/responsive_bg_image_formatter/src/Plugin/Field/FieldFormatter/ResponsiveBgImageFormatter.php).
Drupal\responsive_bg_image_formatter\Plugin\Field\FieldFormatter\ResponsiveBgImageFormatter->viewElements(Object, 'en') (Line: 91) Drupal\Core\Field\FormatterBase->view(Object, 'en') (Line: 76) Drupal\Core\Field\Plugin\Field\FieldFormatter\EntityReferenceFormatterBase->view(Object, NULL) (Line: 268) Drupal\Core\Entity\Entity\EntityViewDisplay->buildMultiple(Array) (Line: 339) Drupal\Core\Entity\EntityViewBuilder->buildComponents(Array, Array, Array, 'full') (Line: 24) Drupal\node\NodeViewBuilder->buildComponents(Array, Array, Array, 'full') (Line: 281) Drupal\Core\Entity\EntityViewBuilder->buildMultiple(Array) (Line: 238) Drupal\Core\Entity\EntityViewBuilder->build(Array) call_user_func_array(Array, Array) (Line: 111) Drupal\Core\Render\Renderer->doTrustedCallback(Array, Array, 'Render #pre_render callbacks must be methods of a class that implements \Drupal\Core\Security\TrustedCallbackInterface or be an anonymous function. The callback was %s. See https://www.drupal.org/node/2966725', 'exception', 'Drupal\Core\Render\Element\RenderCallbackInterface') (Line: 859) Drupal\Core\Render\Renderer->doCallback('#pre_render', Array, Array) (Line: 421) Drupal\Core\Render\Renderer->doRender(Array, ) (Line: 240) Drupal\Core\Render\Renderer->render(Array, ) (Line: 238) Drupal\Core\Render\MainContent\HtmlRenderer->Drupal\Core\Render\MainContent\{closure}() (Line: 627) Drupal\Core\Render\Renderer->executeInRenderContext(Object, Object) (Line: 239) Drupal\Core\Render\MainContent\HtmlRenderer->prepare(Array, Object, Object) (Line: 128) Drupal\Core\Render\MainContent\HtmlRenderer->renderResponse(Array, Object, Object) (Line: 90) Drupal\Core\EventSubscriber\MainContentViewSubscriber->onViewRenderArray(Object, 'kernel.view', Object) call_user_func(Array, Object, 'kernel.view', Object) (Line: 111) Drupal\Component\EventDispatcher\ContainerAwareEventDispatcher->dispatch(Object, 'kernel.view') (Line: 186) Symfony\Component\HttpKernel\HttpKernel->handleRaw(Object, 1) (Line: 76) Symfony\Component\HttpKernel\HttpKernel->handle(Object, 1, 1) (Line: 58) Drupal\Core\StackMiddleware\Session->handle(Object, 1, 1) (Line: 48) Drupal\Core\StackMiddleware\KernelPreHandle->handle(Object, 1, 1) (Line: 28) Drupal\Core\StackMiddleware\ContentLength->handle(Object, 1, 1) (Line: 32) Drupal\big_pipe\StackMiddleware\ContentLength->handle(Object, 1, 1) (Line: 191) Drupal\page_cache\StackMiddleware\PageCache->fetch(Object, 1, 1) (Line: 128) Drupal\page_cache\StackMiddleware\PageCache->lookup(Object, 1, 1) (Line: 82) Drupal\page_cache\StackMiddleware\PageCache->handle(Object, 1, 1) (Line: 48) Drupal\Core\StackMiddleware\ReverseProxyMiddleware->handle(Object, 1, 1) (Line: 51) Drupal\Core\StackMiddleware\NegotiationMiddleware->handle(Object, 1, 1) (Line: 36) Drupal\Core\StackMiddleware\AjaxPageState->handle(Object, 1, 1) (Line: 51) Drupal\Core\StackMiddleware\StackedHttpKernel->handle(Object, 1, 1) (Line: 704) Drupal\Core\DrupalKernel->handle(Object) (Line: 19)Warning: Undefined variable $index in Drupal\responsive_bg_image_formatter\Plugin\Field\FieldFormatter\ResponsiveBgImageFormatter->viewElements() (line 153 of modules/custom/responsive_bg_image_formatter/src/Plugin/Field/FieldFormatter/ResponsiveBgImageFormatter.php).
Drupal\responsive_bg_image_formatter\Plugin\Field\FieldFormatter\ResponsiveBgImageFormatter->viewElements(Object, 'en') (Line: 91)
Drupal\Core\Field\FormatterBase->view(Object, 'en') (Line: 76)
Drupal\Core\Field\Plugin\Field\FieldFormatter\EntityReferenceFormatterBase->view(Object, NULL) (Line: 268)
Drupal\Core\Entity\Entity\EntityViewDisplay->buildMultiple(Array) (Line: 339)
Drupal\Core\Entity\EntityViewBuilder->buildComponents(Array, Array, Array, 'full') (Line: 24)
Drupal\node\NodeViewBuilder->buildComponents(Array, Array, Array, 'full') (Line: 281)
Drupal\Core\Entity\EntityViewBuilder->buildMultiple(Array) (Line: 238)
Drupal\Core\Entity\EntityViewBuilder->build(Array)
call_user_func_array(Array, Array) (Line: 111)
Drupal\Core\Render\Renderer->doTrustedCallback(Array, Array, 'Render #pre_render callbacks must be methods of a class that implements \Drupal\Core\Security\TrustedCallbackInterface or be an anonymous function. The callback was %s. See https://www.drupal.org/node/2966725', 'exception', 'Drupal\Core\Render\Element\RenderCallbackInterface') (Line: 859)
Drupal\Core\Render\Renderer->doCallback('#pre_render', Array, Array) (Line: 421)
Drupal\Core\Render\Renderer->doRender(Array, ) (Line: 240)
Drupal\Core\Render\Renderer->render(Array, ) (Line: 238)
Drupal\Core\Render\MainContent\HtmlRenderer->Drupal\Core\Render\MainContent\{closure}() (Line: 627)
Drupal\Core\Render\Renderer->executeInRenderContext(Object, Object) (Line: 239)
Drupal\Core\Render\MainContent\HtmlRenderer->prepare(Array, Object, Object) (Line: 128)
Drupal\Core\Render\MainContent\HtmlRenderer->renderResponse(Array, Object, Object) (Line: 90)
Drupal\Core\EventSubscriber\MainContentViewSubscriber->onViewRenderArray(Object, 'kernel.view', Object)
call_user_func(Array, Object, 'kernel.view', Object) (Line: 111)
Drupal\Component\EventDispatcher\ContainerAwareEventDispatcher->dispatch(Object, 'kernel.view') (Line: 186)
Symfony\Component\HttpKernel\HttpKernel->handleRaw(Object, 1) (Line: 76)
Symfony\Component\HttpKernel\HttpKernel->handle(Object, 1, 1) (Line: 58)
Drupal\Core\StackMiddleware\Session->handle(Object, 1, 1) (Line: 48)
Drupal\Core\StackMiddleware\KernelPreHandle->handle(Object, 1, 1) (Line: 28)
Drupal\Core\StackMiddleware\ContentLength->handle(Object, 1, 1) (Line: 32)
Drupal\big_pipe\StackMiddleware\ContentLength->handle(Object, 1, 1) (Line: 191)
Drupal\page_cache\StackMiddleware\PageCache->fetch(Object, 1, 1) (Line: 128)
Drupal\page_cache\StackMiddleware\PageCache->lookup(Object, 1, 1) (Line: 82)
Drupal\page_cache\StackMiddleware\PageCache->handle(Object, 1, 1) (Line: 48)
Drupal\Core\StackMiddleware\ReverseProxyMiddleware->handle(Object, 1, 1) (Line: 51)
Drupal\Core\StackMiddleware\NegotiationMiddleware->handle(Object, 1, 1) (Line: 36)
Drupal\Core\StackMiddleware\AjaxPageState->handle(Object, 1, 1) (Line: 51)
Drupal\Core\StackMiddleware\StackedHttpKernel->handle(Object, 1, 1) (Line: 704)
Drupal\Core\DrupalKernel->handle(Object) (Line: 19)
Dry soils are first in line for winter snowmelt.
Key Points
- Extreme to exceptional drought continues across the Intermountain West.
- Snow drought and early, accelerated snowmelt raise concerns about available water this summer.
Current U.S. Drought Monitor map for the Intermountain West Drought Early Warning System region with data valid for April 20, 2021. The U.S. Drought Monitor is updated each Thursday to show the location and intensity of drought across the country.
Over half (56%) of the combined Intermountain West region is in Extreme (D3) to Exceptional (D4) drought.
- Extreme (D3) drought conditions have been in place in this region since May 2020.
- The extent of D4 drought in the Intermountain West reached a peak of 45% area in December 2020, a new record for the region.
Moderate (D1) or worse drought has been in the region since August 2009.
U.S. Drought Monitor Categories
Current U.S. Drought Monitor map for the Intermountain West Drought Early Warning System region with data valid for April 20, 2021. The U.S. Drought Monitor is updated each Thursday to show the location and intensity of drought across the country.
Over half (56%) of the combined Intermountain West region is in Extreme (D3) to Exceptional (D4) drought.
- Extreme (D3) drought conditions have been in place in this region since May 2020.
- The extent of D4 drought in the Intermountain West reached a peak of 45% area in December 2020, a new record for the region.
Moderate (D1) or worse drought has been in the region since August 2009.
Recent and Current Conditions
State Drought Plans, Declarations, or States of Emergency in Effect
| Arizona | Colorado | New Mexico | Utah |
|---|---|---|---|
| Drought declaration from 2007 that has not been rescinded | State Drought Mitigation and Response Plan shifted from Phase 2 to Phase 3 (full activation) on November 30, 2020 | Drought declaration and activation of the State Drought Task Force, December 9, 2020 | Drought state of emergency issued on March 17, 2021 |
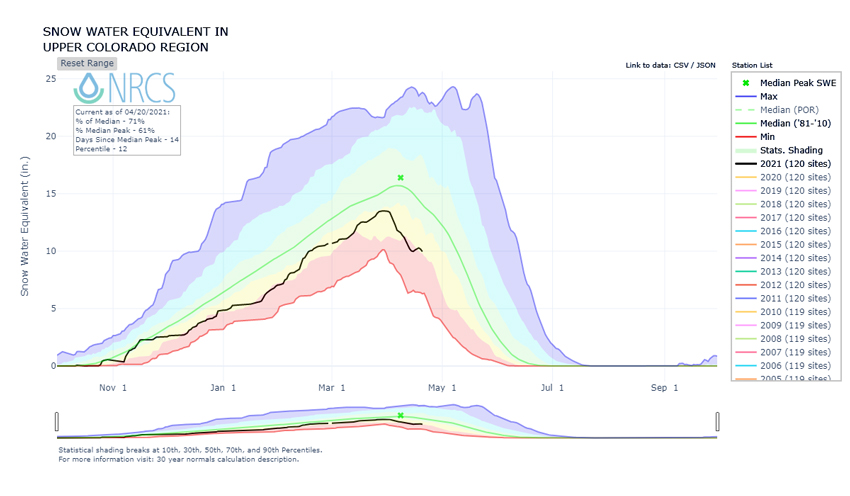
Current Snow Water Equivalent (SWE)
- Snow drought and early, accelerated snowmelt raise concerns as we head into summer.
- Colorado River Basin snowpack has reached its peak for the season and begun to melt.
- At its peak, seasonal snowpack was near average east of the Continental Divide but below average west of the Divide.
- Of note, the Colorado River basin (upper and lower) catchments are currently at 74% of Natural Resources Conservation Service 1981–2010 median.
Snow Water Equivalent in the Upper Colorado Region
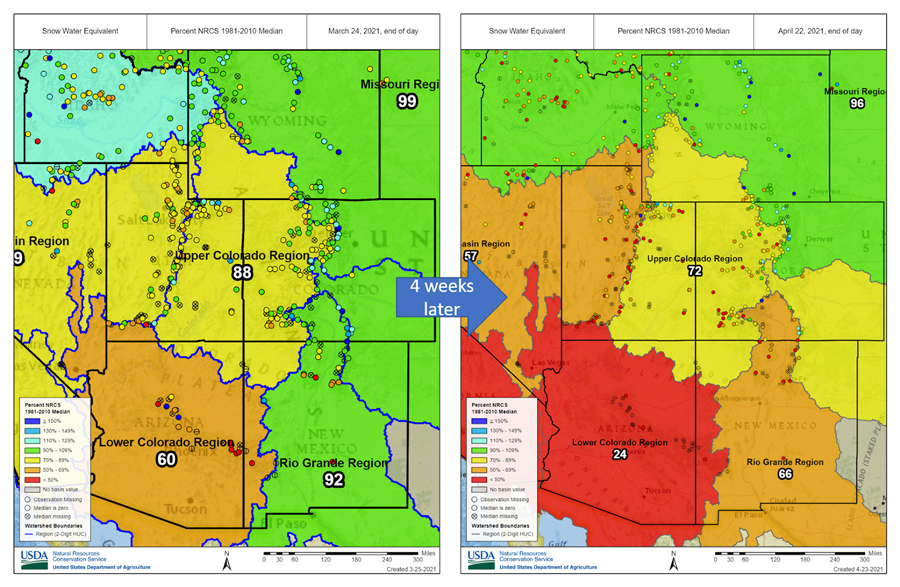
Change in Snow Water Equivalent: March 24 vs. April 22
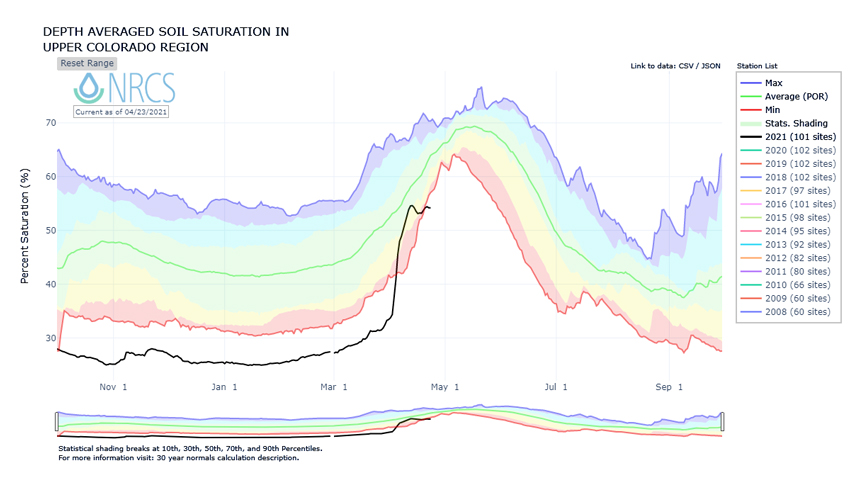
The impact of the early snowmelt is illustrated in the soil moisture graph below:
- Extremely dry soil in autumn
- Early snowmelt with rapid late March/early April warm period.
Soil Moisture in the Upper Colorado Region
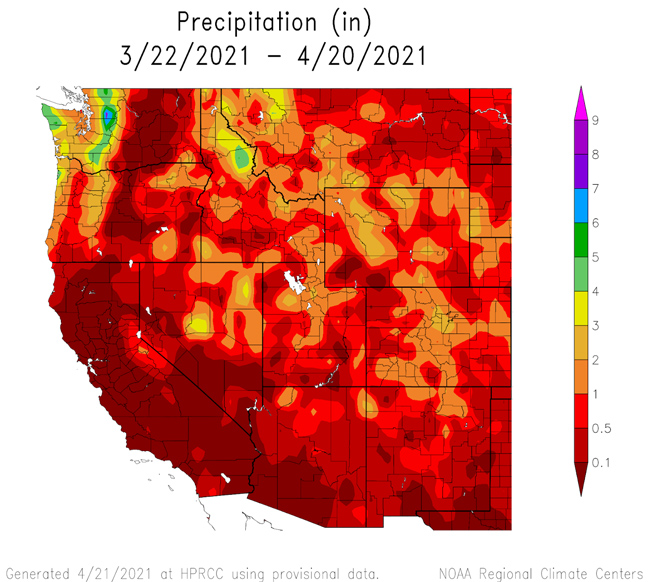
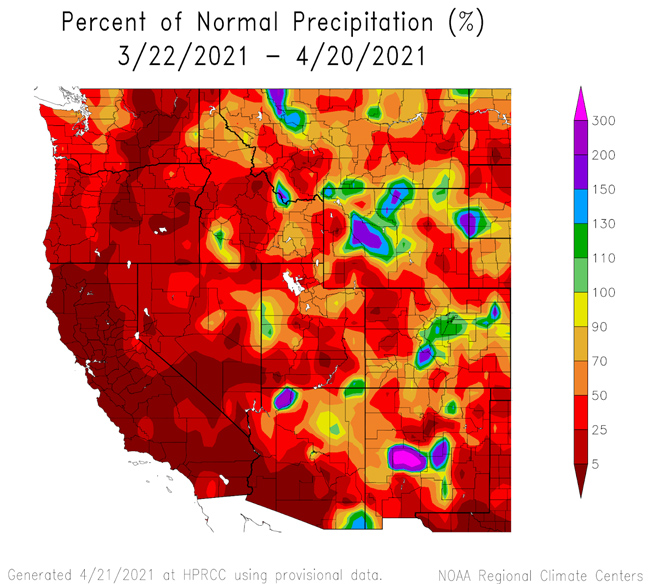
April Precipitation
Over the last 30 days, a series of small winter storms provided steady snow to the mountains of northern Utah and western Colorado. The accumulated precipitation was small compared to the average for this time of year.
Precipitation Conditions: March 21–April 20, 2021
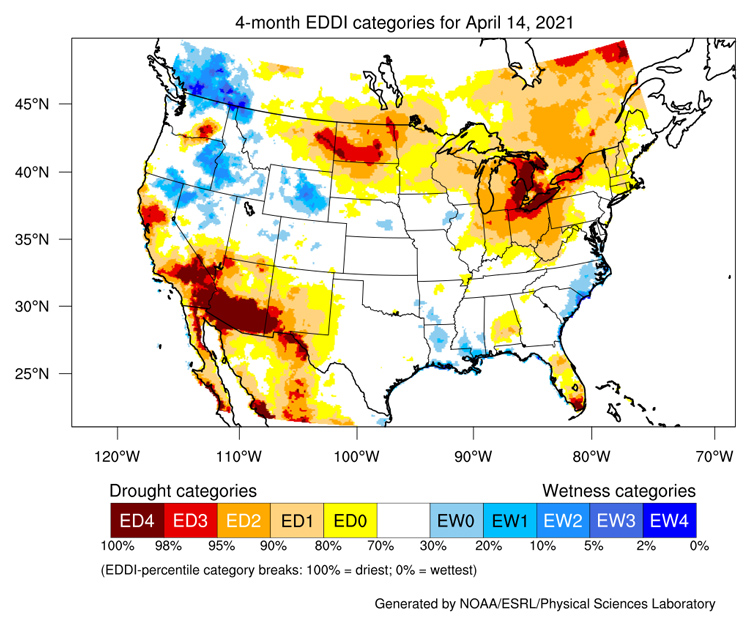
Evaporative Drought Demand Index (EDDI)
4-Week EDDI for April 14, 2021
- EDDI values have been favorable for Utah, Colorado, and Wyoming over the past month.
- There is high evaporation demand for this time of year across southern Arizona.
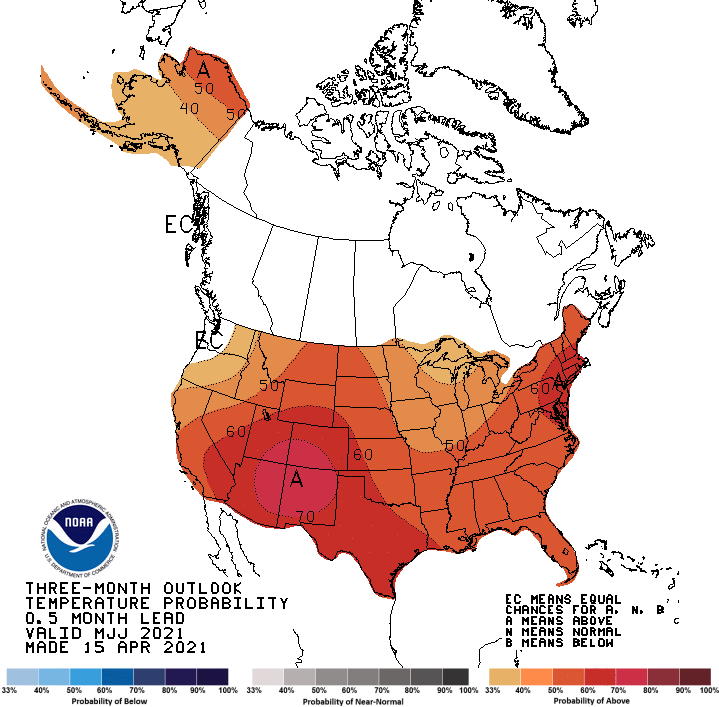
Seasonal Outlooks: May–July 2021
Temperature Outlook
For May–July, there is a greater chance for above-normal temperatures across the Intermountain West.
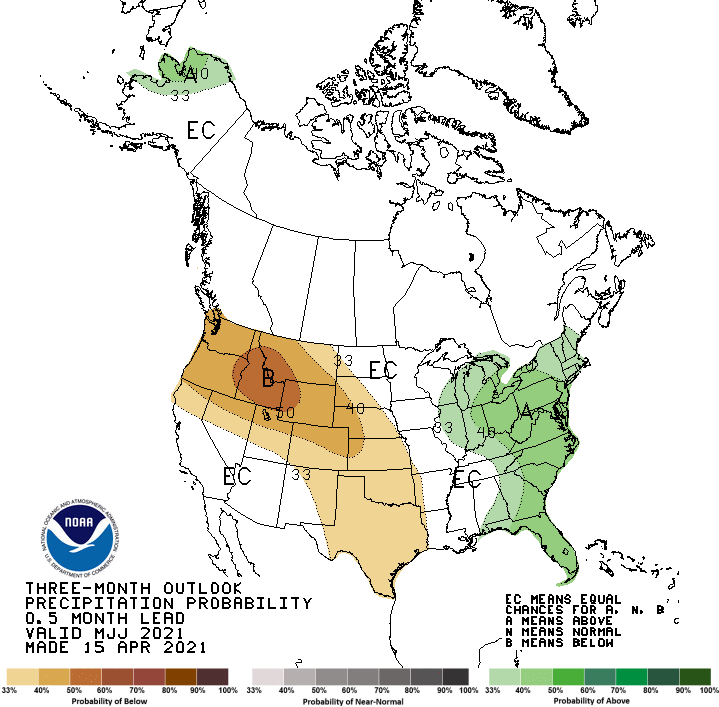
Precipitation Outlook
The precipitation outlook shows that below-average rainfall is the most likely outcome for May–July across the Intermountain West, including New Mexico, Colorado, Utah and Wyoming.
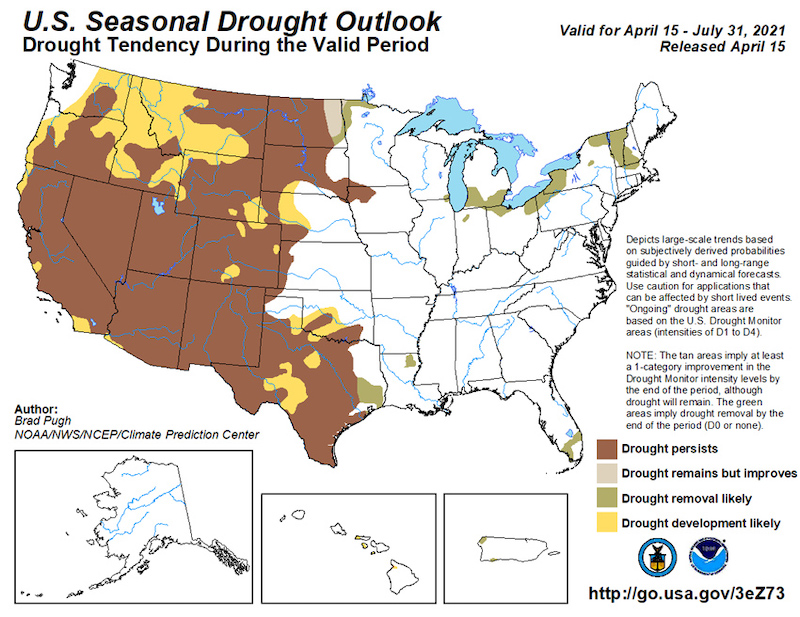
Drought Outlook
Long-term drought conditions are forecast to continue at least through June across the Intermountain West.
Climate Patterns
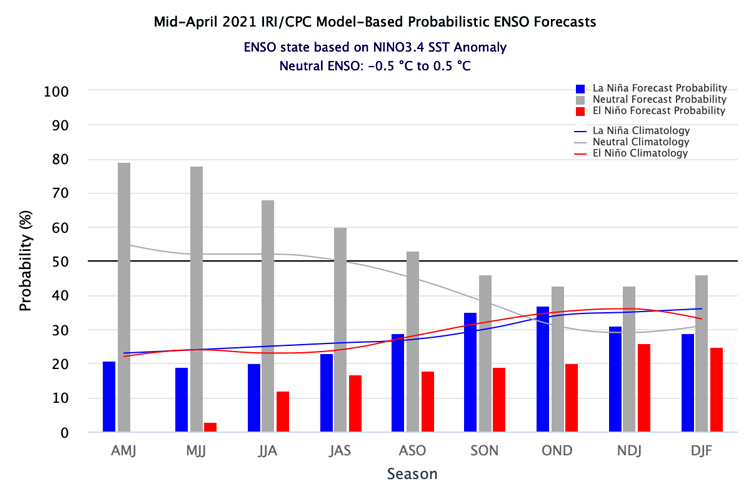
- NOAA’s El Niño–Southern Oscillation (ENSO) alert system status is currently a La Niña advisory with ENSO-neutral conditions expected to return within the coming weeks.
- Historically, the Southwest has experienced mixed rainfall conditions in the spring and summer during a La Niña. Southern Arizona is wetter while southern Texas is drier. As La Niña wanes, these connections will also break down.
- For more information, please check out the NOAA ENSO blog and the Western Regional Climate Center information page about the La Niña impacts for the west.
- ENSO forecasts from the International Research Institute (IRI) for Climate and Society show ENSO-neutral conditions returning within the coming months. An ENSO-neutral state is the most likely scenario for autumn and winter 2021, but a second La Niña cannot be ruled out, yet.
Probability of El Niño, La Niña, or Neutral Conditions: April 2021–February 2022
State-Based Conditions and Impacts
Arizona
- 86.56% of Arizona is in Extreme (D3) or Exceptional (D4) drought.
- Lake Mead is projected to be below 1,075 ft elevation on January 1, 2022, triggering a Tier 1 shortage.
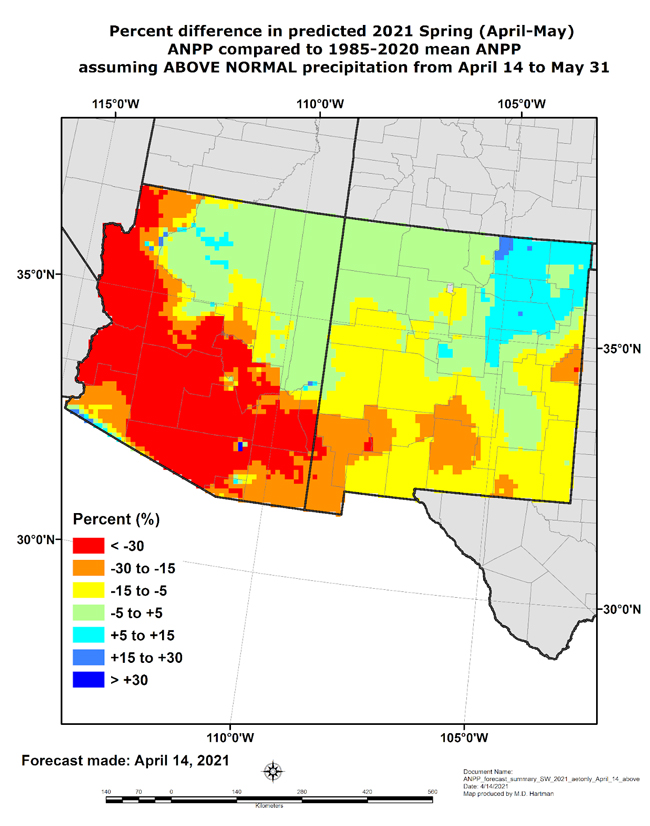
- Even with above-normal precipitation through the rest of spring, grass production will more than 30% below average as there is virtually no grass to start with (see map below).
Expected Grass Growth: Forecast Above-Ground Net Primary Production (ANPP) for April–May 2021
Colorado
- Warm early April conditions have given way to anomalously cool weather through the middle of the month. Western Colorado snowmelt was on a rapid pace early, but has slowed.
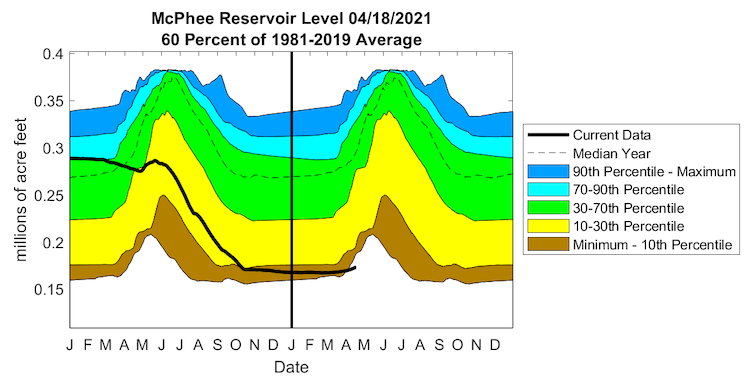
- One-third of SNOTEL-measured snowpack melted in southwest Colorado between late March and mid-April. In spite of this, key stream gages indicate rivers are still running at base flow, and reservoirs have yet to realize increases in storage. McPhee Reservoir storage is record low for this time of year. Conversely, seasonal snowpack in the South Platte Basin (northeast Colorado) is still increasing.
- Remotely-sensed vegetative health indicators are coming back into season. The Vegetation Drought Response Index (VegDRI) indicates severe drought on the west slopes, and moderate drought conditions for the eastern plains.
2020–2021 McPhee Reservoir Storage Compared to Historical Conditions
New Mexico
- Snowpack across the state is still low to very low.
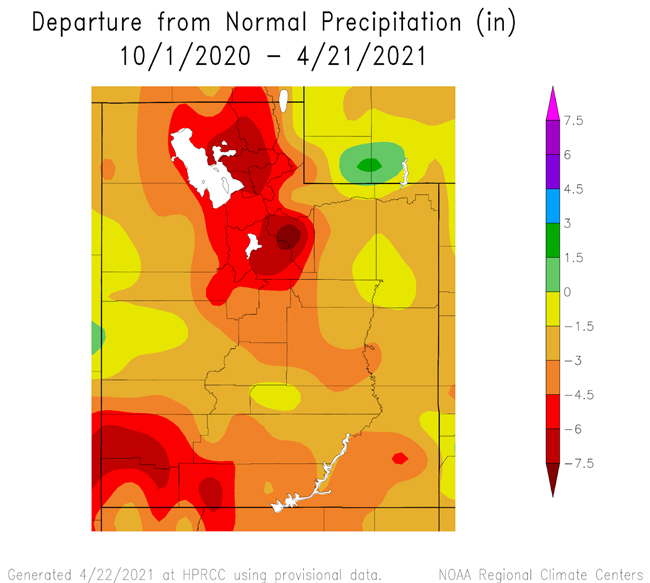
- Precipitation for April-to-date has been below average, overall, for New Mexico.
- Precipitation is historically low in April.
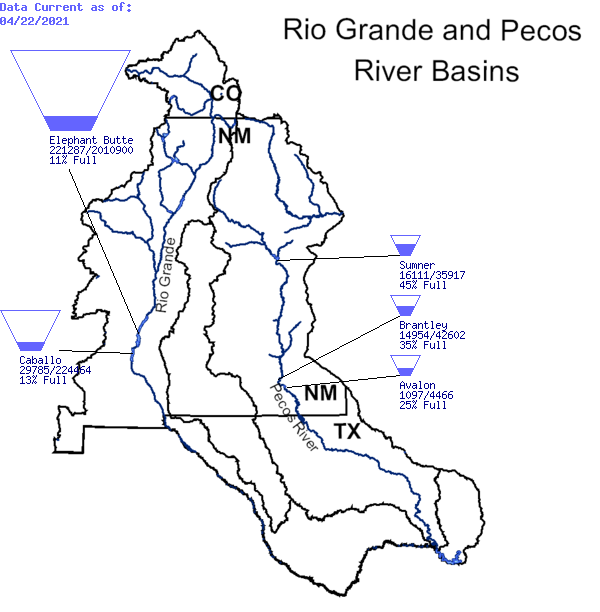
- Long-term drought shows up clearly in surface water levels in the Rio Grande and Pecos basins. For example, Elephant Butte storage is 11% of capacity.
Rio Grande and Pecos River Basin Reservoir Storage
Utah
- Water Year to date precipitation has been below the historical average for all of Utah. Some places, such as the Wasatch Mountains and southwest corner, have a precipitation deficit of more than 6 inches.
- Snowpack across northern Utah is currently between 50%–77% of the median for this time of the season, while snowpack across southern Utah is below 50% for all basins.
Utah Water Year Departure from Normal Precipitation
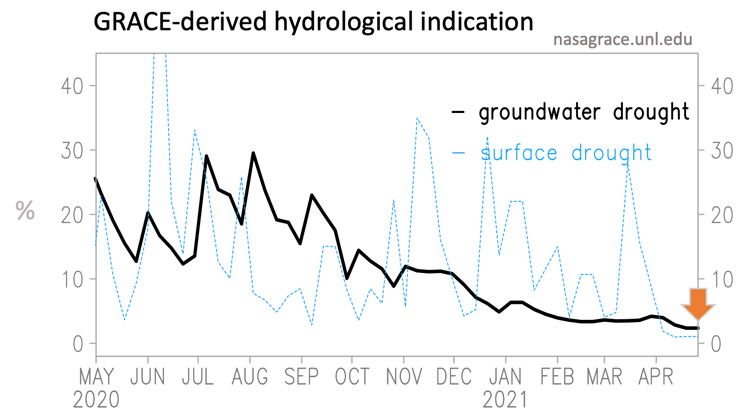
- Over Utah, “shallow groundwater” derived from GRACE satellites indicates a continual decline through April 26, despite multiple precipitation events in March. The ultra-dry subsurface diminishes the effect of recent precipitation, absorbing new moisture like a sponge.
Utah Shallow Groundwater and Surface Soil Moisture
Wyoming
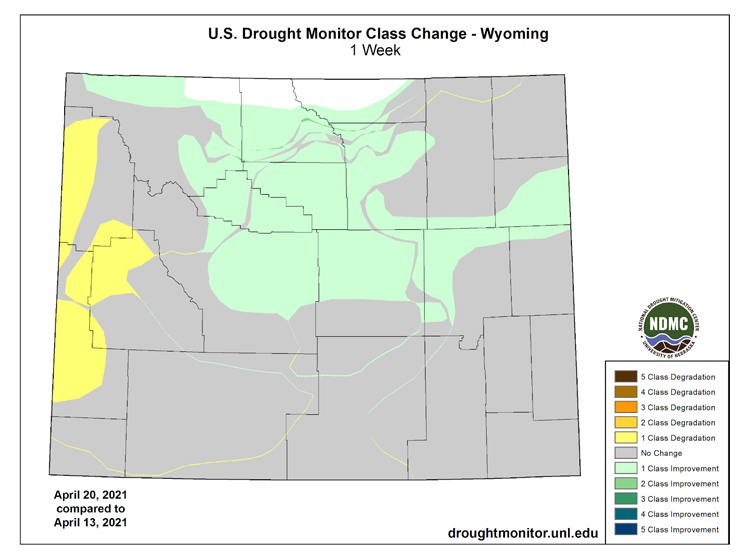
- A series of snow storms in April provided moisture to north-central Wyoming, which led to improvements in drought conditions in those areas.
- Snowpack in all Wyoming basins is above 70% of median for this point in the season.
- Precipitation from about the beginning of the Water Year has ranged from about 2.5 inches above normal in the eastern plains to more than 2.5 inches below normal in the south-central and most of the western mountains.
U.S. Drought Monitor Change Map: April 13 to April 20, 2021
For More Information
More local information is available from the following resources:
In Case You Missed It
- Webinar Recap: Southwest Drought Briefing, April 16, 2021
Upcoming Events
- April 27, 6–8 p.m. (MDT): Utah Agriculture Drought Impact Reporting: Building a Network for Drought Response.
- April 29, 6–8 p.m. (MDT): USDA Southwest Climate Hub and Sustainable Beef Project Webinar on Tools for Managing Drought
- April 30, 11 a.m.–12 p.m. (MDT): The Impacts of Climate Change on Snowpack and Streamflow in the Western U.S.
Prepared By
Joel Lisonbee
NOAA/National Integrated Drought Information System (NIDIS)
Nancy J. Selover
Arizona State Climatologist/Arizona State University
Simon Wang and Jon Meyer
Utah Climate Center/Utah State University
Dave DuBois
New Mexico Climate Center/New Mexico State University
Peter Goble
Colorado Climate Center/Colorado State University
Tony Bergantino
Water Resources Data System, Wyoming State Climate Office
This drought early warning update is issued in partnership between the National Oceanic and Atmospheric Administration (NOAA), and the offices of the state climatologist for Arizona, Colorado, New Mexico, Utah, and Wyoming. The purpose of the update is to communicate a potential area of concern for drought expansion and/or development within the Intermountain West based on recent conditions and the upcoming forecast. NIDIS and its partners will issue future drought updates as conditions evolve.