National Water Prediction Service (NWPS) Quantitative Precipitation Estimates
NOAA National Weather Service's National Water Prediction Service (NWPS)
The National Weather Service (NWS) National Water Prediction Service (NWPS) provides short-term observed and climatic trends of precipitation across the lower 48 United States (CONUS), Puerto Rico, and Alaska. Precipitation products include Observed Precipitation, Normal Precipitation, and Derived Precipitation Products.
Observed Precipitation
The 13 NWS River Forecast Centers (RFC) produce Quantitative Precipitation Estimates (QPE) for their individual RFC areas. The RFCs produce the data using a multi-sensor approach utilizing radar estimates of precipitation, automated and manual precipitation gauges, and satellite estimates of precipitation. The radar and gauge fields are combined into a "multisensor field", which is quality controlled on an hourly basis. In areas where there is limited or no radar coverage, satellite precipitation estimates can be incorporated into this multisensor field. In mountainous areas west of the Continental Divide, additional methods are used to derive the "Observed" data. Gauge reports are plotted against long term climatological precipitation (PRISM data), and derived amounts are interpolated between gauge locations.
The QPEs from each RFC are combined into a single mosaic to create a QPE product that covers the lower 48 states, Alaska and Puerto Rico. The data are on an approximate 4km x 4km grid cell scale.
Normal Precipitation
"Normal" precipitation is derived from PRISM climate data, created at Oregon State University. The PRISM gridded climate maps are considered the most detailed, highest-quality spatial climate datasets currently available. The 30-year PRISM normal from 1981-2010 is used for precipitation analysis since 2004. Prior to 2004, the 30 year PRISM normal from 1961-1990 is used.
Derived Precipitation Products: Percent of PRISM Normal and Departure from PRISM Normal
"Departure from Normal" and "Percentage of Normal" graphics are generated by simple grid mathematics, where the PRISM "Normal" dataset is respectively subtracted from or divided into the NWPS "Observed" dataset.
In March 2024, the NWPS replaced the NWS Advanced Hydrologic Prediction Service (AHPS) as the primary source for NWS water prediction information.
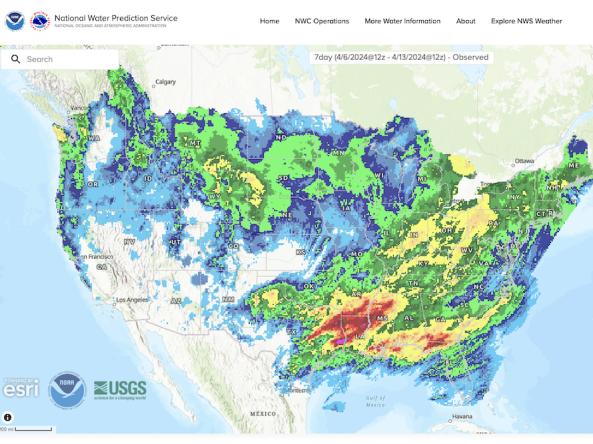
This map shows precipitation accumulations (in inches) for the past 7 days, according to the National Weather Service (NWS) National Water Prediction Service (NWPS). This product includes some manual quality control from the NWS River Forecast Centers. Darker green/blue shades indicate greater precipitation amounts.
This map shows precipitation accumulations (in inches) for the past 30 days, according to the National Weather Service (NWS) National Water Prediction Service (NWPS). This product includes some manual quality control from the NWS River Forecast Centers. Darker green/blue shades indicate greater precipitation amounts.
This map shows precipitation accumulations (in inches) for the past 90 days, according to the National Weather Service (NWS) National Water Prediction Service (NWPS). This product includes some manual quality control from the NWS River Forecast Centers. Darker green/blue shades indicate greater precipitation amounts.
Drought is defined as the lack of precipitation over an extended period of time, usually for a season or more, that results in a water shortage. Changes in precipitation can substantially disrupt crops and livestock, influence the frequency and intensity of severe weather events, and affect the quality and quantity of water available for municipal and industrial use.
Learn MoreDrought is defined as the lack of precipitation over an extended period of time, usually for a season or more, that results in a water shortage. Changes in precipitation can substantially disrupt crops and livestock, influence the frequency and intensity of severe weather events, and affect the quality and quantity of water available for municipal and industrial use.
Learn MoreDrought is defined as the lack of precipitation over an extended period of time, usually for a season or more, that results in a water shortage. Changes in precipitation can substantially disrupt crops and livestock, influence the frequency and intensity of severe weather events, and affect the quality and quantity of water available for municipal and industrial use.
Learn MoreInches of Precipitation
This location received less than 0.01 inch of precipitation during this 7-day period.
This location received 0.01–0.5 inch of precipitation during this 7-day period.
This location received 0.5–1 inch of precipitation during this 7-day period.
This location received 1–2 inches of precipitation during this 7-day period.
This location received 2–4 inches of precipitation during this 7-day period.
This location received 4–6 inches of precipitation during this 7-day period.
This location received 6–8 inches of precipitation during this 7-day period.
This location received more than 8 inches of precipitation during this 7-day period.
Inches of Precipitation
This location received less than 0.01 inch of precipitation during this 1-month period.
This location received 0.01–0.5 inch of precipitation during this 1-month period.
This location received 0.5–1 inch of precipitation during this 1-month period.
This location received 1–2 inches of precipitation during this 1-month period.
This location received 2–4 inches of precipitation during this 1-month period.
This location received 4–6 inches of precipitation during this 1-month period.
This location received 6–8 inches of precipitation during this 1-month period.
This location received more than 8 inches of precipitation during this 1-month period.
Inches of Precipitation
This location received less than 0.1 inch of precipitation during this 3-month period.
This location received 0.1–1 inch of precipitation during this 3-month period.
This location received 1–3 inch of precipitation during this 3-month period.
This location received 3–6 inches of precipitation during this 3-month period.
This location received 6–12 inches of precipitation during this 3-month period.
This location received 12–18 inches of precipitation during this 3-month period.
This location received 18–24 inches of precipitation during this 3-month period.
This location received more than 24 inches of precipitation during this 3-month period.
This map shows precipitation accumulations (in inches) for the past 7 days, according to the National Weather Service (NWS) National Water Prediction Service (NWPS). This product includes some manual quality control from the NWS River Forecast Centers. Darker green/blue shades indicate greater precipitation amounts.
This map shows precipitation accumulations (in inches) for the past 30 days, according to the National Weather Service (NWS) National Water Prediction Service (NWPS). This product includes some manual quality control from the NWS River Forecast Centers. Darker green/blue shades indicate greater precipitation amounts.
This map shows precipitation accumulations (in inches) for the past 90 days, according to the National Weather Service (NWS) National Water Prediction Service (NWPS). This product includes some manual quality control from the NWS River Forecast Centers. Darker green/blue shades indicate greater precipitation amounts.
NWPS precipitation maps are updated daily on Drought.gov, with data valid through 7 a.m. Eastern that morning.
NWPS precipitation maps are updated daily on Drought.gov, with data valid through 7 a.m. Eastern that morning.
NWPS precipitation maps are updated daily on Drought.gov, with data valid through 7 a.m. Eastern that morning.
Drought is defined as the lack of precipitation over an extended period of time, usually for a season or more, that results in a water shortage. Changes in precipitation can substantially disrupt crops and livestock, influence the frequency and intensity of severe weather events, and affect the quality and quantity of water available for municipal and industrial use.
Learn MoreDrought is defined as the lack of precipitation over an extended period of time, usually for a season or more, that results in a water shortage. Changes in precipitation can substantially disrupt crops and livestock, influence the frequency and intensity of severe weather events, and affect the quality and quantity of water available for municipal and industrial use.
Learn MoreDrought is defined as the lack of precipitation over an extended period of time, usually for a season or more, that results in a water shortage. Changes in precipitation can substantially disrupt crops and livestock, influence the frequency and intensity of severe weather events, and affect the quality and quantity of water available for municipal and industrial use.
Learn MoreHow to
View the User's Guide to the National Water Prediction Service (NWPS).
On the interactive NWPS map, under “Precipitation Estimate”, users can choose to view estimates of past precipitation across the continental United States, Puerto Rico, and Alaska.
- Select the “Display estimated precipitation on hover” to enable the ability to see pop-up precipitation estimates for each grid cell.
- Temporal choices include Year, Month, and Day. Within the last 15 days, users can also select different time lengths ranging from 1-hour to the last 365 days.
- For each time frame, users can select the following products to display on the interactive map:
- Observed - This map integrates multi-sensor quantitative precipitation estimates (QPE) from the NWS River Forecast Centers. Multi-sensor QPEs are produced by integrating radar-based precipitation estimates, satellite-based precipitation estimates, and ground-based precipitation gauge data.
- Normal - This map shows normal precipitation as derived from 1981-2010 Parameter-elevation Relationships on Independent Slopes Model (PRISM) climate data created by Oregon State University.
- Departure from Normal - This map is generated by subtracting the PRISM normal precipitation value from the NWPS observed precipitation value for each grid cell.
- Percent of Normal - This map is generated by dividing the NWPS observed precipitation by the PRISM normal precipitation for each grid cell.
- Use the slider bar above the Rainfall Legend to adjust the opacity of all precipitation layers.
- Users can also adjust the basemap in the “Map” dropdown, add administrative boundaries, and view precipitation data alongside other NWPS datasets (e.g., river stage observations and forecasts).
Access
Access the NWPS Interactive Map Viewer:
Data Downloads:
Documentation
- NWPS Product Services Guide
- NWPS Data & Web Services Catalog
- NWPS API Flyer
- NWPS Fact Sheet
- Service Description Document (SDD)
- Assessment and Implications of NCEP Stage IV Quantitative Precipitation Estimates for Product Intercomparisons
- Enhancing Precipitation Estimation Capabilities at National Weather Service Field Offices Using Multi-Sensor Precipitation Data Mosaics