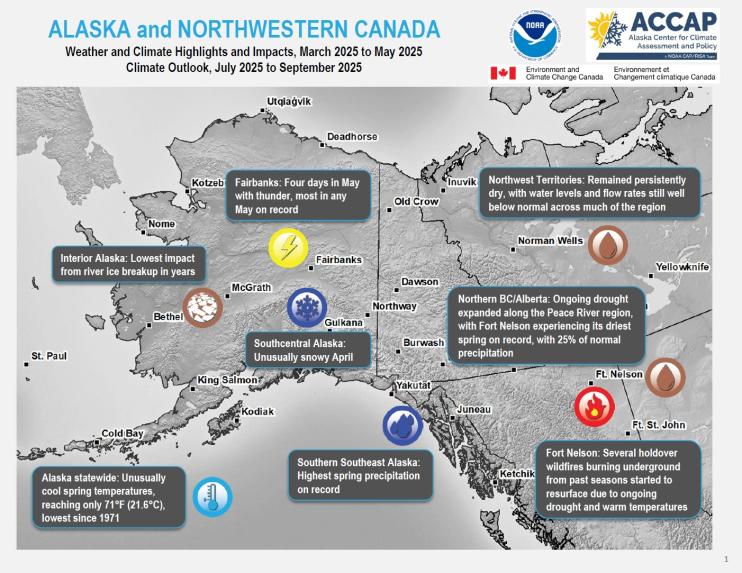
Quarterly Climate Impacts and Outlook for Alaska and Northwestern Canada for March–May 2025, with an outlook for July–September 2025. Dated June 2025.
ECCC, NOAA, and partners created these outlooks to inform the public about recent impacts within their respective regions. Each regional report contains easy-to-understand language, and anyone can access them through the U.S. Drought Portal.
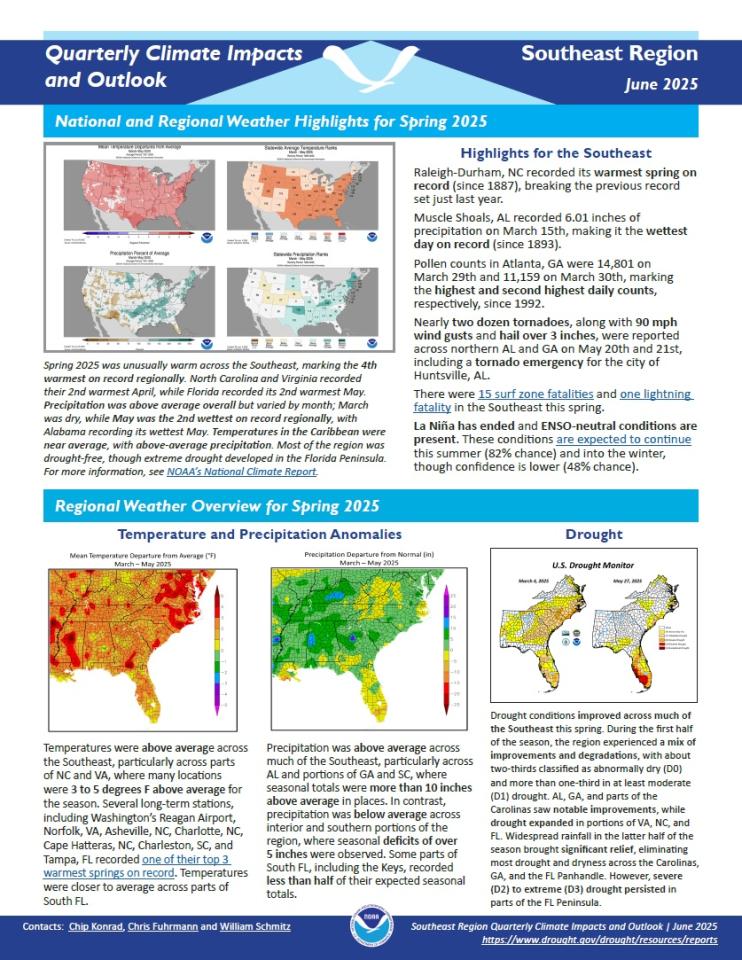
Quarterly Climate Impacts and Outlook for the Southeast and Caribbean Region for March–May 2025. Dated June 2025. (Updated to add Spanish translation of Caribbean information.)
Temperatures were above average across the Southeast, particularly across parts of North Carolina and Virginia, where many locations were 3–5°F above average for the season. Precipitation was above average across much of the Southeast, particularly across Alabama and portions of Georgia and South Carolina, where seasonal totals were more than 10 inches above average in places.
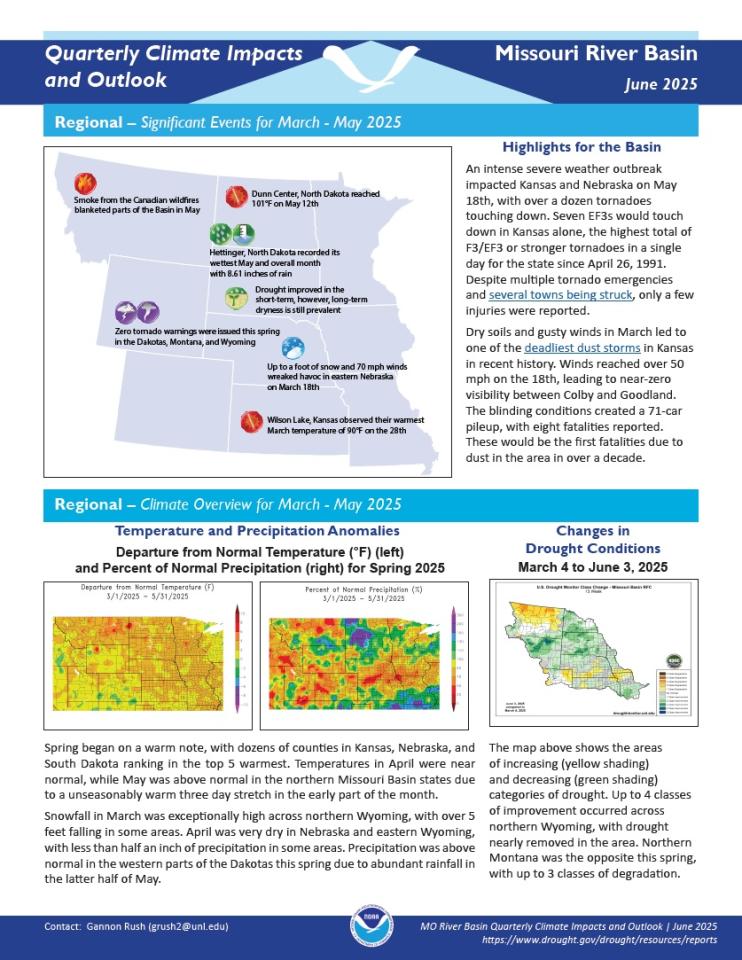
Quarterly Climate Impacts and Outlook for the Missouri River Basin for March–May 2025. Dated June 2025.
Spring began on a warm note, with dozens of counties in Kansas, Nebraska, and South Dakota ranking in the top 5 warmest. Precipitation was above normal in the western parts of the Dakotas this spring due to abundant rainfall in the latter half of May.
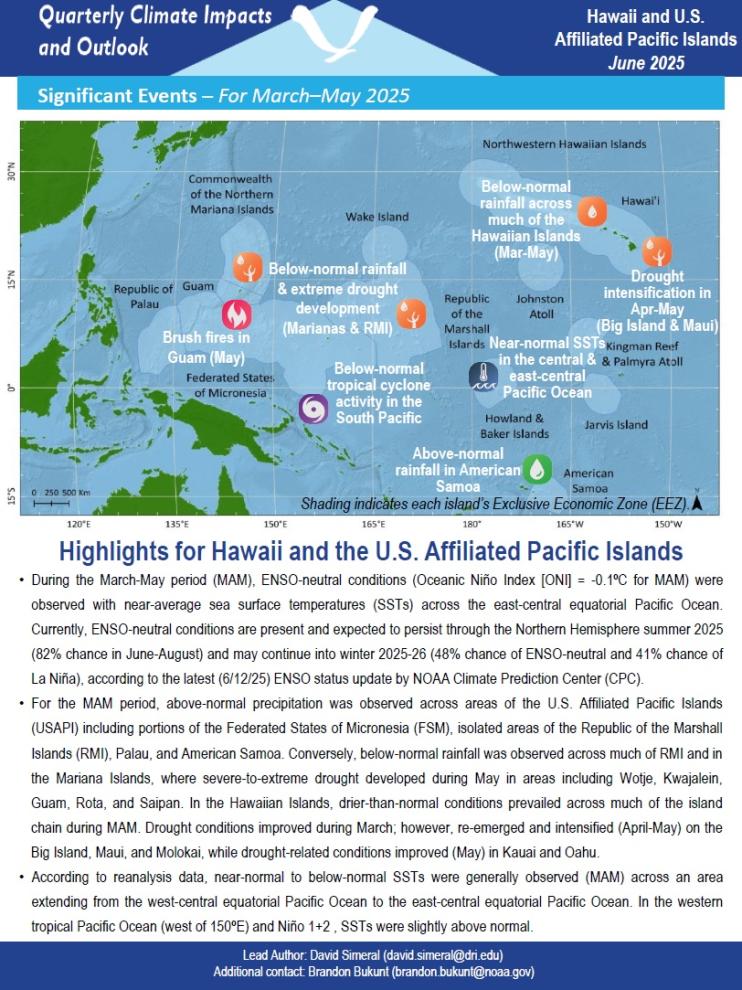
Quarterly Climate Impacts and Outlook for the Pacific Region for March–May 2025. Dated June 2025.
For the March-May period, above-normal precipitation was observed across areas of the U.S. Affiliated Pacific Islands (USAPI) including portions of the Federated States of Micronesia (FSM), isolated areas of the Republic of the Marshall Islands (RMI), Palau, and American Samoa. Conversely, below-normal rainfall was observed across much of RMI and in the Mariana Islands. In the Hawaiian Islands, drier-than-normal conditions prevailed across much of the island chain.
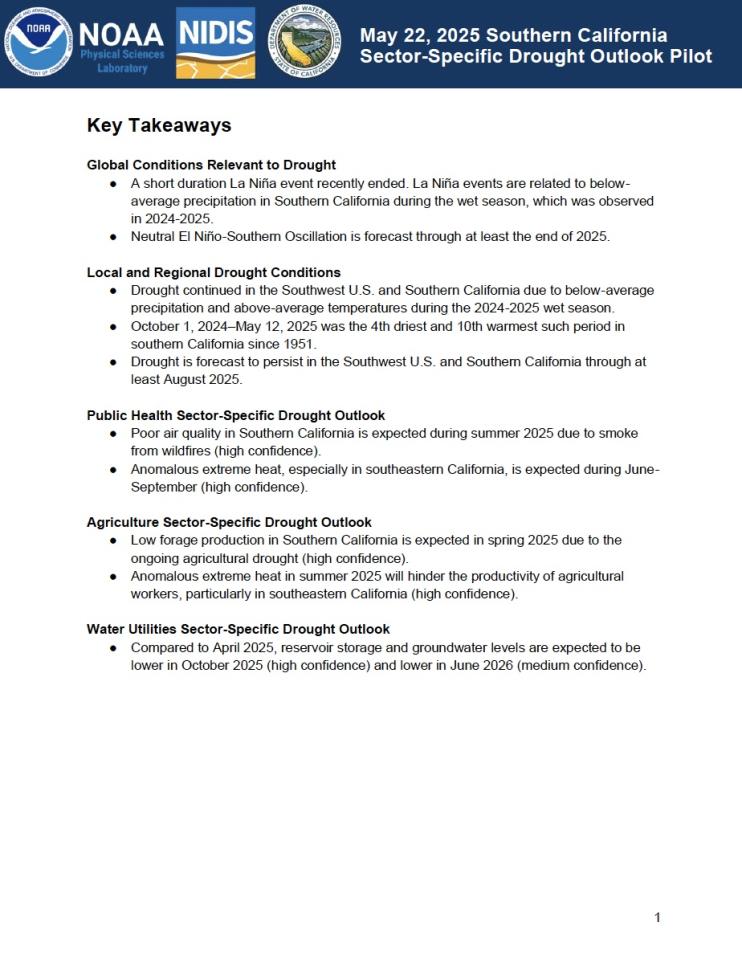
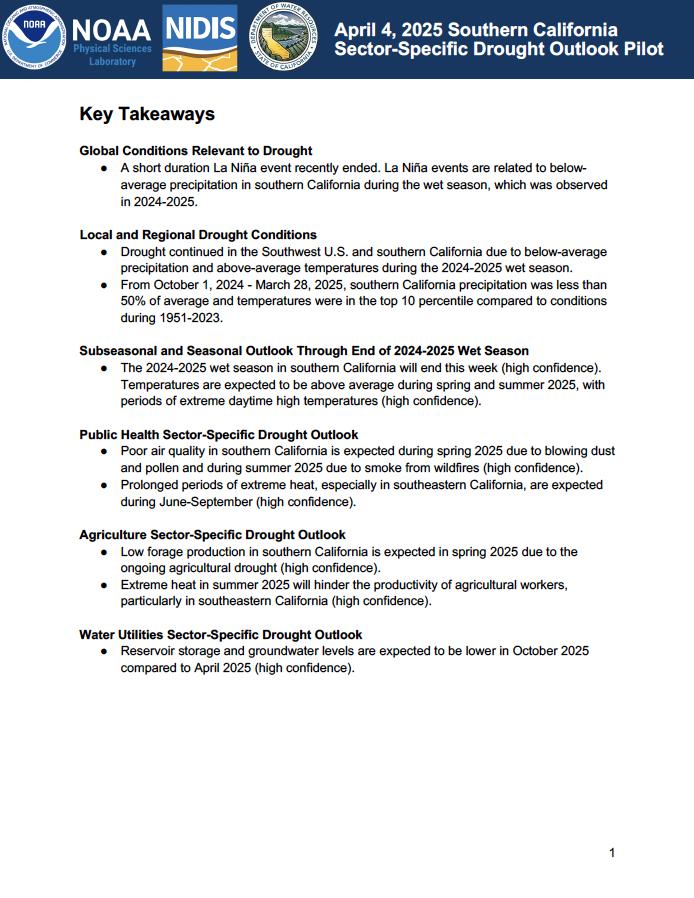
NOAA’s National Integrated Drought Information System (NIDIS) and Physical Sciences Laboratory are partnering with the California State Climatologist/California Department of Water Resources, NOAA’s National Weather Service and National Centers for Environmental Information, and the California-Nevada Adaptation Program (a NOAA CAP team) on the Sector-Specific Drought Early Warning Outlook – Southern California Pilot.
NOAA’s National Integrated Drought Information System (NIDIS) and Physical Sciences Laboratory are partnering with the California State Climatologist/California Department of Water Resources, NOAA’s National Weather Service and National Centers for Environmental Information, and the California-Nevada Adaptation Program (a NOAA CAP team) on the Sector-Specific Drought Early Warning Outlook – Southern California Pilot.
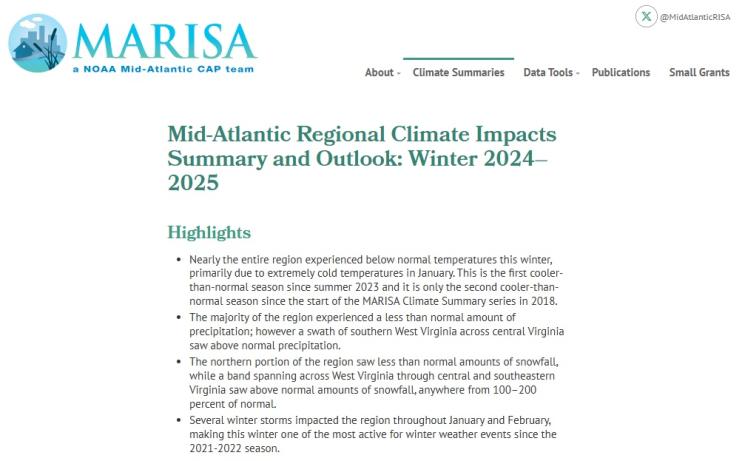
Quarterly Climate Impacts and Outlook for the Mid-Atlantic Region for December 2024–February 2025. Dated March 2025.
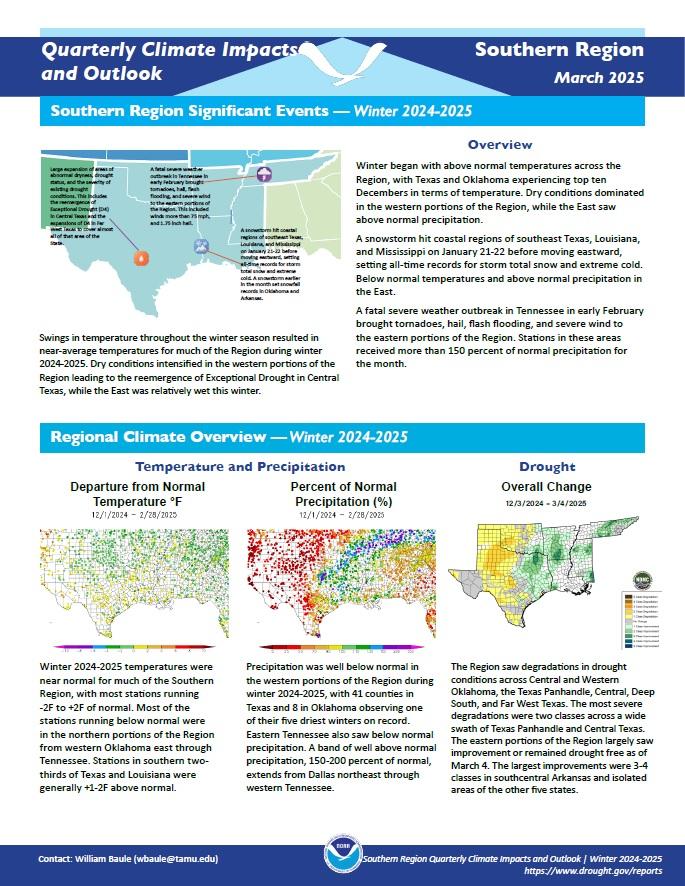
Quarterly Climate Impacts and Outlook for the Southern Region for December 2024–February 2025. Dated March 2025.
Winter 2024-2025 temperatures were near normal for much of the Southern Region, with most stations running 2°F below normal to 2°F above normal. Precipitation was well below normal in the western portions of the region, with 41 counties in Texas and 8 in Oklahoma observing one of their five driest winters on record.
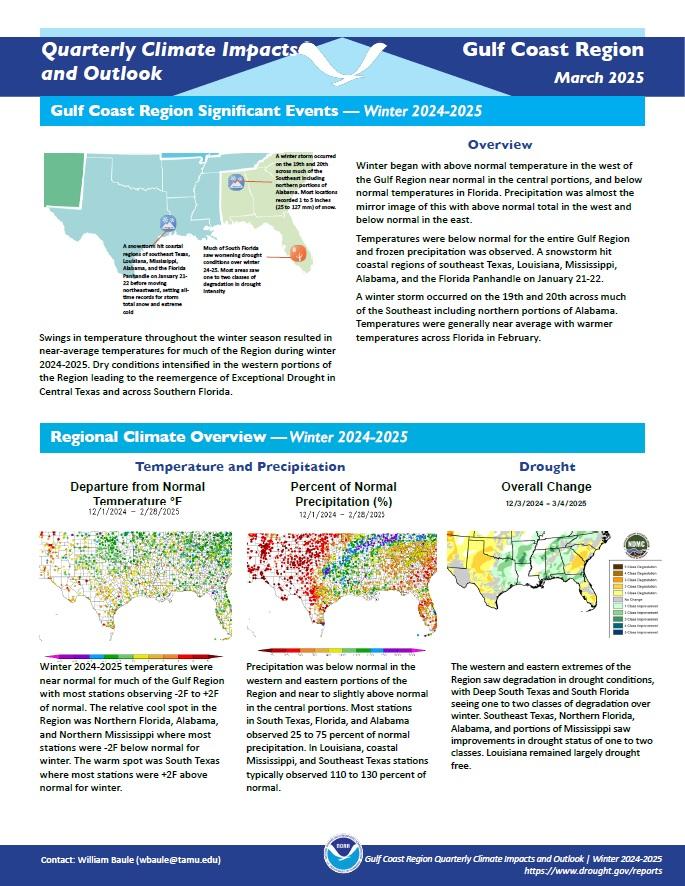
Quarterly Climate Impacts and Outlook for the Gulf Coast Region for December 2024–February 2025. Dated March 2025.
Winter 2024-2025 temperatures were near normal for much of the Gulf Region, with most stations observing temperatures 2°F below normal to 2°F above normal. Precipitation was below normal in the western and eastern portions of the region and near to slightly above normal in the central portions.
Quarterly Climate Impacts and Outlook for the Missouri River Basin for December 2024–February 2025. Dated March 2025.
Despite a warm start, temperatures this winter were mostly below normal. This winter was dry, with snowfall well below normal across much of the northern and central Plains.


