Warning: Undefined variable $index in Drupal\responsive_bg_image_formatter\Plugin\Field\FieldFormatter\ResponsiveBgImageFormatter->viewElements() (line 95 of modules/custom/responsive_bg_image_formatter/src/Plugin/Field/FieldFormatter/ResponsiveBgImageFormatter.php).
Drupal\responsive_bg_image_formatter\Plugin\Field\FieldFormatter\ResponsiveBgImageFormatter->viewElements(Object, 'en') (Line: 91) Drupal\Core\Field\FormatterBase->view(Object, 'en') (Line: 76) Drupal\Core\Field\Plugin\Field\FieldFormatter\EntityReferenceFormatterBase->view(Object, NULL) (Line: 268) Drupal\Core\Entity\Entity\EntityViewDisplay->buildMultiple(Array) (Line: 339) Drupal\Core\Entity\EntityViewBuilder->buildComponents(Array, Array, Array, 'full') (Line: 24) Drupal\node\NodeViewBuilder->buildComponents(Array, Array, Array, 'full') (Line: 281) Drupal\Core\Entity\EntityViewBuilder->buildMultiple(Array) (Line: 238) Drupal\Core\Entity\EntityViewBuilder->build(Array) call_user_func_array(Array, Array) (Line: 111) Drupal\Core\Render\Renderer->doTrustedCallback(Array, Array, 'Render #pre_render callbacks must be methods of a class that implements \Drupal\Core\Security\TrustedCallbackInterface or be an anonymous function. The callback was %s. See https://www.drupal.org/node/2966725', 'exception', 'Drupal\Core\Render\Element\RenderCallbackInterface') (Line: 859) Drupal\Core\Render\Renderer->doCallback('#pre_render', Array, Array) (Line: 421) Drupal\Core\Render\Renderer->doRender(Array, ) (Line: 240) Drupal\Core\Render\Renderer->render(Array, ) (Line: 238) Drupal\Core\Render\MainContent\HtmlRenderer->Drupal\Core\Render\MainContent\{closure}() (Line: 627) Drupal\Core\Render\Renderer->executeInRenderContext(Object, Object) (Line: 239) Drupal\Core\Render\MainContent\HtmlRenderer->prepare(Array, Object, Object) (Line: 128) Drupal\Core\Render\MainContent\HtmlRenderer->renderResponse(Array, Object, Object) (Line: 90) Drupal\Core\EventSubscriber\MainContentViewSubscriber->onViewRenderArray(Object, 'kernel.view', Object) call_user_func(Array, Object, 'kernel.view', Object) (Line: 111) Drupal\Component\EventDispatcher\ContainerAwareEventDispatcher->dispatch(Object, 'kernel.view') (Line: 186) Symfony\Component\HttpKernel\HttpKernel->handleRaw(Object, 1) (Line: 76) Symfony\Component\HttpKernel\HttpKernel->handle(Object, 1, 1) (Line: 58) Drupal\Core\StackMiddleware\Session->handle(Object, 1, 1) (Line: 48) Drupal\Core\StackMiddleware\KernelPreHandle->handle(Object, 1, 1) (Line: 28) Drupal\Core\StackMiddleware\ContentLength->handle(Object, 1, 1) (Line: 32) Drupal\big_pipe\StackMiddleware\ContentLength->handle(Object, 1, 1) (Line: 191) Drupal\page_cache\StackMiddleware\PageCache->fetch(Object, 1, 1) (Line: 128) Drupal\page_cache\StackMiddleware\PageCache->lookup(Object, 1, 1) (Line: 82) Drupal\page_cache\StackMiddleware\PageCache->handle(Object, 1, 1) (Line: 48) Drupal\Core\StackMiddleware\ReverseProxyMiddleware->handle(Object, 1, 1) (Line: 51) Drupal\Core\StackMiddleware\NegotiationMiddleware->handle(Object, 1, 1) (Line: 36) Drupal\Core\StackMiddleware\AjaxPageState->handle(Object, 1, 1) (Line: 51) Drupal\Core\StackMiddleware\StackedHttpKernel->handle(Object, 1, 1) (Line: 704) Drupal\Core\DrupalKernel->handle(Object) (Line: 19)Warning: Undefined array key "width" in template_preprocess_responsive_image() (line 209 of core/modules/responsive_image/responsive_image.module).
template_preprocess_responsive_image(Array) (Line: 101) Drupal\responsive_bg_image_formatter\Plugin\Field\FieldFormatter\ResponsiveBgImageFormatter->viewElements(Object, 'en') (Line: 91) Drupal\Core\Field\FormatterBase->view(Object, 'en') (Line: 76) Drupal\Core\Field\Plugin\Field\FieldFormatter\EntityReferenceFormatterBase->view(Object, NULL) (Line: 268) Drupal\Core\Entity\Entity\EntityViewDisplay->buildMultiple(Array) (Line: 339) Drupal\Core\Entity\EntityViewBuilder->buildComponents(Array, Array, Array, 'full') (Line: 24) Drupal\node\NodeViewBuilder->buildComponents(Array, Array, Array, 'full') (Line: 281) Drupal\Core\Entity\EntityViewBuilder->buildMultiple(Array) (Line: 238) Drupal\Core\Entity\EntityViewBuilder->build(Array) call_user_func_array(Array, Array) (Line: 111) Drupal\Core\Render\Renderer->doTrustedCallback(Array, Array, 'Render #pre_render callbacks must be methods of a class that implements \Drupal\Core\Security\TrustedCallbackInterface or be an anonymous function. The callback was %s. See https://www.drupal.org/node/2966725', 'exception', 'Drupal\Core\Render\Element\RenderCallbackInterface') (Line: 859) Drupal\Core\Render\Renderer->doCallback('#pre_render', Array, Array) (Line: 421) Drupal\Core\Render\Renderer->doRender(Array, ) (Line: 240) Drupal\Core\Render\Renderer->render(Array, ) (Line: 238) Drupal\Core\Render\MainContent\HtmlRenderer->Drupal\Core\Render\MainContent\{closure}() (Line: 627) Drupal\Core\Render\Renderer->executeInRenderContext(Object, Object) (Line: 239) Drupal\Core\Render\MainContent\HtmlRenderer->prepare(Array, Object, Object) (Line: 128) Drupal\Core\Render\MainContent\HtmlRenderer->renderResponse(Array, Object, Object) (Line: 90) Drupal\Core\EventSubscriber\MainContentViewSubscriber->onViewRenderArray(Object, 'kernel.view', Object) call_user_func(Array, Object, 'kernel.view', Object) (Line: 111) Drupal\Component\EventDispatcher\ContainerAwareEventDispatcher->dispatch(Object, 'kernel.view') (Line: 186) Symfony\Component\HttpKernel\HttpKernel->handleRaw(Object, 1) (Line: 76) Symfony\Component\HttpKernel\HttpKernel->handle(Object, 1, 1) (Line: 58) Drupal\Core\StackMiddleware\Session->handle(Object, 1, 1) (Line: 48) Drupal\Core\StackMiddleware\KernelPreHandle->handle(Object, 1, 1) (Line: 28) Drupal\Core\StackMiddleware\ContentLength->handle(Object, 1, 1) (Line: 32) Drupal\big_pipe\StackMiddleware\ContentLength->handle(Object, 1, 1) (Line: 191) Drupal\page_cache\StackMiddleware\PageCache->fetch(Object, 1, 1) (Line: 128) Drupal\page_cache\StackMiddleware\PageCache->lookup(Object, 1, 1) (Line: 82) Drupal\page_cache\StackMiddleware\PageCache->handle(Object, 1, 1) (Line: 48) Drupal\Core\StackMiddleware\ReverseProxyMiddleware->handle(Object, 1, 1) (Line: 51) Drupal\Core\StackMiddleware\NegotiationMiddleware->handle(Object, 1, 1) (Line: 36) Drupal\Core\StackMiddleware\AjaxPageState->handle(Object, 1, 1) (Line: 51) Drupal\Core\StackMiddleware\StackedHttpKernel->handle(Object, 1, 1) (Line: 704) Drupal\Core\DrupalKernel->handle(Object) (Line: 19)Warning: Undefined array key "height" in template_preprocess_responsive_image() (line 210 of core/modules/responsive_image/responsive_image.module).
template_preprocess_responsive_image(Array) (Line: 101) Drupal\responsive_bg_image_formatter\Plugin\Field\FieldFormatter\ResponsiveBgImageFormatter->viewElements(Object, 'en') (Line: 91) Drupal\Core\Field\FormatterBase->view(Object, 'en') (Line: 76) Drupal\Core\Field\Plugin\Field\FieldFormatter\EntityReferenceFormatterBase->view(Object, NULL) (Line: 268) Drupal\Core\Entity\Entity\EntityViewDisplay->buildMultiple(Array) (Line: 339) Drupal\Core\Entity\EntityViewBuilder->buildComponents(Array, Array, Array, 'full') (Line: 24) Drupal\node\NodeViewBuilder->buildComponents(Array, Array, Array, 'full') (Line: 281) Drupal\Core\Entity\EntityViewBuilder->buildMultiple(Array) (Line: 238) Drupal\Core\Entity\EntityViewBuilder->build(Array) call_user_func_array(Array, Array) (Line: 111) Drupal\Core\Render\Renderer->doTrustedCallback(Array, Array, 'Render #pre_render callbacks must be methods of a class that implements \Drupal\Core\Security\TrustedCallbackInterface or be an anonymous function. The callback was %s. See https://www.drupal.org/node/2966725', 'exception', 'Drupal\Core\Render\Element\RenderCallbackInterface') (Line: 859) Drupal\Core\Render\Renderer->doCallback('#pre_render', Array, Array) (Line: 421) Drupal\Core\Render\Renderer->doRender(Array, ) (Line: 240) Drupal\Core\Render\Renderer->render(Array, ) (Line: 238) Drupal\Core\Render\MainContent\HtmlRenderer->Drupal\Core\Render\MainContent\{closure}() (Line: 627) Drupal\Core\Render\Renderer->executeInRenderContext(Object, Object) (Line: 239) Drupal\Core\Render\MainContent\HtmlRenderer->prepare(Array, Object, Object) (Line: 128) Drupal\Core\Render\MainContent\HtmlRenderer->renderResponse(Array, Object, Object) (Line: 90) Drupal\Core\EventSubscriber\MainContentViewSubscriber->onViewRenderArray(Object, 'kernel.view', Object) call_user_func(Array, Object, 'kernel.view', Object) (Line: 111) Drupal\Component\EventDispatcher\ContainerAwareEventDispatcher->dispatch(Object, 'kernel.view') (Line: 186) Symfony\Component\HttpKernel\HttpKernel->handleRaw(Object, 1) (Line: 76) Symfony\Component\HttpKernel\HttpKernel->handle(Object, 1, 1) (Line: 58) Drupal\Core\StackMiddleware\Session->handle(Object, 1, 1) (Line: 48) Drupal\Core\StackMiddleware\KernelPreHandle->handle(Object, 1, 1) (Line: 28) Drupal\Core\StackMiddleware\ContentLength->handle(Object, 1, 1) (Line: 32) Drupal\big_pipe\StackMiddleware\ContentLength->handle(Object, 1, 1) (Line: 191) Drupal\page_cache\StackMiddleware\PageCache->fetch(Object, 1, 1) (Line: 128) Drupal\page_cache\StackMiddleware\PageCache->lookup(Object, 1, 1) (Line: 82) Drupal\page_cache\StackMiddleware\PageCache->handle(Object, 1, 1) (Line: 48) Drupal\Core\StackMiddleware\ReverseProxyMiddleware->handle(Object, 1, 1) (Line: 51) Drupal\Core\StackMiddleware\NegotiationMiddleware->handle(Object, 1, 1) (Line: 36) Drupal\Core\StackMiddleware\AjaxPageState->handle(Object, 1, 1) (Line: 51) Drupal\Core\StackMiddleware\StackedHttpKernel->handle(Object, 1, 1) (Line: 704) Drupal\Core\DrupalKernel->handle(Object) (Line: 19)Warning: Undefined array key "media" in Drupal\responsive_bg_image_formatter\Plugin\Field\FieldFormatter\ResponsiveBgImageFormatter->viewElements() (line 112 of modules/custom/responsive_bg_image_formatter/src/Plugin/Field/FieldFormatter/ResponsiveBgImageFormatter.php).
Drupal\responsive_bg_image_formatter\Plugin\Field\FieldFormatter\ResponsiveBgImageFormatter->viewElements(Object, 'en') (Line: 91)
Drupal\Core\Field\FormatterBase->view(Object, 'en') (Line: 76)
Drupal\Core\Field\Plugin\Field\FieldFormatter\EntityReferenceFormatterBase->view(Object, NULL) (Line: 268)
Drupal\Core\Entity\Entity\EntityViewDisplay->buildMultiple(Array) (Line: 339)
Drupal\Core\Entity\EntityViewBuilder->buildComponents(Array, Array, Array, 'full') (Line: 24)
Drupal\node\NodeViewBuilder->buildComponents(Array, Array, Array, 'full') (Line: 281)
Drupal\Core\Entity\EntityViewBuilder->buildMultiple(Array) (Line: 238)
Drupal\Core\Entity\EntityViewBuilder->build(Array)
call_user_func_array(Array, Array) (Line: 111)
Drupal\Core\Render\Renderer->doTrustedCallback(Array, Array, 'Render #pre_render callbacks must be methods of a class that implements \Drupal\Core\Security\TrustedCallbackInterface or be an anonymous function. The callback was %s. See https://www.drupal.org/node/2966725', 'exception', 'Drupal\Core\Render\Element\RenderCallbackInterface') (Line: 859)
Drupal\Core\Render\Renderer->doCallback('#pre_render', Array, Array) (Line: 421)
Drupal\Core\Render\Renderer->doRender(Array, ) (Line: 240)
Drupal\Core\Render\Renderer->render(Array, ) (Line: 238)
Drupal\Core\Render\MainContent\HtmlRenderer->Drupal\Core\Render\MainContent\{closure}() (Line: 627)
Drupal\Core\Render\Renderer->executeInRenderContext(Object, Object) (Line: 239)
Drupal\Core\Render\MainContent\HtmlRenderer->prepare(Array, Object, Object) (Line: 128)
Drupal\Core\Render\MainContent\HtmlRenderer->renderResponse(Array, Object, Object) (Line: 90)
Drupal\Core\EventSubscriber\MainContentViewSubscriber->onViewRenderArray(Object, 'kernel.view', Object)
call_user_func(Array, Object, 'kernel.view', Object) (Line: 111)
Drupal\Component\EventDispatcher\ContainerAwareEventDispatcher->dispatch(Object, 'kernel.view') (Line: 186)
Symfony\Component\HttpKernel\HttpKernel->handleRaw(Object, 1) (Line: 76)
Symfony\Component\HttpKernel\HttpKernel->handle(Object, 1, 1) (Line: 58)
Drupal\Core\StackMiddleware\Session->handle(Object, 1, 1) (Line: 48)
Drupal\Core\StackMiddleware\KernelPreHandle->handle(Object, 1, 1) (Line: 28)
Drupal\Core\StackMiddleware\ContentLength->handle(Object, 1, 1) (Line: 32)
Drupal\big_pipe\StackMiddleware\ContentLength->handle(Object, 1, 1) (Line: 191)
Drupal\page_cache\StackMiddleware\PageCache->fetch(Object, 1, 1) (Line: 128)
Drupal\page_cache\StackMiddleware\PageCache->lookup(Object, 1, 1) (Line: 82)
Drupal\page_cache\StackMiddleware\PageCache->handle(Object, 1, 1) (Line: 48)
Drupal\Core\StackMiddleware\ReverseProxyMiddleware->handle(Object, 1, 1) (Line: 51)
Drupal\Core\StackMiddleware\NegotiationMiddleware->handle(Object, 1, 1) (Line: 36)
Drupal\Core\StackMiddleware\AjaxPageState->handle(Object, 1, 1) (Line: 51)
Drupal\Core\StackMiddleware\StackedHttpKernel->handle(Object, 1, 1) (Line: 704)
Drupal\Core\DrupalKernel->handle(Object) (Line: 19)
Deprecated function: str_replace(): Passing null to parameter #3 ($subject) of type array|string is deprecated in Drupal\responsive_bg_image_formatter\Plugin\Field\FieldFormatter\ResponsiveBgImageFormatter->viewElements() (line 126 of modules/custom/responsive_bg_image_formatter/src/Plugin/Field/FieldFormatter/ResponsiveBgImageFormatter.php).
Drupal\responsive_bg_image_formatter\Plugin\Field\FieldFormatter\ResponsiveBgImageFormatter->viewElements(Object, 'en') (Line: 91) Drupal\Core\Field\FormatterBase->view(Object, 'en') (Line: 76) Drupal\Core\Field\Plugin\Field\FieldFormatter\EntityReferenceFormatterBase->view(Object, NULL) (Line: 268) Drupal\Core\Entity\Entity\EntityViewDisplay->buildMultiple(Array) (Line: 339) Drupal\Core\Entity\EntityViewBuilder->buildComponents(Array, Array, Array, 'full') (Line: 24) Drupal\node\NodeViewBuilder->buildComponents(Array, Array, Array, 'full') (Line: 281) Drupal\Core\Entity\EntityViewBuilder->buildMultiple(Array) (Line: 238) Drupal\Core\Entity\EntityViewBuilder->build(Array) call_user_func_array(Array, Array) (Line: 111) Drupal\Core\Render\Renderer->doTrustedCallback(Array, Array, 'Render #pre_render callbacks must be methods of a class that implements \Drupal\Core\Security\TrustedCallbackInterface or be an anonymous function. The callback was %s. See https://www.drupal.org/node/2966725', 'exception', 'Drupal\Core\Render\Element\RenderCallbackInterface') (Line: 859) Drupal\Core\Render\Renderer->doCallback('#pre_render', Array, Array) (Line: 421) Drupal\Core\Render\Renderer->doRender(Array, ) (Line: 240) Drupal\Core\Render\Renderer->render(Array, ) (Line: 238) Drupal\Core\Render\MainContent\HtmlRenderer->Drupal\Core\Render\MainContent\{closure}() (Line: 627) Drupal\Core\Render\Renderer->executeInRenderContext(Object, Object) (Line: 239) Drupal\Core\Render\MainContent\HtmlRenderer->prepare(Array, Object, Object) (Line: 128) Drupal\Core\Render\MainContent\HtmlRenderer->renderResponse(Array, Object, Object) (Line: 90) Drupal\Core\EventSubscriber\MainContentViewSubscriber->onViewRenderArray(Object, 'kernel.view', Object) call_user_func(Array, Object, 'kernel.view', Object) (Line: 111) Drupal\Component\EventDispatcher\ContainerAwareEventDispatcher->dispatch(Object, 'kernel.view') (Line: 186) Symfony\Component\HttpKernel\HttpKernel->handleRaw(Object, 1) (Line: 76) Symfony\Component\HttpKernel\HttpKernel->handle(Object, 1, 1) (Line: 58) Drupal\Core\StackMiddleware\Session->handle(Object, 1, 1) (Line: 48) Drupal\Core\StackMiddleware\KernelPreHandle->handle(Object, 1, 1) (Line: 28) Drupal\Core\StackMiddleware\ContentLength->handle(Object, 1, 1) (Line: 32) Drupal\big_pipe\StackMiddleware\ContentLength->handle(Object, 1, 1) (Line: 191) Drupal\page_cache\StackMiddleware\PageCache->fetch(Object, 1, 1) (Line: 128) Drupal\page_cache\StackMiddleware\PageCache->lookup(Object, 1, 1) (Line: 82) Drupal\page_cache\StackMiddleware\PageCache->handle(Object, 1, 1) (Line: 48) Drupal\Core\StackMiddleware\ReverseProxyMiddleware->handle(Object, 1, 1) (Line: 51) Drupal\Core\StackMiddleware\NegotiationMiddleware->handle(Object, 1, 1) (Line: 36) Drupal\Core\StackMiddleware\AjaxPageState->handle(Object, 1, 1) (Line: 51) Drupal\Core\StackMiddleware\StackedHttpKernel->handle(Object, 1, 1) (Line: 704) Drupal\Core\DrupalKernel->handle(Object) (Line: 19)Warning: Undefined variable $index in Drupal\responsive_bg_image_formatter\Plugin\Field\FieldFormatter\ResponsiveBgImageFormatter->viewElements() (line 153 of modules/custom/responsive_bg_image_formatter/src/Plugin/Field/FieldFormatter/ResponsiveBgImageFormatter.php).
Drupal\responsive_bg_image_formatter\Plugin\Field\FieldFormatter\ResponsiveBgImageFormatter->viewElements(Object, 'en') (Line: 91)
Drupal\Core\Field\FormatterBase->view(Object, 'en') (Line: 76)
Drupal\Core\Field\Plugin\Field\FieldFormatter\EntityReferenceFormatterBase->view(Object, NULL) (Line: 268)
Drupal\Core\Entity\Entity\EntityViewDisplay->buildMultiple(Array) (Line: 339)
Drupal\Core\Entity\EntityViewBuilder->buildComponents(Array, Array, Array, 'full') (Line: 24)
Drupal\node\NodeViewBuilder->buildComponents(Array, Array, Array, 'full') (Line: 281)
Drupal\Core\Entity\EntityViewBuilder->buildMultiple(Array) (Line: 238)
Drupal\Core\Entity\EntityViewBuilder->build(Array)
call_user_func_array(Array, Array) (Line: 111)
Drupal\Core\Render\Renderer->doTrustedCallback(Array, Array, 'Render #pre_render callbacks must be methods of a class that implements \Drupal\Core\Security\TrustedCallbackInterface or be an anonymous function. The callback was %s. See https://www.drupal.org/node/2966725', 'exception', 'Drupal\Core\Render\Element\RenderCallbackInterface') (Line: 859)
Drupal\Core\Render\Renderer->doCallback('#pre_render', Array, Array) (Line: 421)
Drupal\Core\Render\Renderer->doRender(Array, ) (Line: 240)
Drupal\Core\Render\Renderer->render(Array, ) (Line: 238)
Drupal\Core\Render\MainContent\HtmlRenderer->Drupal\Core\Render\MainContent\{closure}() (Line: 627)
Drupal\Core\Render\Renderer->executeInRenderContext(Object, Object) (Line: 239)
Drupal\Core\Render\MainContent\HtmlRenderer->prepare(Array, Object, Object) (Line: 128)
Drupal\Core\Render\MainContent\HtmlRenderer->renderResponse(Array, Object, Object) (Line: 90)
Drupal\Core\EventSubscriber\MainContentViewSubscriber->onViewRenderArray(Object, 'kernel.view', Object)
call_user_func(Array, Object, 'kernel.view', Object) (Line: 111)
Drupal\Component\EventDispatcher\ContainerAwareEventDispatcher->dispatch(Object, 'kernel.view') (Line: 186)
Symfony\Component\HttpKernel\HttpKernel->handleRaw(Object, 1) (Line: 76)
Symfony\Component\HttpKernel\HttpKernel->handle(Object, 1, 1) (Line: 58)
Drupal\Core\StackMiddleware\Session->handle(Object, 1, 1) (Line: 48)
Drupal\Core\StackMiddleware\KernelPreHandle->handle(Object, 1, 1) (Line: 28)
Drupal\Core\StackMiddleware\ContentLength->handle(Object, 1, 1) (Line: 32)
Drupal\big_pipe\StackMiddleware\ContentLength->handle(Object, 1, 1) (Line: 191)
Drupal\page_cache\StackMiddleware\PageCache->fetch(Object, 1, 1) (Line: 128)
Drupal\page_cache\StackMiddleware\PageCache->lookup(Object, 1, 1) (Line: 82)
Drupal\page_cache\StackMiddleware\PageCache->handle(Object, 1, 1) (Line: 48)
Drupal\Core\StackMiddleware\ReverseProxyMiddleware->handle(Object, 1, 1) (Line: 51)
Drupal\Core\StackMiddleware\NegotiationMiddleware->handle(Object, 1, 1) (Line: 36)
Drupal\Core\StackMiddleware\AjaxPageState->handle(Object, 1, 1) (Line: 51)
Drupal\Core\StackMiddleware\StackedHttpKernel->handle(Object, 1, 1) (Line: 704)
Drupal\Core\DrupalKernel->handle(Object) (Line: 19)
A Lackluster January: Snow Totals Near Normal for This Time of Year
Key Points
- Moderate to extreme drought persists. Overall drought conditions showed little change across the Intermountain West in January.
- A lackluster January returned snow totals to near normal for this time of the season.
- La Niña is still in place and is a strong influence on precipitation patterns for the coming season.
Current U.S. Drought Monitor map for the Intermountain West Drought Early Warning System region with data valid for February 1, 2022. The U.S. Drought Monitor is updated each Thursday to show the location and intensity of drought across the country.
U.S. Drought Monitor Categories
Current U.S. Drought Monitor map for the Intermountain West Drought Early Warning System region with data valid for February 1, 2022. The U.S. Drought Monitor is updated each Thursday to show the location and intensity of drought across the country.
Current Drought Conditions and Outlook
U.S. Drought Monitor Conditions
- Overall, drought is improving across the Intermountain West.
- Exceptional (D4) drought returned to the region in northeastern New Mexico.
- 16% of the region is still experiencing extreme (D3) drought.
- Extreme (D3) drought conditions have been in place in this region since May 2020.
- Moderate (D1) or worse drought has been in the region since August 2009.
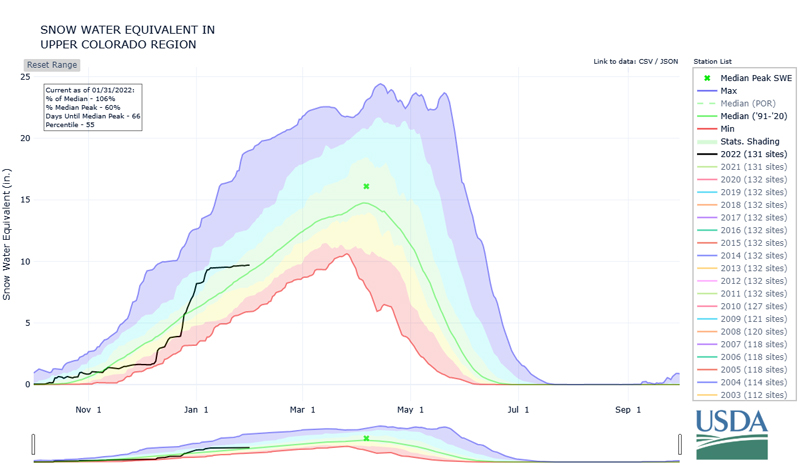
Current Snow Water Equivalent
- A snowy December was followed by a lackluster January.
- Autumn 2021 ended with a warm and dry November for much of the West, leaving little snowpack in the mountains to start the climatological winter in December.
Snow Water Equivalent: Upper Colorado
1-Month Change in Snow Water Equivalent: January 1–30, 2022

Forecasts and Seasonal Outlooks
3-Month Outlook for Winter (February–April 2022)
- Odds favor above-normal temperatures for the southern U.S., including New Mexico and parts of Arizona, Colorado, and Utah.
- Odds favor below-normal precipitation for the southwest U.S., including southern Utah and southern Colorado.
February–April Temperature Outlook
February–April Precipitation Outlook
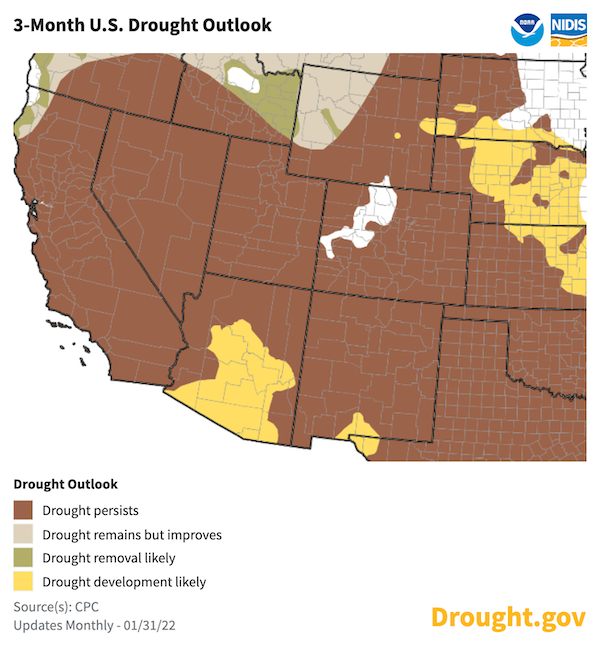
Seasonal Drought Outlook
- Drought is expected to continue for the Intermountain West through spring.
- The Climate Prediction Center's 3-month drought outlook shows drought is likely to remain but improve for western Wyoming.
U.S. Drought Outlook: February–April 2022
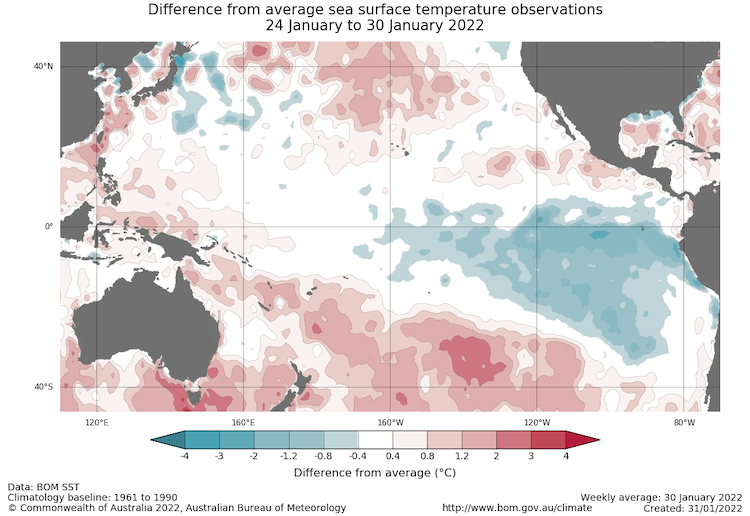
La Niña to Continue Through Spring
- One of the primary drivers of drought across the Southwest this season was a La Niña pattern in the Pacific.
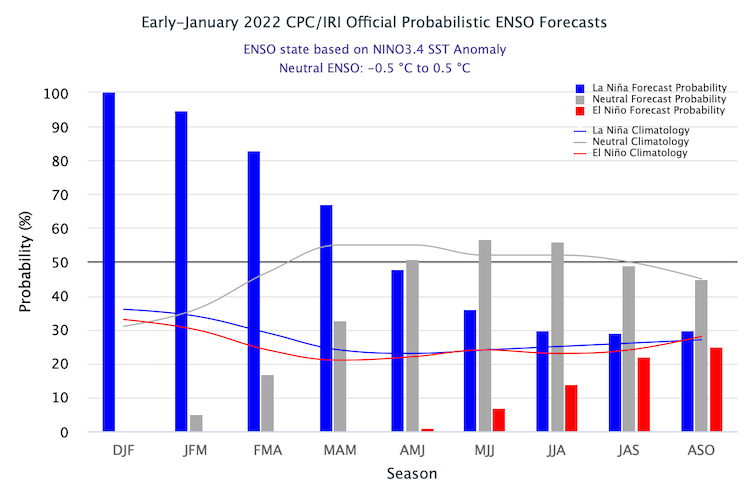
- Current forecasts suggest La Niña will continue through spring.
- Spring precipitation across the Intermountain West is usually lower than normal in the seasons when La Niña is winding down.
- For more information, please check out the NOAA El Niño-Southern Oscillation (ENSO) blog and the Western Regional Climate Center information page about the La Niña impacts for the West.
Sea Surface Temperature Anomalies (°C) for January 24–30, 2022
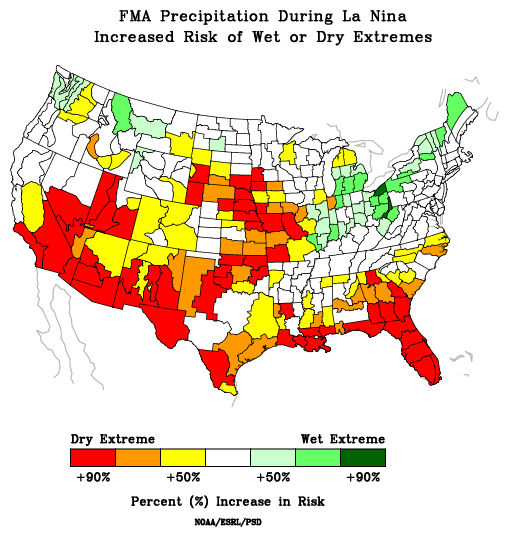
Risk of Wet/Dry Extremes in February–April During La Niña
Probability of El Niño, La Niña, or Neutral Conditions
State-Based Conditions and Impacts
Arizona
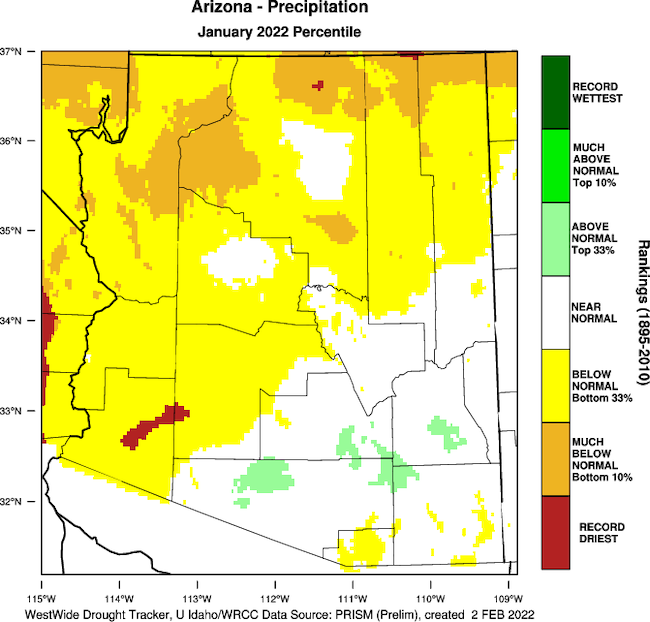
- There was very little change in short-term drought in January, while long-term exceptional drought (D4) persisted in northeastern Arizona.
- The majority of the state received below-average precipitation for January:
- Most January precipitation occurred on January 1.
- Two other systems later in the month brought minimal precipitation.
- Southeastern Arizona received near-normal precipitation in January.
- Arizona’s snowpack:
- The Verde River basin ended January at 102% of snow water equivalent.
- The Salt River basin had 72% of snow water equivalent.
- Colorado Basin River Forecast Center water supply forecasts do not expect improvement this season.
Arizona Percent of Normal Precipitation: January 2022
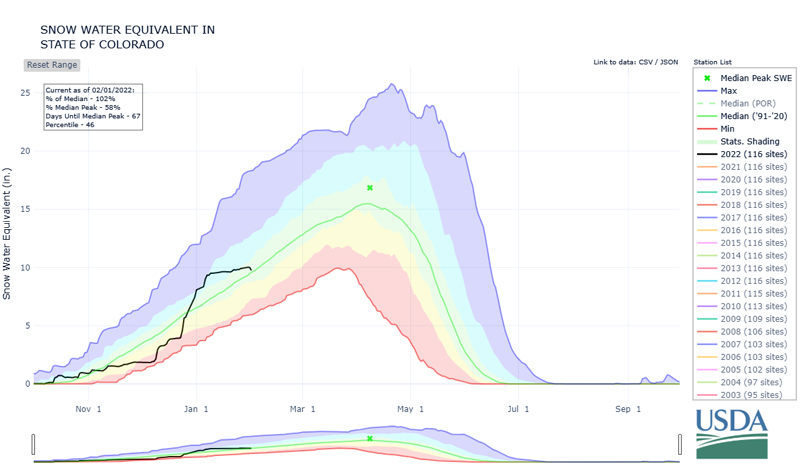
Colorado
- Weather patterns shifted to favor warm, dry weather west of the Continental Divide, but cold weather with moderate snowfall in eastern Colorado.
- Statewide snowpack regressed from 130% of median on January 9 to 105% of median on January 30.
- Following the Marshall Fire event, drought conditions have improved for Colorado’s urban corridor.
- Boulder received 200% of normal snowfall, and Denver received 170% of normal snowfall in January.
- Longer-term dryness remains a concern as Denver is still record dry from August 1–February 1.
- The forecast for the first two weeks of February is cold and wintry conditions with below-normal temperatures. Snowpack is likely to improve in the state’s two major river basins that are currently below average: the Upper Rio Grande and Arkansas River basins. However, the west slopes will continue to be drier than normal, lowering spring runoff projections.
- The latest Colorado Basin River Forecast Center runoff projections for western Colorado are for 70%–100% of normal April–July runoff in southwest Colorado and 90%–110% of normal runoff in northwest Colorado.
Colorado Statewide Snow Water Equivalent (Inches)
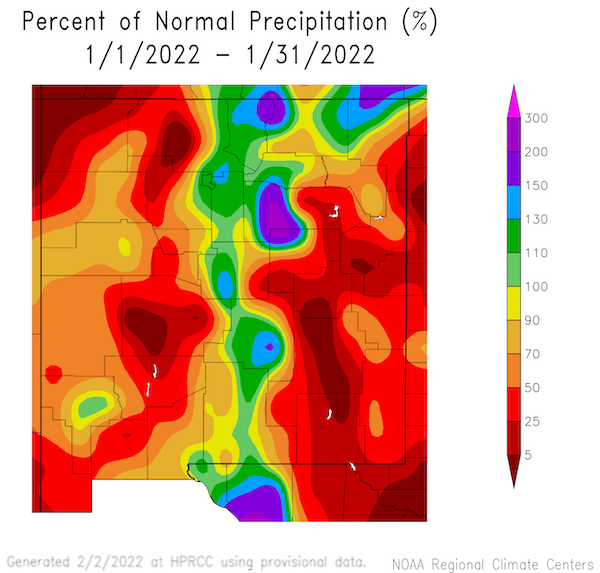
New Mexico
- January is usually one of the drier months of the year.
- January precipitation was very much below average for eastern New Mexico and in the Four Corners region, and a little below average across western New Mexico.
- Eastern New Mexico has been in an extremely dry pattern since July.
January 2022 Percent of Normal Precipitation
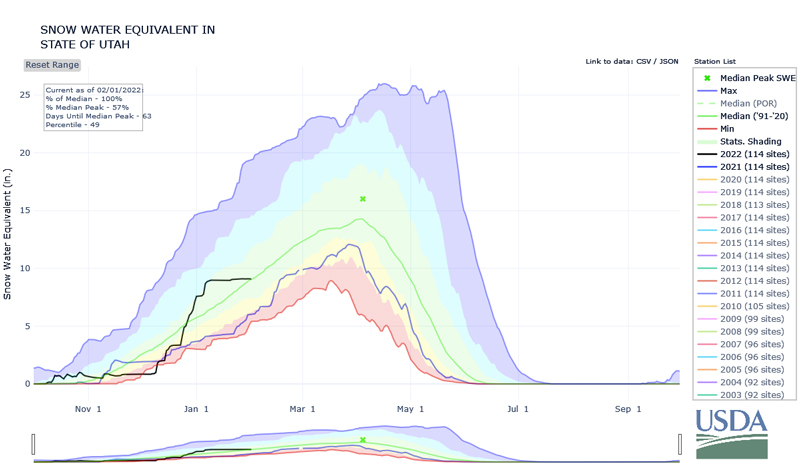
Utah
- Utah snowpack flatlined in January, trending down significantly from New Year’s highs.
- As of February 1, statewide snow water equivalent (SWE) is at:
- 100% of normal for this time of year
- 49% of median peak value.
- The extended forecast remains dry for the region.
- The first half of February is anticipated to continue the recent downward trend.
- Statewide, an increasing number of individual basins are expected to dip below 100% of normal snow water values within the first two weeks of February.
- Soil moisture:
- Elevated levels across the state anchor optimism for a beneficial spring runoff.
- Revised projections accounting for a lack of January snowfall will see a drop in the forecast water supplies.
- Hydrologic drought remains a significant concern going forward as reservoir levels will struggle to provide a similar drawdown in 2022 to what was needed to cover 2021’s water supply deficit.
Utah Statewide Snow Water Equivalent (Inches)
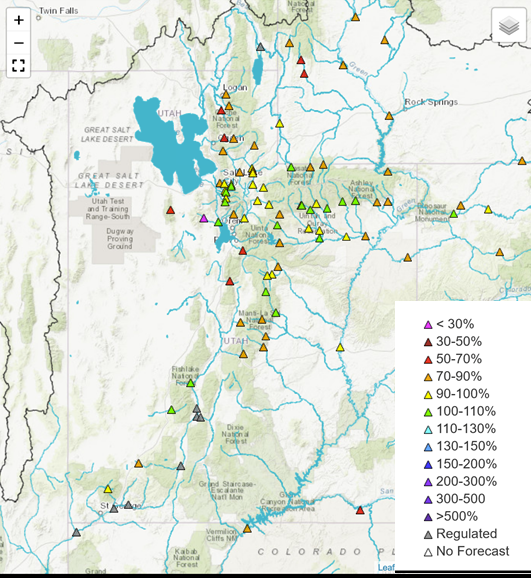
February 1 Water Supply Forecast
Wyoming
- Soil moisture continues to be low (10th percentile or less) for parts of northeast Wyoming, especially eastern Sheridan, northeastern Johnson, northern Campbell, and northwestern Crook counties.
- Precipitation:
- Precipitation has been average for the southeast and central parts of Wyoming, as well as some of the lower elevations in the northwest.
- The northeast, far northwest, and south central areas have missed out on much of the January snows.
- Temperatures:
- Temperatures were below normal for the western part of the state. This was driven mostly by cooler than average nighttime lows.
- Parts of south central and southeastern Wyoming were also below normal both for minimum and maximum temperatures.
- Along with below-normal precipitation, the northeast also had above-normal mean temperatures, which were influenced mostly by warmer than average daytime temperatures.
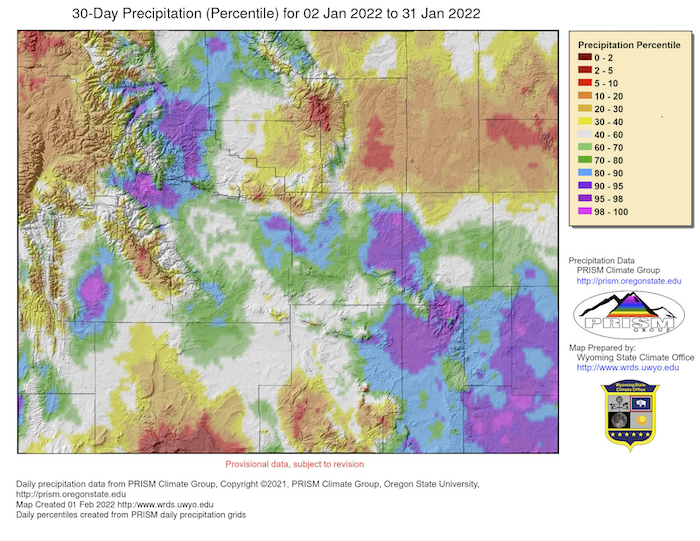
Wyoming 30-Day Percent of Normal Precipitation
For More Information
More local information is available from the following resources:
- Your state climatologist
- Your local National Weather Service office
- Western Water Assessment: Intermountain West Climate Dashboard
In Case You Missed It
- January 27, 2022: Southwest Drought Briefing
- February 1, 2022: Environmental Flows in the Rio Grande – Rio Bravo Basin
Upcoming Events
- February 23, 2022: Southwest Drought Briefing
- March 29, 2022: Spring Runoff Conference, Utah State University
Prepared By
Joel Lisonbee
NOAA/National Integrated Drought Information System (NIDIS)
Erin Saffell
Arizona State Climatologist/Arizona State University
Peter Goble
Colorado Climate Center/Colorado State University
Jon Meyer
Utah Climate Center/Utah State University
Tony Bergantino
Water Resources Data System – Wyoming State Climate Office
This drought status update is issued in partnership between the National Oceanic and Atmospheric Administration (NOAA), and the offices of the state climatologist for Arizona, Colorado, New Mexico, Utah and Wyoming. The purpose of the update is to communicate a potential area of concern for drought expansion and/or development within the Intermountain West based on recent conditions and the upcoming forecast. NIDIS and its partners will issue future drought status updates as conditions evolve.