




Outlooks & Forecasts
1–5 Day
During August 5–10, the National Weather Services forecasts little to no heavy rainfall across the Lower 48 states. A few areas are forecast to receive 1.5 to locally 3.0 inches of rain, but they are not extensive. This includes central Missouri, a few scattered patches along the Appalachians from western North Carolina to Upstate New York, isolated spots in southwestern Wisconsin and southwestern Michigan, and portions of central and west-central Florida. Totals of 1 to 2 inches are also possible in parts of Arizona. Amounts exceeding an inch are also forecast across parts of northern New England and Upstate New York, a large swath of Missouri and some adjacent areas, the southern Great Lakes and adjacent Mississippi Valley, parts of Pennsylvania, scattered patches along the Gulf Coast, areas of the Appalachians from northern Georgia through West Virginia, and South Florida.
Most of the country can expect near- to above-normal temperatures during this period, especially over the Great Plains westward. The greatest departures are forecast in southern Kansas, the Texas and Oklahoma Panhandles, most of Colorado, and some adjacent areas. Temperatures east of the Mississippi River are (largely) expected to be closer to normal. Temperatures should average 46–6 F above normal across the Tennessee and adjacent Lower Mississippi Valley, parts of the Mid-Atlantic Region, and northern New England.
6–10 Day
The National Weather Service Climate Prediction Center's 6–10 day outlook (valid August 11–15, 2026) favors above-normal precipitation from the Southwest, Great Basin, and Intermountain West eastward into the Great Plains. The best chances for significantly above-normal precipitation (over 50%) are in Arizona through most of Utah, eastern Nevada, and southeastern California. Odds lean toward above-normal precipitation in most of the eastern half of the country as well, with some exceptions. Across the Lower 48 states, below-normal rainfall is only favored in the Florida Peninsula. Odds favor below-normal precipitation in far southeastern Alaska, with near-normal precipitation in the rest of the southeast and central Alaska. Above-normal precipitation is expected over most of Hawaii outside Kauai.
Meanwhile, warmer than typical mid-August conditions are favored across most of the country. Odds favor above-normal temperatures from the Middle and South Atlantic regions westward through the central and southern Great Plains, then from the entirety of the Rockies to the Pacific Coast. Chances for significantly above-normal temperatures are highest (60–80% chance), across the Big Island and southeastern Maui in Hawaii, central Alaska, portions of the Lower Mississippi Valley and southern Great Plains, and the South Atlantic region from Florida through eastern South Carolina.
This weekly look ahead is modified from the U.S. Drought Monitor's National Drought Summary for August 4, 2026, written by Richard Tinker (NOAA's Climate Prediction Center) and Daniel Whitesel (National Drought Mitigation Center).
Official NOAA Drought Outlooks
Drought Is Predicted To...
Drought Persists
During this time period, NOAA's Climate Prediction Center predicts that drought conditions will persist.
Drought Improves
During this time period, NOAA's Climate Prediction Center predicts that existing drought conditions will improve (but not be removed).
Drought Is Removed
During this time period, NOAA's Climate Prediction Center predicts that drought will be removed.
Drought Develops
During this time period, NOAA's Climate Prediction Center predicts that drought will develop.
No Drought Present
According to NOAA's Climate Prediction Center, there is no drought, and is drought development is not predicted.
Drought Is Predicted To...
Drought Persists
During this time period, NOAA's Climate Prediction Center predicts that drought conditions will persist.
Drought Improves
During this time period, NOAA's Climate Prediction Center predicts that existing drought conditions will improve (but not be removed).
Drought Is Removed
During this time period, NOAA's Climate Prediction Center predicts that drought will be removed.
Drought Develops
During this time period, NOAA's Climate Prediction Center predicts that drought will develop.
No Drought Present
According to NOAA's Climate Prediction Center, there is no drought, and is drought development is not predicted.
2-4 Week Hazard Outlook
Risk of Rapid Onset Drought
National Weather Service forecasters predict that rapid drought development (also known as "flash drought") may occur in the coming 2–4 weeks.
The Monthly Drought Outlook predicts whether drought will develop, remain, improve, or be removed in the next calendar month.
The Seasonal Drought Outlook predicts whether drought will develop, remain, improve, or be removed in the next 3 months or so.
This National Weather Service hazard outlook map shows the risk of rapid onset drought (flash drought) development during the next 2–4 weeks.
Forecasters use initial conditions, like existing dryness (e.g., soil moisture), temperature, and precipitation outlooks, to assess the risk of rapid drought development. Rapid onset drought risk areas (yellow) can give users, such as farmers making decisions about planting and supplemental irrigation, an early warning of the potential for hot and dry conditions.
The Climate Prediction Center issues its Monthly Drought Outlooks on the last day of the calendar month.
The Climate Prediction Center issues its Seasonal Drought Outlooks on the third Thursday of each calendar month. Sometimes, the map is adjusted on the last day of the month to maintain consistency with the Monthly Drought Outlook.
National Weather Service (NWS) forecasters issue rapid onset drought (ROD) risk areas on Thursdays, with the potential for updates on the following Mondays, from April 1–October 31.
The NWS Climate Prediction Center hazards outlook is issued between 2–5 p.m. ET, and this Drought.gov map updates at 7 p.m. ET.
Snow drought is a period of abnormally low snowpack for the time of year. Snowpack typically acts as a natural reservoir, providing water throughout the drier summer months. Lack of snowpack storage, or a shift in timing of snowmelt, can be a challenge for drought planning.
Learn MorePeriods of drought can lead to inadequate water supply, threatening the health, safety, and welfare of communities. Streamflow, groundwater, reservoir, and snowpack data are key to monitoring and forecasting water supply.
Learn MoreDrought can reduce the water availability and water quality necessary for productive farms, ranches, and grazing lands, resulting in significant negative direct and indirect economic impacts to the agricultural sector. Monitoring agricultural drought typically focuses on examining levels of precipitation, evaporative demand, soil moisture, and surface/groundwater quantity and quality.
Learn MoreDuring drought conditions, fuels for wildfire, such as grasses and trees, can dry out and become more flammable. Drought can also increase the probability of ignition and the rate at which fire spreads. Temperature, soil moisture, humidity, wind speed, and fuel availability (vegetation) are all factors that interact to influence the frequency of large wildfires.
Learn MoreSnow drought is a period of abnormally low snowpack for the time of year. Snowpack typically acts as a natural reservoir, providing water throughout the drier summer months. Lack of snowpack storage, or a shift in timing of snowmelt, can be a challenge for drought planning.
Learn MorePeriods of drought can lead to inadequate water supply, threatening the health, safety, and welfare of communities. Streamflow, groundwater, reservoir, and snowpack data are key to monitoring and forecasting water supply.
Learn MoreDrought can reduce the water availability and water quality necessary for productive farms, ranches, and grazing lands, resulting in significant negative direct and indirect economic impacts to the agricultural sector. Monitoring agricultural drought typically focuses on examining levels of precipitation, evaporative demand, soil moisture, and surface/groundwater quantity and quality.
Learn MoreDuring drought conditions, fuels for wildfire, such as grasses and trees, can dry out and become more flammable. Drought can also increase the probability of ignition and the rate at which fire spreads. Temperature, soil moisture, humidity, wind speed, and fuel availability (vegetation) are all factors that interact to influence the frequency of large wildfires.
Learn MoreAir temperature can have wide-ranging effects on natural processes. Warmer air temperatures increase evapotranspiration—which is the combination of evaporation from the soil and bodies of water and transpiration from plants—and lower soil moisture.
Learn MoreFlash drought is the rapid onset or intensification of drought. Unlike slow-evolving drought, which is caused by a decline in precipitation, flash drought occurs when low precipitation is accompanied by abnormally high temperatures, high winds, and/or changes in radiation. These sometimes-rapid changes can quickly raise evapotranspiration rates and remove available water from the landscape.
Learn MoreDrought can reduce the water availability and water quality necessary for productive farms, ranches, and grazing lands, resulting in significant negative direct and indirect economic impacts to the agricultural sector. Monitoring agricultural drought typically focuses on examining levels of precipitation, evaporative demand, soil moisture, and surface/groundwater quantity and quality.
Learn MoreExtreme weather events can interact or cascade—where one disaster event triggers or changes the probability of another event. For example, drought conditions can increase the probability of large-scale wildfires, and droughts are often accompanied by extreme heat. By including drought in multi-hazard planning, a community can consolidate its resources and develop coordinated responses before a disaster.
Learn MoreOfficial NOAA Precipitation Forecast
Predicted Inches of Precipitation
Less than 0.01 inch
0.01 to 0.1 inch
0.1 to 0.25 inch
0.25 to 0.5 inch
0.5 to 0.75 inch
0.75 to 1 inch
1 to 1.25 inches
1.25 to 1.5 inches
1.5 to 1.75 inches
1.75 to 2 inches
1.5 to 2 inches
2 to 2.5 inches
2.5 to 3 inches
3 to 4 inches
4 to 5 inches
5 to 7 inches
7 to 10 inches
10 to 15 inches
15 to 20 inches
More than 20 inches
Predicted Inches of Precipitation
Less than 0.01 inch
0.01 to 0.1 inch
0.1 to 0.25 inch
0.25 to 0.5 inch
0.5 to 0.75 inch
0.75 to 1 inch
1 to 1.25 inches
1.25 to 1.5 inches
1.5 to 1.75 inches
1.75 to 2 inches
1.5 to 2 inches
2 to 2.5 inches
2.5 to 3 inches
3 to 4 inches
4 to 5 inches
5 to 7 inches
7 to 10 inches
10 to 15 inches
15 to 20 inches
More than 20 inches
This map shows the amount of liquid precipitation (in inches) expected to fall over the next 1 day, according to the National Weather Service.
This map shows the amount of liquid precipitation (in inches) expected to fall over the next 7 days, according to the National Weather Service.
The Quantitative Precipitation Forecast maps on Drought.gov are updated once a day and are valid from 7 a.m. Eastern that day.
The Quantitative Precipitation Forecast maps on Drought.gov are updated once a day and are valid from 7 a.m. Eastern that day.
Drought is defined as the lack of precipitation over an extended period of time, usually for a season or more, that results in a water shortage. Changes in precipitation can substantially disrupt crops and livestock, influence the frequency and intensity of severe weather events, and affect the quality and quantity of water available for municipal and industrial use.
Learn MoreFlash drought is the rapid onset or intensification of drought. Unlike slow-evolving drought, which is caused by a decline in precipitation, flash drought occurs when low precipitation is accompanied by abnormally high temperatures, high winds, and/or changes in radiation. These sometimes-rapid changes can quickly raise evapotranspiration rates and remove available water from the landscape.
Learn MoreDrought can reduce the water availability and water quality necessary for productive farms, ranches, and grazing lands, resulting in significant negative direct and indirect economic impacts to the agricultural sector. Monitoring agricultural drought typically focuses on examining levels of precipitation, evaporative demand, soil moisture, and surface/groundwater quantity and quality.
Learn MoreDrought is defined as the lack of precipitation over an extended period of time, usually for a season or more, that results in a water shortage. Changes in precipitation can substantially disrupt crops and livestock, influence the frequency and intensity of severe weather events, and affect the quality and quantity of water available for municipal and industrial use.
Learn MoreFlash drought is the rapid onset or intensification of drought. Unlike slow-evolving drought, which is caused by a decline in precipitation, flash drought occurs when low precipitation is accompanied by abnormally high temperatures, high winds, and/or changes in radiation. These sometimes-rapid changes can quickly raise evapotranspiration rates and remove available water from the landscape.
Learn MoreDrought can reduce the water availability and water quality necessary for productive farms, ranches, and grazing lands, resulting in significant negative direct and indirect economic impacts to the agricultural sector. Monitoring agricultural drought typically focuses on examining levels of precipitation, evaporative demand, soil moisture, and surface/groundwater quantity and quality.
Learn MoreOfficial NOAA Precipitation Outlooks
Probability of Below-Normal Precipitation
33%–40% Chance of Below Normal
There is an 33%–40% chance of below-normal precipitation during this period.
40%–50% Chance of Below Normal
There is an 40%–50% chance of below-normal precipitation during this period.
50%–60% Chance of Below Normal
There is an 50%–60% chance of below-normal precipitation during this period.
60%–70% Chance of Below Normal
There is an 60%–70% chance of below-normal precipitation during this period.
70%–80% Chance of Below Normal
There is an 70%–80% chance of below-normal precipitation during this period.
80%–90% Chance of Below Normal
There is an 80%–90% chance of below-normal precipitation during this period.
>90% Chance of Below Normal
There is a >90% chance of below-normal precipitation during this period.
Probability of Above-Normal Precipitation
33%–40% Chance of Above Normal
There is an 33%–40% chance of above-normal precipitation during this period.
40%–50% Chance of Above Normal
There is an 40%–50% chance of above-normal precipitation during this period.
50%–60% Chance of Above Normal
There is an 50%–60% chance of above-normal precipitation during this period.
60%–70% Chance of Above Normal
There is an 60%–70% chance of above-normal precipitation during this period.
70%–80% Chance of Above Normal
There is an 70%–80% chance of above-normal precipitation during this period.
80%–90% Chance of Above Normal
There is an 80%–90% chance of above-normal precipitation during this period.
>90% Chance of Above Normal
There is a >90% chance of above-normal precipitation during this period.
Near-Normal
Odds favor near-normal precipitation during this period.
Probability of Below-Normal Precipitation
33%–40% Chance of Below Normal
There is an 33%–40% chance of below-normal precipitation during this period.
40%–50% Chance of Below Normal
There is an 40%–50% chance of below-normal precipitation during this period.
50%–60% Chance of Below Normal
There is an 50%–60% chance of below-normal precipitation during this period.
60%–70% Chance of Below Normal
There is an 60%–70% chance of below-normal precipitation during this period.
70%–80% Chance of Below Normal
There is an 70%–80% chance of below-normal precipitation during this period.
80%–90% Chance of Below Normal
There is an 80%–90% chance of below-normal precipitation during this period.
>90% Chance of Below Normal
There is a >90% chance of below-normal precipitation during this period.
Probability of Above-Normal Precipitation
33%–40% Chance of Above Normal
There is an 33%–40% chance of above-normal precipitation during this period.
40%–50% Chance of Above Normal
There is an 40%–50% chance of above-normal precipitation during this period.
50%–60% Chance of Above Normal
There is an 50%–60% chance of above-normal precipitation during this period.
60%–70% Chance of Above Normal
There is an 60%–70% chance of above-normal precipitation during this period.
70%–80% Chance of Above Normal
There is an 70%–80% chance of above-normal precipitation during this period.
80%–90% Chance of Above Normal
There is an 80%–90% chance of above-normal precipitation during this period.
>90% Chance of Above Normal
There is a >90% chance of above-normal precipitation during this period.
Near-Normal
Odds favor near-normal precipitation during this period.
Probability of Below-Normal Precipitation
33%–40% Chance of Below Normal
There is an 33%–40% chance of below-normal precipitation during this period.
40%–50% Chance of Below Normal
There is an 40%–50% chance of below-normal precipitation during this period.
50%–60% Chance of Below Normal
There is an 50%–60% chance of below-normal precipitation during this period.
60%–70% Chance of Below Normal
There is an 60%–70% chance of below-normal precipitation during this period.
70%–80% Chance of Below Normal
There is an 70%–80% chance of below-normal precipitation during this period.
80%–90% Chance of Below Normal
There is an 80%–90% chance of below-normal precipitation during this period.
>90% Chance of Below Normal
There is a >90% chance of below-normal precipitation during this period.
Probability of Above-Normal Precipitation
33%–40% Chance of Above Normal
There is an 33%–40% chance of above-normal precipitation during this period.
40%–50% Chance of Above Normal
There is an 40%–50% chance of above-normal precipitation during this period.
50%–60% Chance of Above Normal
There is an 50%–60% chance of above-normal precipitation during this period.
60%–70% Chance of Above Normal
There is an 60%–70% chance of above-normal precipitation during this period.
70%–80% Chance of Above Normal
There is an 70%–80% chance of above-normal precipitation during this period.
80%–90% Chance of Above Normal
There is an 80%–90% chance of above-normal precipitation during this period.
>90% Chance of Above Normal
There is a >90% chance of above-normal precipitation during this period.
Probability of Near-Normal Precipitation
33%–40% of Near Normal
There is an 33%–40% chance of near-normal precipitation during this period.
40%–50% of Near Normal
There is an 40%–50% chance of near-normal precipitation during this period.
Probability of Below-Normal Precipitation
33%–40% Chance of Below Normal
There is an 33%–40% chance of below-normal precipitation during this period.
40%–50% Chance of Below Normal
There is an 40%–50% chance of below-normal precipitation during this period.
50%–60% Chance of Below Normal
There is an 50%–60% chance of below-normal precipitation during this period.
60%–70% Chance of Below Normal
There is an 60%–70% chance of below-normal precipitation during this period.
70%–80% Chance of Below Normal
There is an 70%–80% chance of below-normal precipitation during this period.
80%–90% Chance of Below Normal
There is an 80%–90% chance of below-normal precipitation during this period.
>90% Chance of Below Normal
There is a >90% chance of below-normal precipitation during this period.
Probability of Above-Normal Precipitation
33%–40% Chance of Above Normal
There is an 33%–40% chance of above-normal precipitation during this period.
40%–50% Chance of Above Normal
There is an 40%–50% chance of above-normal precipitation during this period.
50%–60% Chance of Above Normal
There is an 50%–60% chance of above-normal precipitation during this period.
60%–70% Chance of Above Normal
There is an 60%–70% chance of above-normal precipitation during this period.
70%–80% Chance of Above Normal
There is an 70%–80% chance of above-normal precipitation during this period.
80%–90% Chance of Above Normal
There is an 80%–90% chance of above-normal precipitation during this period.
>90% Chance of Above Normal
There is a >90% chance of above-normal precipitation during this period.
Probability of Near-Normal Precipitation
33%–40% of Near Normal
There is an 33%–40% chance of near-normal precipitation during this period.
40%–50% of Near Normal
There is an 40%–50% chance of near-normal precipitation during this period.
This map shows the probability (percent chance) of above-normal, near-normal, or below-normal precipitation 6 to 10 days in the future.
This map shows the probability (percent chance) of above-normal, near-normal, or below-normal precipitation 8 to 14 days in the future.
This map shows the probability (percent chance) of above-normal (green hues) or below-normal (brown hues) precipitation over the next calendar month. White areas indicates equal chances of above- or below-normal precipitation.
This map shows the probability (percent chance) of above-normal (green hues) or below-normal (brown hues) precipitation over the next three months. White areas indicates equal chances of above- or below-normal precipitation.
The Climate Prediction Center updates their 6–10 day precipitation outlook daily.
The Climate Prediction Center updates their 8–14 day outlooks daily.
The Climate Prediction Center updates their monthly precipitation outlook on the third Thursday of each calendar month and again on the last day of each calendar month.
The Climate Prediction Center updates their seasonal precipitation outlook on the third Thursday of each calendar month.
Drought is defined as the lack of precipitation over an extended period of time, usually for a season or more, that results in a water shortage. Changes in precipitation can substantially disrupt crops and livestock, influence the frequency and intensity of severe weather events, and affect the quality and quantity of water available for municipal and industrial use.
Learn MoreFlash drought is the rapid onset or intensification of drought. Unlike slow-evolving drought, which is caused by a decline in precipitation, flash drought occurs when low precipitation is accompanied by abnormally high temperatures, high winds, and/or changes in radiation. These sometimes-rapid changes can quickly raise evapotranspiration rates and remove available water from the landscape.
Learn MorePeriods of drought can lead to inadequate water supply, threatening the health, safety, and welfare of communities. Streamflow, groundwater, reservoir, and snowpack data are key to monitoring and forecasting water supply.
Learn MoreDrought can reduce the water availability and water quality necessary for productive farms, ranches, and grazing lands, resulting in significant negative direct and indirect economic impacts to the agricultural sector. Monitoring agricultural drought typically focuses on examining levels of precipitation, evaporative demand, soil moisture, and surface/groundwater quantity and quality.
Learn MoreDrought is defined as the lack of precipitation over an extended period of time, usually for a season or more, that results in a water shortage. Changes in precipitation can substantially disrupt crops and livestock, influence the frequency and intensity of severe weather events, and affect the quality and quantity of water available for municipal and industrial use.
Learn MoreFlash drought is the rapid onset or intensification of drought. Unlike slow-evolving drought, which is caused by a decline in precipitation, flash drought occurs when low precipitation is accompanied by abnormally high temperatures, high winds, and/or changes in radiation. These sometimes-rapid changes can quickly raise evapotranspiration rates and remove available water from the landscape.
Learn MorePeriods of drought can lead to inadequate water supply, threatening the health, safety, and welfare of communities. Streamflow, groundwater, reservoir, and snowpack data are key to monitoring and forecasting water supply.
Learn MoreDrought can reduce the water availability and water quality necessary for productive farms, ranches, and grazing lands, resulting in significant negative direct and indirect economic impacts to the agricultural sector. Monitoring agricultural drought typically focuses on examining levels of precipitation, evaporative demand, soil moisture, and surface/groundwater quantity and quality.
Learn MoreDrought is defined as the lack of precipitation over an extended period of time, usually for a season or more, that results in a water shortage. Changes in precipitation can substantially disrupt crops and livestock, influence the frequency and intensity of severe weather events, and affect the quality and quantity of water available for municipal and industrial use.
Learn MoreSnow drought is a period of abnormally low snowpack for the time of year. Snowpack typically acts as a natural reservoir, providing water throughout the drier summer months. Lack of snowpack storage, or a shift in timing of snowmelt, can be a challenge for drought planning.
Learn MorePeriods of drought can lead to inadequate water supply, threatening the health, safety, and welfare of communities. Streamflow, groundwater, reservoir, and snowpack data are key to monitoring and forecasting water supply.
Learn MoreDrought can reduce the water availability and water quality necessary for productive farms, ranches, and grazing lands, resulting in significant negative direct and indirect economic impacts to the agricultural sector. Monitoring agricultural drought typically focuses on examining levels of precipitation, evaporative demand, soil moisture, and surface/groundwater quantity and quality.
Learn MoreSnow drought is a period of abnormally low snowpack for the time of year. Snowpack typically acts as a natural reservoir, providing water throughout the drier summer months. Lack of snowpack storage, or a shift in timing of snowmelt, can be a challenge for drought planning.
Learn MorePeriods of drought can lead to inadequate water supply, threatening the health, safety, and welfare of communities. Streamflow, groundwater, reservoir, and snowpack data are key to monitoring and forecasting water supply.
Learn MoreDrought can reduce the water availability and water quality necessary for productive farms, ranches, and grazing lands, resulting in significant negative direct and indirect economic impacts to the agricultural sector. Monitoring agricultural drought typically focuses on examining levels of precipitation, evaporative demand, soil moisture, and surface/groundwater quantity and quality.
Learn MoreDuring drought conditions, fuels for wildfire, such as grasses and trees, can dry out and become more flammable. Drought can also increase the probability of ignition and the rate at which fire spreads. Temperature, soil moisture, humidity, wind speed, and fuel availability (vegetation) are all factors that interact to influence the frequency of large wildfires.
Learn MoreOfficial NOAA Temperature Outlooks
Probability of Below-Normal Temperatures
33%–40% Chance of Below Normal
There is an 33%–40% chance of below-normal temperatures during this period.
40%–50% Chance of Below Normal
There is an 40%–50% chance of below-normal temperatures during this period.
50%–60% Chance of Below Normal
There is an 50%–60% chance of below-normal temperatures during this period.
60%–70% Chance of Below Normal
There is an 60%–70% chance of below-normal temperatures during this period.
70%–80% Chance of Below Normal
There is an 70%–80% chance of below-normal temperatures during this period.
80%–90% Chance of Below Normal
There is an 80%–90% chance of below-normal temperatures during this period.
>90% Chance of Below Normal
There is a >90% chance of below-normal temperatures during this period.
Probability of Above-Normal Temperatures
33%–40% Chance of Above Normal
There is an 33%–40% chance of above-normal temperatures during this period.
40%–50% Chance of Above Normal
There is an 40%–50% chance of above-normal temperatures during this period.
50%–60% Chance of Above Normal
There is an 50%–60% chance of above-normal temperatures during this period.
60%–70% Chance of Above Normal
There is an 60%–70% chance of above-normal temperatures during this period.
70%–80% Chance of Above Normal
There is an 70%–80% chance of above-normal temperatures during this period.
80%–90% Chance of Above Normal
There is an 80%–90% chance of above-normal temperatures during this period.
>90% Chance of Above Normal
There is a >90% chance of above-normal temperatures during this period.
Near-Normal
Odds favor near-normal temperatures during this period.
Probability of Below-Normal Temperatures
33%–40% Chance of Below Normal
There is an 33%–40% chance of below-normal temperatures during this period.
40%–50% Chance of Below Normal
There is an 40%–50% chance of below-normal temperatures during this period.
50%–60% Chance of Below Normal
There is an 50%–60% chance of below-normal temperatures during this period.
60%–70% Chance of Below Normal
There is an 60%–70% chance of below-normal temperatures during this period.
70%–80% Chance of Below Normal
There is an 70%–80% chance of below-normal temperatures during this period.
80%–90% Chance of Below Normal
There is an 80%–90% chance of below-normal temperatures during this period.
>90% Chance of Below Normal
There is a >90% chance of below-normal temperatures during this period.
Probability of Above-Normal Temperatures
33%–40% Chance of Above Normal
There is an 33%–40% chance of above-normal temperatures during this period.
40%–50% Chance of Above Normal
There is an 40%–50% chance of above-normal temperatures during this period.
50%–60% Chance of Above Normal
There is an 50%–60% chance of above-normal temperatures during this period.
60%–70% Chance of Above Normal
There is an 60%–70% chance of above-normal temperatures during this period.
70%–80% Chance of Above Normal
There is an 70%–80% chance of above-normal temperatures during this period.
80%–90% Chance of Above Normal
There is an 80%–90% chance of above-normal temperatures during this period.
>90% Chance of Above Normal
There is a >90% chance of above-normal temperatures during this period.
Near-Normal
Odds favor near-normal temperatures during this period.
Probability of Below-Normal Temperatures
33%–40% Chance of Below Normal
There is an 33%–40% chance of below-normal temperatures during this period.
40%–50% Chance of Below Normal
There is an 40%–50% chance of below-normal temperatures during this period.
50%–60% Chance of Below Normal
There is an 50%–60% chance of below-normal temperatures during this period.
60%–70% Chance of Below Normal
There is an 60%–70% chance of below-normal temperatures during this period.
70%–80% Chance of Below Normal
There is an 70%–80% chance of below-normal temperatures during this period.
80%–90% Chance of Below Normal
There is an 80%–90% chance of below-normal temperatures during this period.
>90% Chance of Below Normal
There is a >90% chance of below-normal temperatures during this period.
Probability of Above-Normal Temperatures
33%–40% Chance of Above Normal
There is an 33%–40% chance of above-normal temperatures during this period.
40%–50% Chance of Above Normal
There is an 40%–50% chance of above-normal temperatures during this period.
50%–60% Chance of Above Normal
There is an 50%–60% chance of above-normal temperatures during this period.
60%–70% Chance of Above Normal
There is an 60%–70% chance of above-normal temperatures during this period.
70%–80% Chance of Above Normal
There is an 70%–80% chance of above-normal temperatures during this period.
80%–90% Chance of Above Normal
There is an 80%–90% chance of above-normal temperatures during this period.
>90% Chance of Above Normal
There is a >90% chance of above-normal temperatures during this period.
Probability of Near-Normal Temperatures
33%–40% of Near Normal
There is an 33%–40% chance of near-normal temperatures during this period.
40%–50% of Near Normal
There is an 40%–50% chance of near-normal temperatures during this period.
Probability of Below-Normal Temperatures
33%–40% Chance of Below Normal
There is an 33%–40% chance of below-normal temperatures during this period.
40%–50% Chance of Below Normal
There is an 40%–50% chance of below-normal temperatures during this period.
50%–60% Chance of Below Normal
There is an 50%–60% chance of below-normal temperatures during this period.
60%–70% Chance of Below Normal
There is an 60%–70% chance of below-normal temperatures during this period.
70%–80% Chance of Below Normal
There is an 70%–80% chance of below-normal temperatures during this period.
80%–90% Chance of Below Normal
There is an 80%–90% chance of below-normal temperatures during this period.
>90% Chance of Below Normal
There is a >90% chance of below-normal temperatures during this period.
Probability of Above-Normal Temperatures
33%–40% Chance of Above Normal
There is an 33%–40% chance of above-normal temperatures during this period.
40%–50% Chance of Above Normal
There is an 40%–50% chance of above-normal temperatures during this period.
50%–60% Chance of Above Normal
There is an 50%–60% chance of above-normal temperatures during this period.
60%–70% Chance of Above Normal
There is an 60%–70% chance of above-normal temperatures during this period.
70%–80% Chance of Above Normal
There is an 70%–80% chance of above-normal temperatures during this period.
80%–90% Chance of Above Normal
There is an 80%–90% chance of above-normal temperatures during this period.
>90% Chance of Above Normal
There is a >90% chance of above-normal temperatures during this period.
Probability of Near-Normal Temperatures
33%–40% of Near Normal
There is an 33%–40% chance of near-normal temperatures during this period.
40%–50% of Near Normal
There is an 40%–50% chance of near-normal temperatures during this period.
This map shows the probability (percent chance) of above-normal, near-normal, or below-normal temperatures 6 to 10 days in the future.
This map shows the probability (percent chance) of above-normal, near-normal, or below-normal temperature 8 to 14 days in the future.
This map shows the probability (percent chance) of above-normal (red hues) or below-normal (blue hues) temperatures over the next calendar month. White areas indicates equal chances of above- or below-normal temperatures.
This map shows the probability (percent chance) of above-normal (red hues) or below-normal (blue hues) temperatures over the next three months. White areas indicates equal chances of above- or below-normal temperatures.
The Climate Prediction Center updates their 6–10 day outlooks daily.
The Climate Prediction Center updates their 8–14 day outlooks daily.
The Climate Prediction Center updates their monthly temperature outlook on the third Thursday of each calendar month and again on the last day of each calendar month.
The Climate Prediction Center updates their seasonal temperature outlook on the third Thursday of each calendar month.
Air temperature can have wide-ranging effects on natural processes. Warmer air temperatures increase evapotranspiration—which is the combination of evaporation from the soil and bodies of water and transpiration from plants—and lower soil moisture.
Learn MoreFlash drought is the rapid onset or intensification of drought. Unlike slow-evolving drought, which is caused by a decline in precipitation, flash drought occurs when low precipitation is accompanied by abnormally high temperatures, high winds, and/or changes in radiation. These sometimes-rapid changes can quickly raise evapotranspiration rates and remove available water from the landscape.
Learn MoreAir temperature can have wide-ranging effects on natural processes. Warmer air temperatures increase evapotranspiration—which is the combination of evaporation from the soil and bodies of water and transpiration from plants—and lower soil moisture.
Learn MoreFlash drought is the rapid onset or intensification of drought. Unlike slow-evolving drought, which is caused by a decline in precipitation, flash drought occurs when low precipitation is accompanied by abnormally high temperatures, high winds, and/or changes in radiation. These sometimes-rapid changes can quickly raise evapotranspiration rates and remove available water from the landscape.
Learn MoreAir temperature can have wide-ranging effects on natural processes. Warmer air temperatures increase evapotranspiration—which is the combination of evaporation from the soil and bodies of water and transpiration from plants—and lower soil moisture.
Learn MoreSnow drought is a period of abnormally low snowpack for the time of year. Snowpack typically acts as a natural reservoir, providing water throughout the drier summer months. Lack of snowpack storage, or a shift in timing of snowmelt, can be a challenge for drought planning.
Learn MoreDrought can reduce the water availability and water quality necessary for productive farms, ranches, and grazing lands, resulting in significant negative direct and indirect economic impacts to the agricultural sector. Monitoring agricultural drought typically focuses on examining levels of precipitation, evaporative demand, soil moisture, and surface/groundwater quantity and quality.
Learn MoreAir temperature can have wide-ranging effects on natural processes. Warmer air temperatures increase evapotranspiration—which is the combination of evaporation from the soil and bodies of water and transpiration from plants—and lower soil moisture.
Learn MoreSnow drought is a period of abnormally low snowpack for the time of year. Snowpack typically acts as a natural reservoir, providing water throughout the drier summer months. Lack of snowpack storage, or a shift in timing of snowmelt, can be a challenge for drought planning.
Learn MoreDrought can reduce the water availability and water quality necessary for productive farms, ranches, and grazing lands, resulting in significant negative direct and indirect economic impacts to the agricultural sector. Monitoring agricultural drought typically focuses on examining levels of precipitation, evaporative demand, soil moisture, and surface/groundwater quantity and quality.
Learn MoreOfficial NOAA Fire + Heat Outlooks
Forecast Risk of Fire Weather
Elevated
Fire weather conditions are forecast to be elevated for temperature, wind, and relative humidity. Learn more about these designations.
Critical
Fire weather conditions are forecast to be critical for temperature, wind, and relative humidity. Learn more about these designations.
Extremely Critical
Fire weather conditions are forecast to be extremely critical for temperature, wind, and relative humidity. Learn more about these designations.
Isolated Dry Thunderstorms
The Storm Prediction Center has issued a forecast for isolated dry thunderstorms. This heightens the risk of fire ignition due to cloud-to-ground lightning, assuming a dry fuel bed. Learn more about these designations.
Scattered (Critical) Dry Thunderstorms
The Storm Prediction Center has issued a forecast for scattered (critical) dry thunderstorms. This heightens the risk of fire ignition due to cloud-to-ground lightning, assuming a dry fuel bed. Learn more about these designations.
Hazard Outlook for Days 3–7
Risk of Hazardous Heat
This area has a risk for hazardous heat 3 days from now through 7 days from now. This typically means that National Weather Service forecasters predict a 40% or greater chance of exceeding widespread NWS Heat Advisory criteria, based on the Heat Index for your location. Or, for the West, widespread major (level 3) or scattered extreme (level 4) HeatRisk is present.
Hazard Outlook for Days 8–14
Risk of Excessive Heat
This area has a risk for excessive heat next week (8 days from now through 14 days from now). National Weather Service forecasters predict a 40% or greater chance of exceeding widespread NWS Heat Advisory criteria, based on the Heat Index for your location.
The National Weather Service's Storm Prediction Center produces daily fire weather outlooks, which delineate areas of the continental U.S. where pre-existing fuel conditions, combined with forecast weather conditions, will result in a significant threat for the ignition and/or spread of wildfires. This map shows the 1-day fire weather outlook.
A hazardous heat risk area typically indicates a 40% or greater chance of exceeding NWS Heat Advisory criteria, based on the Heat Index for your location.
This National Weather Service (NWS) Day 8–14 Hazard Outlook map shows the risk of excessive heat (red) next week (8 days from now through 14 days from now).
An excessive heat hazard typically indicates a 40% or greater chance of exceeding widespread NWS Heat Advisory criteria, based on the Heat Index for your location.
This map is updated daily with data from the National Weather Service's Storm Prediction Center. View more fire weather outlooks.
The National Weather Service's Weather Prediction Center issues the Day 3–7 Hazards Outlook daily Monday–Friday by 3:30 p.m. EST/4:30 p.m. EDT. This map is updated on Drought.gov around 7 p.m. ET Monday–Friday.
The National Weather Service's Climate Prediction Center issues the Day 8–14 Hazards Outlook daily Monday–Friday between 2–5 p.m. ET, and this Drought.gov map updates daily Monday–Friday around 7 p.m. ET.
Extreme weather events can interact or cascade—where one disaster event triggers or changes the probability of another event. For example, drought conditions can increase the probability of large-scale wildfires, and droughts are often accompanied by extreme heat. By including drought in multi-hazard planning, a community can consolidate its resources and develop coordinated responses before a disaster.
Learn MoreDuring drought conditions, fuels for wildfire, such as grasses and trees, can dry out and become more flammable. Drought can also increase the probability of ignition and the rate at which fire spreads. Temperature, soil moisture, humidity, wind speed, and fuel availability (vegetation) are all factors that interact to influence the frequency of large wildfires.
Learn MoreAir temperature can have wide-ranging effects on natural processes. Warmer air temperatures increase evapotranspiration—which is the combination of evaporation from the soil and bodies of water and transpiration from plants—and lower soil moisture.
Learn MoreFlash drought is the rapid onset or intensification of drought. Unlike slow-evolving drought, which is caused by a decline in precipitation, flash drought occurs when low precipitation is accompanied by abnormally high temperatures, high winds, and/or changes in radiation. These sometimes-rapid changes can quickly raise evapotranspiration rates and remove available water from the landscape.
Learn MoreDrought can reduce the water availability and water quality necessary for productive farms, ranches, and grazing lands, resulting in significant negative direct and indirect economic impacts to the agricultural sector. Monitoring agricultural drought typically focuses on examining levels of precipitation, evaporative demand, soil moisture, and surface/groundwater quantity and quality.
Learn MoreExtreme weather events can interact or cascade—where one disaster event triggers or changes the probability of another event. For example, drought conditions can increase the probability of large-scale wildfires, and droughts are often accompanied by extreme heat. By including drought in multi-hazard planning, a community can consolidate its resources and develop coordinated responses before a disaster.
Learn MoreAir temperature can have wide-ranging effects on natural processes. Warmer air temperatures increase evapotranspiration—which is the combination of evaporation from the soil and bodies of water and transpiration from plants—and lower soil moisture.
Learn MoreFlash drought is the rapid onset or intensification of drought. Unlike slow-evolving drought, which is caused by a decline in precipitation, flash drought occurs when low precipitation is accompanied by abnormally high temperatures, high winds, and/or changes in radiation. These sometimes-rapid changes can quickly raise evapotranspiration rates and remove available water from the landscape.
Learn MoreDrought can reduce the water availability and water quality necessary for productive farms, ranches, and grazing lands, resulting in significant negative direct and indirect economic impacts to the agricultural sector. Monitoring agricultural drought typically focuses on examining levels of precipitation, evaporative demand, soil moisture, and surface/groundwater quantity and quality.
Learn MoreExtreme weather events can interact or cascade—where one disaster event triggers or changes the probability of another event. For example, drought conditions can increase the probability of large-scale wildfires, and droughts are often accompanied by extreme heat. By including drought in multi-hazard planning, a community can consolidate its resources and develop coordinated responses before a disaster.
Learn MoreOfficial NOAA River Stage (Level) Forecast
Maximum Forecast River Stage
Major Flood
According to the National Weather Service, the Major Flood stage indicates "extensive inundation of structures and roads, significant evacuations of people, and/or transfer of property to higher elevations."
Moderate Flood
According to the National Weather Service, the Moderate Flood stage indicates "some inundation of structures and roads near stream, evacuations of people, and/or transfer of property to higher elevations."
Minor Flood
According to the National Weather Service, the Minor Flood stage indicates flooding with "minimal or no property damage, but possible some public threat (e.g., inundation of roads)."
Action Stage
When a location on the river hits the Action Stage, water levels have reached a height where "action is taken in preparation for possible significant hydrological activity," according to the National Weather Service.
No Flood
According to the National Weather Service, no flooding is indicated.
Low Water
According to the National Weather Service, the Low Water Threshold is the stage at which "low water levels begin to have significant negative impacts on a water-related industry or user community."
River forecast data from the National Weather Service's National Water Prediction Service (NWPS) provide valuable information about the chances of flood occurring. These river stage/flow forecasts show the maximum forecast flood category, taking into account past precipitation and the precipitation amounts expected approximately 48 hours into the future from the forecast issuance time.
River gauge forecasts from the National Weather Service are updated daily.
Periods of drought can lead to inadequate water supply, threatening the health, safety, and welfare of communities. Streamflow, groundwater, reservoir, and snowpack data are key to monitoring and forecasting water supply.
Learn MoreExtreme weather events can interact or cascade—where one disaster event triggers or changes the probability of another event. For example, drought conditions can increase the probability of large-scale wildfires, and droughts are often accompanied by extreme heat. By including drought in multi-hazard planning, a community can consolidate its resources and develop coordinated responses before a disaster.
Learn MoreIn a drought, lower water levels or snowpack can affect the availability of recreational activities and associated tourism, and a resulting loss of revenue can severely impact supply chains and the economy. Drought—as well as negative perceptions of drought, fire bans, or wildfires—may also result in decreased visitations, cancellations in hotel stays, a reduction in booked holidays, or reduced merchandise sales.
Learn MoreDuring drought conditions that result in low water levels on rivers and other waterways, port and maritime navigation and transportation operations may be limited due to a reduction in available routes and cargo-carrying capacity, resulting in increased costs. In addition, higher temperatures that often coexist with drought can impact roads, airport runways, and rail lines.
Learn More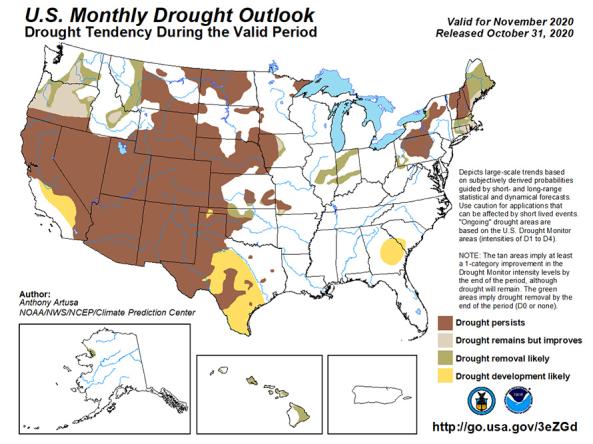
The U.S. Monthly Drought Outlook predicts whether drought will emerge, stay the same or get better over the next 30 days or so.
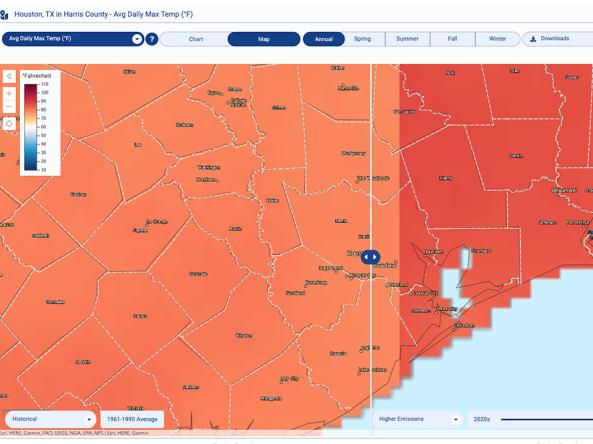
The Climate Explorer offers graphs and maps of observed and projected temperature, precipitation, and related climate variables for every county in the contiguous United States, helping people asse
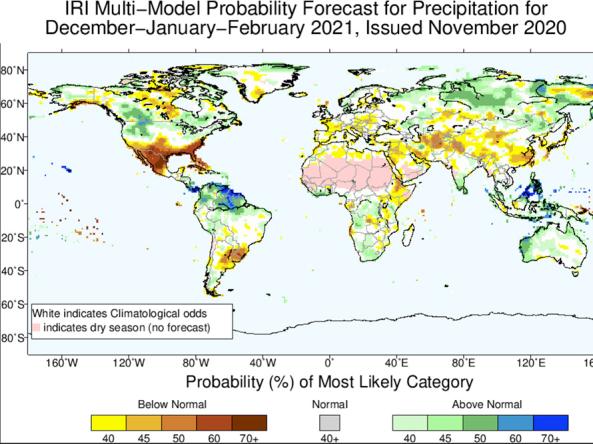
Worldwide predictions for temperature and precipitation from the International Research Institute (IRI) for Climate and Society at Columbia University.
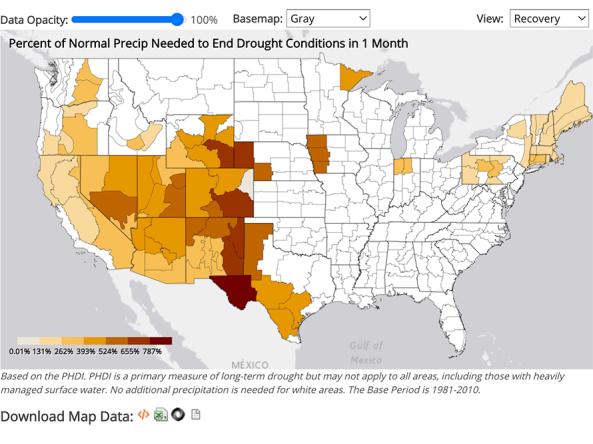
NCEI provides precipitation data that can be used to show probability or the amount of precipitation to ameliorate or end a drought at different monthly scales.
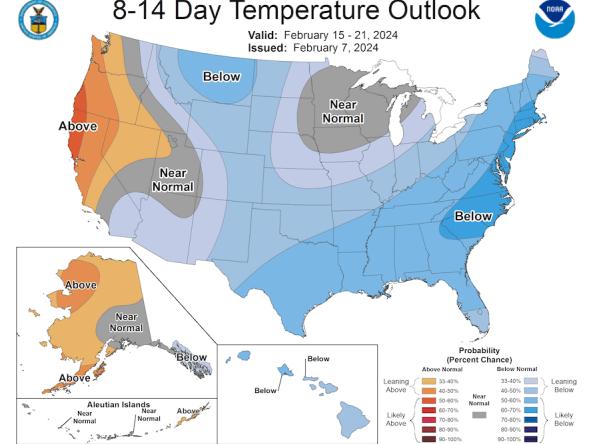
The Climate Prediction Center (CPC) produces temperature and precipitation outlooks for the U.S., including 6-10 day, 8-14 day, monthly, and seasonal outlooks.
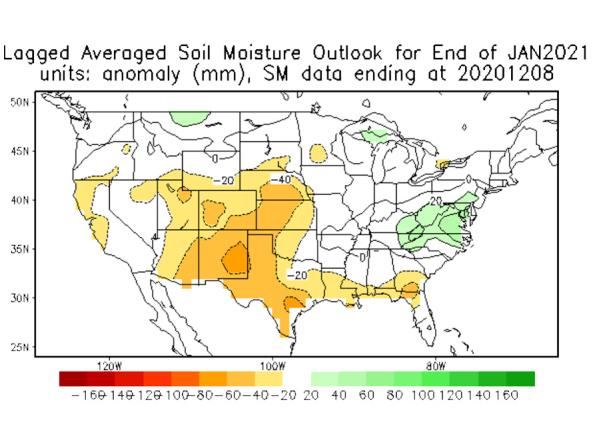
The National Weather Service (NWS) Climate Prediction Center (CPC) produces monthly and seasonal drought outlooks based on Soil Moisture (CAS).

Challenges with Predicting Drought
Pressure Systems
High pressure systems, which hinder cloud formation and lead to low relative humidity and precipitation, can cause drought. When large-scale anomalies in atmospheric circulation patterns last for months or seasons, prolonged drought occurs (NDMC).
Temperate Zone Forecast Reliability
In temperate regions (above 30 north latitude), long-range forecasts have limited reliability. Due to differences in observed conditions and statistical models, reliable forecasts for temperate regions may not be attainable for a season or more in advance (NDMC).
Interconnected Variables
Anomalies in precipitation and temperature may last from several months to several decades, and how long they last can depend on air–sea interactions, soil moisture, land surface processes, topography, and weather systems at the global scale (NDMC).
ENSO and Global Weather Patterns
Teleconnections, such as ENSO and La Niña events, are atmospheric interactions between widely separated regions. Understanding these teleconnections can help in forecasting droughts, floods, tropical storms, and hurricanes (NDMC).