Drought Termination and Amelioration
National Oceanic and Atmospheric Administration (NOAA) National Centers for Environmental Information (NCEI)
Because of the far-reaching societal and economic impacts of drought, there is considerable interest in determining how much precipitation is required to end a drought as well as the probability that a region may receive the necessary amount of precipitation. Ending a hydrological drought requires that the moisture needs associated with recharge, demand and runoff have been brought back to normal or above normal.
Drought Termination and Amelioration data and maps are available for:
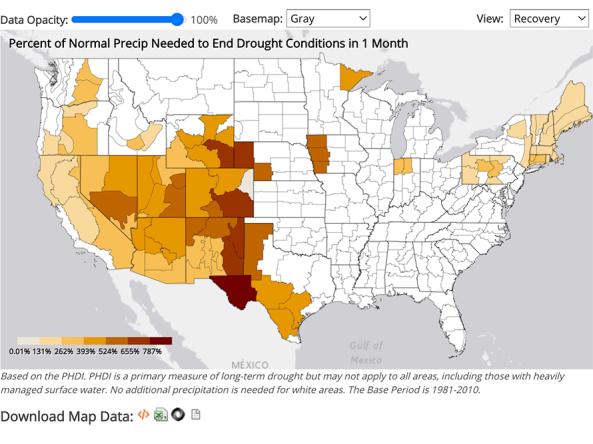
- Current Drought Reduction: more than 2000 maps of the contiguous U.S. are provided which show the precipitation totals needed to end or ameliorate drought from periods of 1 month to 6 months based on PHDI values from -2 to -6. These data were calculated for each month of the year and include precipitation values for each of the 344 contiguous U.S. climate divisions. The end of a drought is defined by a PHDI value of -0.5 while drought amelioration is achieved when a PHDI value of -2.0 is reached. Maps showing the probability of receiving the necessary amount of precipitation are also provided. Maps of precipitation needed to end or ameliorate a drought for those divisions currently experiencing drought are also available. Values are provided in all divisions with a monthly PHDI less than -2.0. Precipitation needed over periods from 1 month to 6 months is included as well as the associated probability of receiving that quantity of precipitation. These maps are replaced on a monthly basis with the values reflecting conditions in the previous month.
- Worst Case Scenario: the PHDI for the current month is estimated from observed temperature and precipitation through the current day and estimates for the rest of the month; climate normals are used to estimate the temperature for the rest of the month, but a "worst case scenario" of no precipitation is assumed for the rest of the month. These resulting monthly temperature and precipitation data are then used to compute the PHDI for the current month. It is expected that the "worst case scenario" PHDI will always be lower (more negative, or worse) than the PHDI computed using climate normals for the rest of the month.
- Projected Drought: the NOAA National Weather Service's Climate Prediction Center (CPC) produces official monthly and seasonal temperature and precipitation outlook products. This information was converted into projected monthly temperature and precipitation values for future months, then the projected values were used to compute projected future PHDI values. Specifically, the median forecasts of the CPC 3-month seasonal temperature and precipitation outlooks were converted into seasonal anomalies for the 102 CPC forecast regions using the CPC climatologies.
How to
What can I do with these data?
- Users can generate maps to show probability or the amount of precipitation to ameliorate or end a drought at different monthly scales.
- Drought Termination and Amelioration data available in: Current Drought Reduction, Worst Case Scenario and Project Drought
How do I use the site?
- Select from options in the drop down menus and then click “Submit”
- Use the links, above the product title, to navigate between: Overview, Current Drought Reduction, Worst Case Scenario and Project Drought
Access
Current Drought Termination and Amelioration: view maps and data of precipitation, associated probabilities, and percent of normal precipitation needed to end or ameliorate drought as it currently exists across the Contiguous U.S.
Worst Case Scenario Drought Termination and Amelioration: view maps and data of precipitation, associated probabilities, and percent of normal precipitation needed to end or ameliorate drought across the Contiguous U.S. assuming no precipitation for the remainder of the month
Projected Drought Termination and Amelioration: The NOAA National Weather Service’s Climate Prediction Center produces official monthly and seasonal temperature and precipitation outlook products. This information was converted into projected monthly temperature and precipitation values for future months, then the projected values were used to compute projected future PHDI values.