National Drought Status
Drought worsened for the third straight week in large parts of the Northern Plains and Upper Midwest. Heavy precipitation led to more improvements in the Eastern U.S. The West experienced a mix of drought improvements and degradations. As of July 28, 2026, 40.07% of the United States and Puerto Rico and 47.89% of the Lower 48 states are in drought.
U.S. Drought Monitor
U.S. Drought Monitor
D0 - Abnormally Dry
Abnormally Dry (D0) indicates a region that is going into or coming out of drought, according to the U.S. Drought Monitor. View typical impacts by state.
D1 – Moderate Drought
Moderate Drought (D1) is the first of four drought categories (D1–D4), according to the U.S. Drought Monitor. View typical impacts by state.
D2 – Severe Drought
Severe Drought (D2) is the second of four drought categories (D1–D4), according to the U.S. Drought Monitor. View typical impacts by state.
D3 – Extreme Drought
Extreme Drought (D3) is the third of four drought categories (D1–D4), according to the U.S. Drought Monitor. View typical impacts by state.
D4 – Exceptional Drought
Exceptional Drought (D4) is the most intense drought category, according to the U.S. Drought Monitor. View typical impacts by state.
Drought Change Since Last Week
3-Category Degradation
Drought/dryness has worsened by 3 categories, according to the U.S. Drought Monitor.
2-Category Degradation
Drought/dryness has worsened by 2 categories, according to the U.S. Drought Monitor.
1-Category Degradation
Drought/dryness has worsened by 1 category, according to the U.S. Drought Monitor.
No Change
There has been no change in drought conditions at this location.
1-Category Improvement
Drought/dryness has improved by 1 category, according to the U.S. Drought Monitor.
2-Category Improvement
Drought/dryness has improved by 2 categories, according to the U.S. Drought Monitor.
3-Category Improvement
Drought/dryness has improved by 3 categories, according to the U.S. Drought Monitor.
Drought Degradation
5-Category Degradation
Drought/dryness has worsened by 5 categories, according to the U.S. Drought Monitor.
4-Category Degradation
Drought/dryness has worsened by 4 categories, according to the U.S. Drought Monitor.
3-Category Degradation
Drought/dryness has worsened by 3 categories, according to the U.S. Drought Monitor.
2-Category Degradation
Drought/dryness has worsened by 2 categories, according to the U.S. Drought Monitor.
1-Category Degradation
Drought/dryness has worsened by 1 category, according to the U.S. Drought Monitor.
Drought Improvement
1-Category Improvement
Drought/dryness has improved by 1 category, according to the U.S. Drought Monitor.
2-Category Improvement
Drought/dryness has improved by 2 categories, according to the U.S. Drought Monitor.
3-Category Improvement
Drought/dryness has improved by 3 categories, according to the U.S. Drought Monitor.
4-Category Improvement
Drought/dryness has improved by 4 categories, according to the U.S. Drought Monitor.
5-Category Improvement
Drought/dryness has improved by 5 categories, according to the U.S. Drought Monitor.
The U.S. Drought Monitor is updated each Thursday to show the location and intensity of drought across the country, which uses a five-category system, from Abnormally Dry (D0) conditions to Exceptional Drought (D4).
The U.S. Drought Monitor is a joint effort of the National Drought Mitigation Center, U.S. Department of Agriculture, National Oceanic and Atmospheric Administration, and National Aeronautics and Space Administration. Authors from these agencies rotate creating the map each week, using both physical indicators and input from local observers.
The U.S. Drought Monitor 1-week change map shows where drought has improved, remained the same, or worsened since the previous week's Drought Monitor. Yellow/orange hues show areas where drought worsened, while green hues show drought improvement.
The U.S. Drought Monitor 4-week change map shows where drought has improved, remained the same, or worsened since the previous month's U.S. Drought Monitor.
The U.S. Drought Monitor depicts the location and intensity of drought across the country, using 5 classifications (D0–D4). Green hues show where conditions improved, yellow/orange hues show where conditions worsened, and gray areas show where drought remained the same.
The U.S. Drought Monitor is released every Thursday morning, with data valid through Tuesday at 7am Eastern.
U.S. Drought Monitor change maps are released every Thursday morning, with data valid through Tuesday at 7 am Eastern.
U.S. Drought Monitor change maps are released every Thursday morning, with data valid through Tuesday at 7 a.m. EST.
A drought index combines multiple drought indicators (e.g., precipitation, temperature, soil moisture) to depict drought conditions. For some products, like the U.S. Drought Monitor, authors combine their analysis of drought indicators with input from local observers. Other drought indices, like the Standardized Precipitation Index (SPI), use an objective calculation to describe the severity, location, timing, and/or duration of drought.
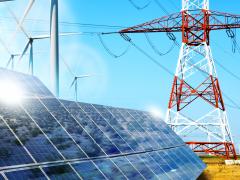
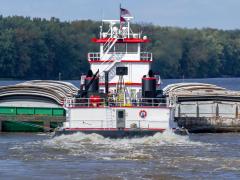
Learn MorePeriods of drought can lead to inadequate water supply, threatening the health, safety, and welfare of communities. Streamflow, groundwater, reservoir, and snowpack data are key to monitoring and forecasting water supply.
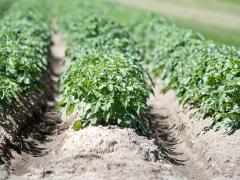
Learn MoreDrought can reduce the water availability and water quality necessary for productive farms, ranches, and grazing lands, resulting in significant negative direct and indirect economic impacts to the agricultural sector. Monitoring agricultural drought typically focuses on examining levels of precipitation, evaporative demand, soil moisture, and surface/groundwater quantity and quality.
Learn MoreA drought index combines multiple drought indicators (e.g., precipitation, temperature, soil moisture) to depict drought conditions. For some products, like the U.S. Drought Monitor, authors combine their analysis of drought indicators with input from local observers. Other drought indices, like the Standardized Precipitation Index (SPI), use an objective calculation to describe the severity, location, timing, and/or duration of drought.
Learn MorePeriods of drought can lead to inadequate water supply, threatening the health, safety, and welfare of communities. Streamflow, groundwater, reservoir, and snowpack data are key to monitoring and forecasting water supply.
Learn MoreDrought can reduce the water availability and water quality necessary for productive farms, ranches, and grazing lands, resulting in significant negative direct and indirect economic impacts to the agricultural sector. Monitoring agricultural drought typically focuses on examining levels of precipitation, evaporative demand, soil moisture, and surface/groundwater quantity and quality.
Learn MorePrecipitation Conditions
Inches of Precipitation
This location received less than 0.01 inch of precipitation during this 7-day period.
This location received 0.01–0.5 inch of precipitation during this 7-day period.
This location received 0.5–1 inch of precipitation during this 7-day period.
This location received 1–2 inches of precipitation during this 7-day period.
This location received 2–4 inches of precipitation during this 7-day period.
This location received 4–6 inches of precipitation during this 7-day period.
This location received 6–8 inches of precipitation during this 7-day period.
This location received more than 8 inches of precipitation during this 7-day period.
Precipitation Shown as a Percentage of Normal Conditions
<25% of Normal
Precipitation was only 0% to 25% of the historical average for this location, compared to the same date range from 1991–2020.
25%–50% of Normal
Precipitation was 25% to 50% of the historical average for this location, compared to the same date range from 1991–2020.
50%–75% of Normal
Precipitation was 50% to 75% of the historical average for this location, compared to the same date range from 1991–2020.
75%–100% of Normal
Precipitation was 75% to 100% of the historical average for this location, compared to the same date range from 1991–2020.
100%–150% of Normal
Precipitation was 100% to 150% of the historical average for this location, compared to the same date range from 1991–2020.
150%–200% of Normal
Precipitation was 150% to 200% of the historical average for this location, compared to the same date range from 1991–2020.
200%–300% of Normal
Precipitation was 200% to 300% of the historical average for this location, compared to the same date range from 1991–2020.
>300% of Normal
Precipitation was greater than 300% of the historical average for this location, compared to the same date range from 1991–2020.
This map shows total precipitation (in inches) for the past 7 days. Dark blue shades indicate the highest precipitation amounts.
This map shows precipitation for the past 30 days as a percentage of the historical average (1991–2020) for the same time period. Green/blue shades indicate above-normal precipitation, while brown shades indicate below-normal precipitation.
This map shows precipitation for the past 60 days as a percentage of the historical average (1991–2020) for the same time period. Green/blue shades indicate above-normal precipitation, while brown shades indicate below-normal precipitation.
Precipitation data are updated daily, with a delay of 3 to 4 days to allow for data collection and quality control.
Precipitation data are updated daily, with a delay of 3 to 4 days to allow for data collection and quality control.
Precipitation data are updated daily, with a delay of 3 to 4 days to allow for data collection and quality control.
Drought is defined as the lack of precipitation over an extended period of time, usually for a season or more, that results in a water shortage. Changes in precipitation can substantially disrupt crops and livestock, influence the frequency and intensity of severe weather events, and affect the quality and quantity of water available for municipal and industrial use.
Learn MorePeriods of drought can lead to inadequate water supply, threatening the health, safety, and welfare of communities. Streamflow, groundwater, reservoir, and snowpack data are key to monitoring and forecasting water supply.
Learn MoreDrought can reduce the water availability and water quality necessary for productive farms, ranches, and grazing lands, resulting in significant negative direct and indirect economic impacts to the agricultural sector. Monitoring agricultural drought typically focuses on examining levels of precipitation, evaporative demand, soil moisture, and surface/groundwater quantity and quality.
Learn MoreDrought is defined as the lack of precipitation over an extended period of time, usually for a season or more, that results in a water shortage. Changes in precipitation can substantially disrupt crops and livestock, influence the frequency and intensity of severe weather events, and affect the quality and quantity of water available for municipal and industrial use.
Learn MorePeriods of drought can lead to inadequate water supply, threatening the health, safety, and welfare of communities. Streamflow, groundwater, reservoir, and snowpack data are key to monitoring and forecasting water supply.
Learn MoreDrought can reduce the water availability and water quality necessary for productive farms, ranches, and grazing lands, resulting in significant negative direct and indirect economic impacts to the agricultural sector. Monitoring agricultural drought typically focuses on examining levels of precipitation, evaporative demand, soil moisture, and surface/groundwater quantity and quality.
Learn MoreTemperature Conditions
Maximum Temperature (°F)
<0°F
The 7-day average daily maximum temperature is below 0°F.
0–10°F
The 7-day average daily maximum temperature is between 0–10°F.
10–20°F
The 7-day average daily maximum temperature is between 10–20°F.
20–30°F
The 7-day average daily maximum temperature is between 20–30°F.
30–40°F
The 7-day average daily maximum temperature is between 30–40°F.
40–60°F
The 7-day average daily maximum temperature is between 40–60°F.
60–70°F
The 7-day average daily maximum temperature is between 60–70°F.
70–80°F
The 7-day average daily maximum temperature is between 70–80°F.
80–90°F
The 7-day average daily maximum temperature is between 80–90°F.
90–100°F
The 7-day average daily maximum temperature is between 90–100°F.
>100°F
The 7-day average daily maximum temperature is between greater than 100°F.
Departure from Normal Max Temperature (°F)
>8°F Below Normal
The average maximum temperature was more than 8°F colder than normal for this location.
6–8°F Below Normal
The average maximum temperature was 6–8°F colder than normal for this location.
4–6°F Below Normal
The average maximum temperature was 4–6°F colder than normal for this location.
3–4°F Below Normal
The average maximum temperature was 3–4°F colder than normal for this location.
1–3°F Below Normal
The average maximum temperature was 1–3°F colder than normal for this location.
0–1°F Below Normal
The average maximum temperature was 0–1°F colder than normal for this location.
0–1°F Above Normal
The average maximum temperature was 0–1°F warmer than normal for this location.
1–3°F Above Normal
The average maximum temperature was 1–3°F warmer than normal for this location.
3–4°F Above Normal
The average maximum temperature was 3–4°F warmer than normal for this location.
4–6°F Above Normal
The average maximum temperature was 4–6°F warmer than normal for this location.
6–8°F Above Normal
The average maximum temperature was 6–8°F warmer than normal for this location.
>8°F Above Normal
The average maximum temperature was more than 8°F warmer than normal for this location.
This map shows the average maximum daily temperature (°F) for the last 7 days. Blue hues indicate cooler temperatures, while red hues indicate warmer temperatures.
This map shows the average maximum daily temperature for the past 7 days compared to the historical average (1991–2020) for the same 7 days. Negative values (blue hues) indicate colder than normal temperatures, and positive values (red hues) indicate warmer than normal temperatures.
This map shows the average maximum daily temperature for the past 30 days compared to the historical average (1991–2020) for the same 30 days. Negative values (blue hues) indicate colder than normal temperatures, and positive values (red hues) indicate warmer than normal temperatures.
Temperature data are updated daily, with a delay of 3 to 4 days to allow for data collection and quality control.
Temperature data are updated daily, with a delay of 3 to 4 days to allow for data collection and quality control.
Temperature data are updated daily, with a delay of 3 to 4 days to allow for data collection and quality control.
Air temperature can have wide-ranging effects on natural processes. Warmer air temperatures increase evapotranspiration—which is the combination of evaporation from the soil and bodies of water and transpiration from plants—and lower soil moisture.
Learn MoreDrought can reduce the water availability and water quality necessary for productive farms, ranches, and grazing lands, resulting in significant negative direct and indirect economic impacts to the agricultural sector. Monitoring agricultural drought typically focuses on examining levels of precipitation, evaporative demand, soil moisture, and surface/groundwater quantity and quality.
Learn MoreAir temperature can have wide-ranging effects on natural processes. Warmer air temperatures increase evapotranspiration—which is the combination of evaporation from the soil and bodies of water and transpiration from plants—and lower soil moisture.
Learn MoreDrought can reduce the water availability and water quality necessary for productive farms, ranches, and grazing lands, resulting in significant negative direct and indirect economic impacts to the agricultural sector. Monitoring agricultural drought typically focuses on examining levels of precipitation, evaporative demand, soil moisture, and surface/groundwater quantity and quality.
Learn MoreSoil Moisture Conditions: 1 Meter (100 cm) Depth
0–100 cm Soil Moisture Percentile
0–2nd Percentile
Soil moisture at 0–100cm depth is in the bottom 2% (0–2nd percentile) of historical measurements for this day of the year. Learn more.
2nd–5th Percentile
Soil moisture at 0–100cm depth falls between the 2nd to 5th percentile of historical measurements for this day of the year. Learn more.
5th–10th Percentile
Soil moisture at 0–100cm depth falls between the 5th to 10th percentile of historical measurements for this day of the year. Learn more.
10th–20th Percentile
Soil moisture at 0–100cm depth falls between the 10th to 20th percentile of historical measurements for this day of the year. Learn more.
20th–30th Percentile
Soil moisture at 0–100cm depth falls between the 20th to 30th percentile of historical measurements for this day of the year. Learn more.
30th–70th Percentile
Soil moisture at 0–100cm depth falls between the 30th to 70th percentile of historical measurements for this day of the year. Learn more.
70th–80th Percentile
Soil moisture at 0–100cm depth falls between the 70th to 80th percentile of historical measurements for this day of the year. Learn more.
80th–90th Percentile
Soil moisture at 0–100cm depth falls between the 80th to 90th percentile of historical measurements for this day of the year. Learn more.
90th–95th Percentile
Soil moisture at 0–100cm depth falls between the 90th to 95th percentile of historical measurements for this day of the year. Learn more.
95th–98th Percentile
Soil moisture at 0–100cm depth falls between the 95th to 98th percentile of historical measurements for this day of the year. Learn more.
98th–100th Percentile
Soil moisture at 0–100cm depth is in the top 2% (98th to 100th percentile) of historical measurements for this day of the year. Learn more.
Root Zone Soil Moisture: Wetness Percentile
An accurate depiction of soil moisture conditions can provide valuable insights for agricultural monitoring, weather prediction, and drought and flood early warning.
This map shows the moisture content of the top 1 meter of soil compared to historical conditions from 1981–2013, based on NASA's Short-term Prediction and Transition Center – Land Information System (SPoRT-LIS).
Red and orange hues indicate drier soils, while greens and blues indicate greater soil moisture.
The GRACE-Based Root Zone Soil Moisture Drought Indicator describes the current wet or dry conditions of the top 1 meter of soil, expressed as a percentile showing the probability of occurrence within the period of record from 1948 to 2014. This product is based on terrestrial water storage observations derived from NASA GRACE satellite data and integrated with other observations, using a sophisticated numerical model of land surface water and energy processes.
Red and orange hues indicate drier soil moisture conditions, while blue hues indicate wetter conditions.
This map updates daily with data from NASA's Short-term Prediction and Transition Center – Land Information System (SPoRT-LIS).
Data from NASA GRACE are updated weekly on Mondays, and this Drought.gov map is updated every Tuesday.
Soil moisture plays an important role in drought and flood forecasting, agricultural monitoring, forest fire prediction, water supply management, and other natural resource activities. Soil moisture observations can forewarn of impending drought or flood conditions before other more standard indicators are triggered.
Learn MoreFlash drought is the rapid onset or intensification of drought. Unlike slow-evolving drought, which is caused by a decline in precipitation, flash drought occurs when low precipitation is accompanied by abnormally high temperatures, high winds, and/or changes in radiation. These sometimes-rapid changes can quickly raise evapotranspiration rates and remove available water from the landscape.
Learn MoreDrought can reduce the water availability and water quality necessary for productive farms, ranches, and grazing lands, resulting in significant negative direct and indirect economic impacts to the agricultural sector. Monitoring agricultural drought typically focuses on examining levels of precipitation, evaporative demand, soil moisture, and surface/groundwater quantity and quality.
Learn MoreDrought can result in reduced growth rates, increased stress on vegetation, and alterations or transformations to the plant community and/or the entire ecosystem. During periods of drought, plants increase their demand for water through increased evapotranspiration and longer growing seasons.
Learn MoreSoil moisture plays an important role in drought and flood forecasting, agricultural monitoring, forest fire prediction, water supply management, and other natural resource activities. Soil moisture observations can forewarn of impending drought or flood conditions before other more standard indicators are triggered.
Learn MoreFlash drought is the rapid onset or intensification of drought. Unlike slow-evolving drought, which is caused by a decline in precipitation, flash drought occurs when low precipitation is accompanied by abnormally high temperatures, high winds, and/or changes in radiation. These sometimes-rapid changes can quickly raise evapotranspiration rates and remove available water from the landscape.
Learn MoreDrought can reduce the water availability and water quality necessary for productive farms, ranches, and grazing lands, resulting in significant negative direct and indirect economic impacts to the agricultural sector. Monitoring agricultural drought typically focuses on examining levels of precipitation, evaporative demand, soil moisture, and surface/groundwater quantity and quality.
Learn MoreDrought can result in reduced growth rates, increased stress on vegetation, and alterations or transformations to the plant community and/or the entire ecosystem. During periods of drought, plants increase their demand for water through increased evapotranspiration and longer growing seasons.
Learn Moreof the U.S. is in drought this week.
acres of crops in U.S. are experiencing drought conditions this week.
people in the U.S. are affected by drought this week.
U.S. states are experiencing Moderate Drought (D1) or worse this week.
Official NOAA U.S. Drought Outlooks
Drought Is Predicted To...
Drought Persists
During this time period, NOAA's Climate Prediction Center predicts that drought conditions will persist.
Drought Improves
During this time period, NOAA's Climate Prediction Center predicts that existing drought conditions will improve (but not be removed).
Drought Is Removed
During this time period, NOAA's Climate Prediction Center predicts that drought will be removed.
Drought Develops
During this time period, NOAA's Climate Prediction Center predicts that drought will develop.
No Drought Present
According to NOAA's Climate Prediction Center, there is no drought, and is drought development is not predicted.
The Monthly Drought Outlook predicts whether drought will develop, remain, improve, or be removed in the next calendar month.
The Seasonal Drought Outlook predicts whether drought will develop, remain, improve, or be removed in the next 3 months or so.
The Climate Prediction Center issues its Monthly Drought Outlooks on the last day of the calendar month.
The Climate Prediction Center issues its Seasonal Drought Outlooks on the third Thursday of each calendar month. Sometimes, the map is adjusted on the last day of the month to maintain consistency with the Monthly Drought Outlook.
Snow drought is a period of abnormally low snowpack for the time of year. Snowpack typically acts as a natural reservoir, providing water throughout the drier summer months. Lack of snowpack storage, or a shift in timing of snowmelt, can be a challenge for drought planning.
Learn MorePeriods of drought can lead to inadequate water supply, threatening the health, safety, and welfare of communities. Streamflow, groundwater, reservoir, and snowpack data are key to monitoring and forecasting water supply.
Learn MoreDrought can reduce the water availability and water quality necessary for productive farms, ranches, and grazing lands, resulting in significant negative direct and indirect economic impacts to the agricultural sector. Monitoring agricultural drought typically focuses on examining levels of precipitation, evaporative demand, soil moisture, and surface/groundwater quantity and quality.
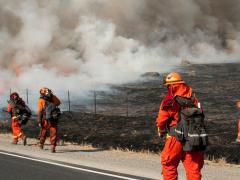
Learn MoreDuring drought conditions, fuels for wildfire, such as grasses and trees, can dry out and become more flammable. Drought can also increase the probability of ignition and the rate at which fire spreads. Temperature, soil moisture, humidity, wind speed, and fuel availability (vegetation) are all factors that interact to influence the frequency of large wildfires.
Learn MoreSnow drought is a period of abnormally low snowpack for the time of year. Snowpack typically acts as a natural reservoir, providing water throughout the drier summer months. Lack of snowpack storage, or a shift in timing of snowmelt, can be a challenge for drought planning.
Learn MorePeriods of drought can lead to inadequate water supply, threatening the health, safety, and welfare of communities. Streamflow, groundwater, reservoir, and snowpack data are key to monitoring and forecasting water supply.
Learn MoreDrought can reduce the water availability and water quality necessary for productive farms, ranches, and grazing lands, resulting in significant negative direct and indirect economic impacts to the agricultural sector. Monitoring agricultural drought typically focuses on examining levels of precipitation, evaporative demand, soil moisture, and surface/groundwater quantity and quality.
Learn MoreDuring drought conditions, fuels for wildfire, such as grasses and trees, can dry out and become more flammable. Drought can also increase the probability of ignition and the rate at which fire spreads. Temperature, soil moisture, humidity, wind speed, and fuel availability (vegetation) are all factors that interact to influence the frequency of large wildfires.
Learn MoreOfficial NOAA Temperature Outlooks
Probability of Below-Normal Temperatures
33%–40% Chance of Below Normal
There is an 33%–40% chance of below-normal temperatures during this period.
40%–50% Chance of Below Normal
There is an 40%–50% chance of below-normal temperatures during this period.
50%–60% Chance of Below Normal
There is an 50%–60% chance of below-normal temperatures during this period.
60%–70% Chance of Below Normal
There is an 60%–70% chance of below-normal temperatures during this period.
70%–80% Chance of Below Normal
There is an 70%–80% chance of below-normal temperatures during this period.
80%–90% Chance of Below Normal
There is an 80%–90% chance of below-normal temperatures during this period.
>90% Chance of Below Normal
There is a >90% chance of below-normal temperatures during this period.
Probability of Above-Normal Temperatures
33%–40% Chance of Above Normal
There is an 33%–40% chance of above-normal temperatures during this period.
40%–50% Chance of Above Normal
There is an 40%–50% chance of above-normal temperatures during this period.
50%–60% Chance of Above Normal
There is an 50%–60% chance of above-normal temperatures during this period.
60%–70% Chance of Above Normal
There is an 60%–70% chance of above-normal temperatures during this period.
70%–80% Chance of Above Normal
There is an 70%–80% chance of above-normal temperatures during this period.
80%–90% Chance of Above Normal
There is an 80%–90% chance of above-normal temperatures during this period.
>90% Chance of Above Normal
There is a >90% chance of above-normal temperatures during this period.
Near-Normal
Odds favor near-normal temperatures during this period.
Probability of Below-Normal Temperatures
33%–40% Chance of Below Normal
There is an 33%–40% chance of below-normal temperatures during this period.
40%–50% Chance of Below Normal
There is an 40%–50% chance of below-normal temperatures during this period.
50%–60% Chance of Below Normal
There is an 50%–60% chance of below-normal temperatures during this period.
60%–70% Chance of Below Normal
There is an 60%–70% chance of below-normal temperatures during this period.
70%–80% Chance of Below Normal
There is an 70%–80% chance of below-normal temperatures during this period.
80%–90% Chance of Below Normal
There is an 80%–90% chance of below-normal temperatures during this period.
>90% Chance of Below Normal
There is a >90% chance of below-normal temperatures during this period.
Probability of Above-Normal Temperatures
33%–40% Chance of Above Normal
There is an 33%–40% chance of above-normal temperatures during this period.
40%–50% Chance of Above Normal
There is an 40%–50% chance of above-normal temperatures during this period.
50%–60% Chance of Above Normal
There is an 50%–60% chance of above-normal temperatures during this period.
60%–70% Chance of Above Normal
There is an 60%–70% chance of above-normal temperatures during this period.
70%–80% Chance of Above Normal
There is an 70%–80% chance of above-normal temperatures during this period.
80%–90% Chance of Above Normal
There is an 80%–90% chance of above-normal temperatures during this period.
>90% Chance of Above Normal
There is a >90% chance of above-normal temperatures during this period.
Probability of Near-Normal Temperatures
33%–40% of Near Normal
There is an 33%–40% chance of near-normal temperatures during this period.
40%–50% of Near Normal
There is an 40%–50% chance of near-normal temperatures during this period.
This map shows the probability (percent chance) of above-normal, near-normal, or below-normal temperatures 6 to 10 days in the future.
This map shows the probability (percent chance) of above-normal (red hues) or below-normal (blue hues) temperatures over the next calendar month. White areas indicates equal chances of above- or below-normal temperatures.
This map shows the probability (percent chance) of above-normal (red hues) or below-normal (blue hues) temperatures over the next three months. White areas indicates equal chances of above- or below-normal temperatures.
The Climate Prediction Center updates their 6–10 day outlooks daily.
The Climate Prediction Center updates their monthly temperature outlook on the third Thursday of each calendar month and again on the last day of each calendar month.
The Climate Prediction Center updates their seasonal temperature outlook on the third Thursday of each calendar month.
Air temperature can have wide-ranging effects on natural processes. Warmer air temperatures increase evapotranspiration—which is the combination of evaporation from the soil and bodies of water and transpiration from plants—and lower soil moisture.
Learn MoreFlash drought is the rapid onset or intensification of drought. Unlike slow-evolving drought, which is caused by a decline in precipitation, flash drought occurs when low precipitation is accompanied by abnormally high temperatures, high winds, and/or changes in radiation. These sometimes-rapid changes can quickly raise evapotranspiration rates and remove available water from the landscape.
Learn MoreAir temperature can have wide-ranging effects on natural processes. Warmer air temperatures increase evapotranspiration—which is the combination of evaporation from the soil and bodies of water and transpiration from plants—and lower soil moisture.
Learn MoreSnow drought is a period of abnormally low snowpack for the time of year. Snowpack typically acts as a natural reservoir, providing water throughout the drier summer months. Lack of snowpack storage, or a shift in timing of snowmelt, can be a challenge for drought planning.
Learn MoreDrought can reduce the water availability and water quality necessary for productive farms, ranches, and grazing lands, resulting in significant negative direct and indirect economic impacts to the agricultural sector. Monitoring agricultural drought typically focuses on examining levels of precipitation, evaporative demand, soil moisture, and surface/groundwater quantity and quality.
Learn MoreOfficial NOAA Precipitation Outlooks
Probability of Below-Normal Precipitation
33%–40% Chance of Below Normal
There is an 33%–40% chance of below-normal precipitation during this period.
40%–50% Chance of Below Normal
There is an 40%–50% chance of below-normal precipitation during this period.
50%–60% Chance of Below Normal
There is an 50%–60% chance of below-normal precipitation during this period.
60%–70% Chance of Below Normal
There is an 60%–70% chance of below-normal precipitation during this period.
70%–80% Chance of Below Normal
There is an 70%–80% chance of below-normal precipitation during this period.
80%–90% Chance of Below Normal
There is an 80%–90% chance of below-normal precipitation during this period.
>90% Chance of Below Normal
There is a >90% chance of below-normal precipitation during this period.
Probability of Above-Normal Precipitation
33%–40% Chance of Above Normal
There is an 33%–40% chance of above-normal precipitation during this period.
40%–50% Chance of Above Normal
There is an 40%–50% chance of above-normal precipitation during this period.
50%–60% Chance of Above Normal
There is an 50%–60% chance of above-normal precipitation during this period.
60%–70% Chance of Above Normal
There is an 60%–70% chance of above-normal precipitation during this period.
70%–80% Chance of Above Normal
There is an 70%–80% chance of above-normal precipitation during this period.
80%–90% Chance of Above Normal
There is an 80%–90% chance of above-normal precipitation during this period.
>90% Chance of Above Normal
There is a >90% chance of above-normal precipitation during this period.
Near-Normal
Odds favor near-normal precipitation during this period.
Probability of Below-Normal Precipitation
33%–40% Chance of Below Normal
There is an 33%–40% chance of below-normal precipitation during this period.
40%–50% Chance of Below Normal
There is an 40%–50% chance of below-normal precipitation during this period.
50%–60% Chance of Below Normal
There is an 50%–60% chance of below-normal precipitation during this period.
60%–70% Chance of Below Normal
There is an 60%–70% chance of below-normal precipitation during this period.
70%–80% Chance of Below Normal
There is an 70%–80% chance of below-normal precipitation during this period.
80%–90% Chance of Below Normal
There is an 80%–90% chance of below-normal precipitation during this period.
>90% Chance of Below Normal
There is a >90% chance of below-normal precipitation during this period.
Probability of Above-Normal Precipitation
33%–40% Chance of Above Normal
There is an 33%–40% chance of above-normal precipitation during this period.
40%–50% Chance of Above Normal
There is an 40%–50% chance of above-normal precipitation during this period.
50%–60% Chance of Above Normal
There is an 50%–60% chance of above-normal precipitation during this period.
60%–70% Chance of Above Normal
There is an 60%–70% chance of above-normal precipitation during this period.
70%–80% Chance of Above Normal
There is an 70%–80% chance of above-normal precipitation during this period.
80%–90% Chance of Above Normal
There is an 80%–90% chance of above-normal precipitation during this period.
>90% Chance of Above Normal
There is a >90% chance of above-normal precipitation during this period.
Probability of Near-Normal Precipitation
33%–40% of Near Normal
There is an 33%–40% chance of near-normal precipitation during this period.
40%–50% of Near Normal
There is an 40%–50% chance of near-normal precipitation during this period.
This map shows the probability (percent chance) of above-normal, near-normal, or below-normal precipitation 6 to 10 days in the future.
This map shows the probability (percent chance) of above-normal (green hues) or below-normal (brown hues) precipitation over the next calendar month. White areas indicates equal chances of above- or below-normal precipitation.
This map shows the probability (percent chance) of above-normal (green hues) or below-normal (brown hues) precipitation over the next three months. White areas indicates equal chances of above- or below-normal precipitation.
The Climate Prediction Center updates their 6–10 day precipitation outlook daily.
The Climate Prediction Center updates their monthly precipitation outlook on the third Thursday of each calendar month and again on the last day of each calendar month.
The Climate Prediction Center updates their seasonal precipitation outlook on the third Thursday of each calendar month.
Drought is defined as the lack of precipitation over an extended period of time, usually for a season or more, that results in a water shortage. Changes in precipitation can substantially disrupt crops and livestock, influence the frequency and intensity of severe weather events, and affect the quality and quantity of water available for municipal and industrial use.
Learn MoreFlash drought is the rapid onset or intensification of drought. Unlike slow-evolving drought, which is caused by a decline in precipitation, flash drought occurs when low precipitation is accompanied by abnormally high temperatures, high winds, and/or changes in radiation. These sometimes-rapid changes can quickly raise evapotranspiration rates and remove available water from the landscape.
Learn MorePeriods of drought can lead to inadequate water supply, threatening the health, safety, and welfare of communities. Streamflow, groundwater, reservoir, and snowpack data are key to monitoring and forecasting water supply.
Learn MoreDrought can reduce the water availability and water quality necessary for productive farms, ranches, and grazing lands, resulting in significant negative direct and indirect economic impacts to the agricultural sector. Monitoring agricultural drought typically focuses on examining levels of precipitation, evaporative demand, soil moisture, and surface/groundwater quantity and quality.
Learn MoreDrought is defined as the lack of precipitation over an extended period of time, usually for a season or more, that results in a water shortage. Changes in precipitation can substantially disrupt crops and livestock, influence the frequency and intensity of severe weather events, and affect the quality and quantity of water available for municipal and industrial use.
Learn MoreSnow drought is a period of abnormally low snowpack for the time of year. Snowpack typically acts as a natural reservoir, providing water throughout the drier summer months. Lack of snowpack storage, or a shift in timing of snowmelt, can be a challenge for drought planning.
Learn MorePeriods of drought can lead to inadequate water supply, threatening the health, safety, and welfare of communities. Streamflow, groundwater, reservoir, and snowpack data are key to monitoring and forecasting water supply.
Learn MoreDrought can reduce the water availability and water quality necessary for productive farms, ranches, and grazing lands, resulting in significant negative direct and indirect economic impacts to the agricultural sector. Monitoring agricultural drought typically focuses on examining levels of precipitation, evaporative demand, soil moisture, and surface/groundwater quantity and quality.
Learn MoreDuring drought conditions, fuels for wildfire, such as grasses and trees, can dry out and become more flammable. Drought can also increase the probability of ignition and the rate at which fire spreads. Temperature, soil moisture, humidity, wind speed, and fuel availability (vegetation) are all factors that interact to influence the frequency of large wildfires.
Learn MoreOfficial NOAA Precipitation Forecast
Predicted Inches of Precipitation
Less than 0.01 inch
0.01 to 0.1 inch
0.1 to 0.25 inch
0.25 to 0.5 inch
0.5 to 0.75 inch
0.75 to 1 inch
1 to 1.25 inches
1.25 to 1.5 inches
1.5 to 1.75 inches
1.75 to 2 inches
1.5 to 2 inches
2 to 2.5 inches
2.5 to 3 inches
3 to 4 inches
4 to 5 inches
5 to 7 inches
7 to 10 inches
10 to 15 inches
15 to 20 inches
More than 20 inches
This map shows the amount of liquid precipitation (in inches) expected to fall over the next 1 day, according to the National Weather Service.
This map shows the amount of liquid precipitation (in inches) expected to fall over the next 7 days, according to the National Weather Service.
The Quantitative Precipitation Forecast maps on Drought.gov are updated once a day and are valid from 7 a.m. Eastern that day.
The Quantitative Precipitation Forecast maps on Drought.gov are updated once a day and are valid from 7 a.m. Eastern that day.
Drought is defined as the lack of precipitation over an extended period of time, usually for a season or more, that results in a water shortage. Changes in precipitation can substantially disrupt crops and livestock, influence the frequency and intensity of severe weather events, and affect the quality and quantity of water available for municipal and industrial use.
Learn MoreFlash drought is the rapid onset or intensification of drought. Unlike slow-evolving drought, which is caused by a decline in precipitation, flash drought occurs when low precipitation is accompanied by abnormally high temperatures, high winds, and/or changes in radiation. These sometimes-rapid changes can quickly raise evapotranspiration rates and remove available water from the landscape.
Learn MoreDrought can reduce the water availability and water quality necessary for productive farms, ranches, and grazing lands, resulting in significant negative direct and indirect economic impacts to the agricultural sector. Monitoring agricultural drought typically focuses on examining levels of precipitation, evaporative demand, soil moisture, and surface/groundwater quantity and quality.
Learn MoreDrought is defined as the lack of precipitation over an extended period of time, usually for a season or more, that results in a water shortage. Changes in precipitation can substantially disrupt crops and livestock, influence the frequency and intensity of severe weather events, and affect the quality and quantity of water available for municipal and industrial use.
Learn MoreFlash drought is the rapid onset or intensification of drought. Unlike slow-evolving drought, which is caused by a decline in precipitation, flash drought occurs when low precipitation is accompanied by abnormally high temperatures, high winds, and/or changes in radiation. These sometimes-rapid changes can quickly raise evapotranspiration rates and remove available water from the landscape.
Learn MoreDrought can reduce the water availability and water quality necessary for productive farms, ranches, and grazing lands, resulting in significant negative direct and indirect economic impacts to the agricultural sector. Monitoring agricultural drought typically focuses on examining levels of precipitation, evaporative demand, soil moisture, and surface/groundwater quantity and quality.
Learn MoreExplore National Drought Impacts by Sector


Tell us how drought is impacting your community by submitting a condition monitoring report. Your submissions help us better understand how drought is affecting local conditions.