Snow Drought
Snowpack typically acts as a natural reservoir, providing water throughout the drier summer months. Lack of snowpack storage, or a shift in timing of snowmelt from that reservoir, can be a challenge for drought planning. Snow drought is a period of abnormally little snowpack for the time of year. Recent research shows that the western U.S. has emerged as a global snow drought “hotspot,” where snow droughts became more prevalent, intensified, and lengthened in the second half of the period 1980 to 2018.
Types of Snow Drought
There are two types of snow drought based on the AMS Glossary of Meteorology:
Below-normal cold-season precipitation
A lack of snow accumulation despite near-normal precipitation, caused by warm temperatures and precipitation falling as rain rather than snow or unusually early snowmelt.
Data, Maps, and Tools
Few drought metrics include storage and release of snow water. Several years of low snowpack, especially across the western U.S., have led to studies examining the causes and impacts of reduced snow storage and seeking a new definition for snow drought.
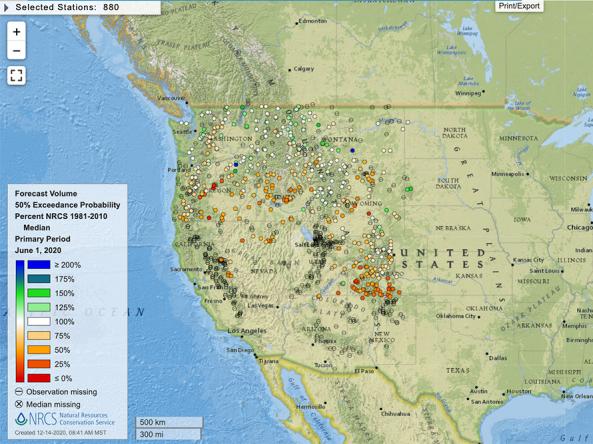
This map shows snow water equivalent (SWE)—the amount of liquid water in the snowpack—compared to past conditions. SWE is shown as a percentage of the 1991–2020 median for HUC6 watersheds across the western U.S., based on measurements from Snow Telemetry (SNOTEL) stations. Yellow to red hues indicate below-normal SWE, while blue hues indicate above-normal SWE.
View an interactive version of this map for the latest information from the USDA Natural Resources Conservation Service.
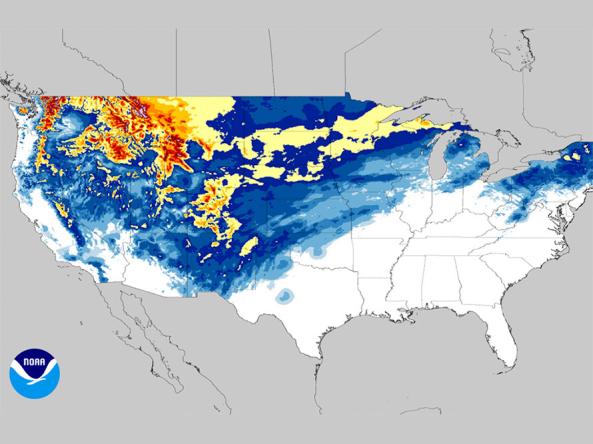
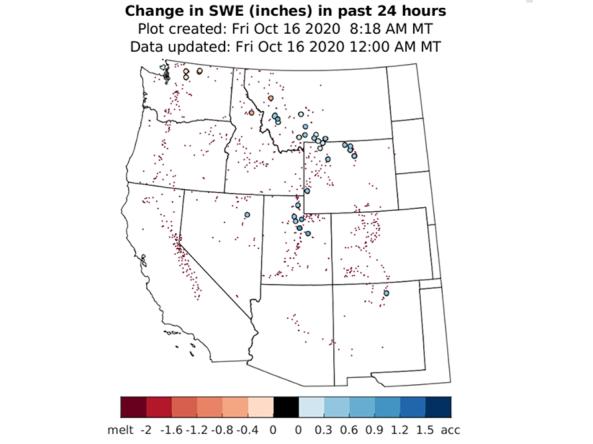
This map shows SNODAS snow water equivalent (SWE, the amount of liquid water contained within snowpack) for the past two days, as a percentage of the 2004–2021 average. The SNOw Data Assimilation System (SNODAS) is a modeling and data assimilation system developed by NOAA's National Operational Hydrologic Remote Sensing Center (NOHRSC) to provide the best possible estimates of snow cover and associated parameters to support hydrologic modeling and analysis.
Drought is defined as the lack of precipitation over an extended period of time, usually for a season or more, that results in a water shortage. Changes in precipitation can substantially disrupt crops and livestock, influence the frequency and intensity of severe weather events, and affect the quality and quantity of water available for municipal and industrial use.
Learn MoreSnow drought is a period of abnormally low snowpack for the time of year. Snowpack typically acts as a natural reservoir, providing water throughout the drier summer months. Lack of snowpack storage, or a shift in timing of snowmelt, can be a challenge for drought planning.
Learn MorePeriods of drought can lead to inadequate water supply, threatening the health, safety, and welfare of communities. Streamflow, groundwater, reservoir, and snowpack data are key to monitoring and forecasting water supply.
Learn MoreIn a drought, lower water levels or snowpack can affect the availability of recreational activities and associated tourism, and a resulting loss of revenue can severely impact supply chains and the economy. Drought—as well as negative perceptions of drought, fire bans, or wildfires—may also result in decreased visitations, cancellations in hotel stays, a reduction in booked holidays, or reduced merchandise sales.
Learn MorePercent of Median Snow Water Equivalent
< 50% of Median
Current snow water equivalent (SWE) is less than 50% of the median SWE value for this day of the year, compared to historical conditions from 1991–2020.
50%–70% of Median
Current snow water equivalent (SWE) is between 50%–70% of the median SWE value for this day of the year, compared to historical conditions from 1991–2020.
70%–90% of Median
Current snow water equivalent (SWE) is between 70%–90% of the median SWE value for this day of the year, compared to historical conditions from 1991–2020.
90%–110% of Median
Current snow water equivalent (SWE) is between 90%–110% of the median SWE value for this day of the year, compared to historical conditions from 1991–2020.
110%–130% of Median
Current snow water equivalent (SWE) is between 110%–130% of the median SWE value for this day of the year, compared to historical conditions from 1991–2020.
130%–150% of Median
Current snow water equivalent (SWE) is between 130%–150% of the median SWE value for this day of the year, compared to historical conditions from 1991–2020.
>150% of Median
Current snow water equivalent (SWE) is greater than 150% of the median SWE value for this day of the year, compared to historical conditions from 1991–2020.
SWE Percent of 2004–2021 Average
Trace or No Snow
Current snow water equivalent (SWE) is less than 0.01% of the average SWE value for this two-day period, compared to historical conditions from 2004–2021.
0.01%–5% of Average SWE
Current snow water equivalent (SWE) is between 0.01%–5% of the average SWE value for this two-day period, compared to historical conditions from 2004–2021.
5%–25% of Average SWE
Current snow water equivalent (SWE) is between 5%–25% of the average SWE value for this two-day period, compared to historical conditions from 2004–2021.
25%–50% of Average SWE
Current snow water equivalent (SWE) is between 25%–50% of the average SWE value for this two-day period, compared to historical conditions from 2004–2021.
50%–70% of Average SWE
Current snow water equivalent (SWE) is between 50%–70% of the average SWE value for this two-day period, compared to historical conditions from 2004–2021.
70%–90% of Average SWE
Current snow water equivalent (SWE) is between 70%–90% of the average SWE value for this two-day period, compared to historical conditions from 2004–2021.
90%–110% of Average SWE
Current snow water equivalent (SWE) is between 90%–110% of the average SWE value for this two-day period, compared to historical conditions from 2004–2021.
110%–130% of Average SWE
Current snow water equivalent (SWE) is between 110%–130% of the average SWE value for this two-day period, compared to historical conditions from 2004–2021.
130%–150% of Average SWE
Current snow water equivalent (SWE) is between 130%–150% of the average SWE value for this two-day period, compared to historical conditions from 2004–2021.
150%–200% of Average SWE
Current snow water equivalent (SWE) is between 150%–200% of the average SWE value for this two-day period, compared to historical conditions from 2004–2021.
200%–400% of Average SWE
Current snow water equivalent (SWE) is between 200%–400% of the average SWE value for this two-day period, compared to historical conditions from 2004–2021.
400%–800% of Average SWE
Current snow water equivalent (SWE) is between 400%–800% of the average SWE value for this two-day period, compared to historical conditions from 2004–2021.
This map shows snow water equivalent (SWE)—the amount of liquid water in the snowpack—compared to past conditions. SWE is shown as a percentage of the 1991–2020 median for HUC6 watersheds across the western U.S., based on measurements from Snow Telemetry (SNOTEL) stations. Yellow to red hues indicate below-normal SWE, while blue hues indicate above-normal SWE.
View an interactive version of this map for the latest information from the USDA Natural Resources Conservation Service.
This map shows SNODAS snow water equivalent (SWE, the amount of liquid water contained within snowpack) for the past two days, as a percentage of the 2004–2021 average. The SNOw Data Assimilation System (SNODAS) is a modeling and data assimilation system developed by NOAA's National Operational Hydrologic Remote Sensing Center (NOHRSC) to provide the best possible estimates of snow cover and associated parameters to support hydrologic modeling and analysis.
This map is updated daily, with a 2-day delay. The snow water equivalent (SWE) values shown on the map reflect conditions 2 days ago (the date shown below the map) based on data provided by the USDA Natural Resources Conservation Service (NRCS) yesterday. NRCS may make additional adjustments to these data. For the most up-to-date information, view NRCS's interactive map.
SNODAS data are updated daily.
Drought is defined as the lack of precipitation over an extended period of time, usually for a season or more, that results in a water shortage. Changes in precipitation can substantially disrupt crops and livestock, influence the frequency and intensity of severe weather events, and affect the quality and quantity of water available for municipal and industrial use.
Learn MoreSnow drought is a period of abnormally low snowpack for the time of year. Snowpack typically acts as a natural reservoir, providing water throughout the drier summer months. Lack of snowpack storage, or a shift in timing of snowmelt, can be a challenge for drought planning.
Learn MorePeriods of drought can lead to inadequate water supply, threatening the health, safety, and welfare of communities. Streamflow, groundwater, reservoir, and snowpack data are key to monitoring and forecasting water supply.
Learn MoreIn a drought, lower water levels or snowpack can affect the availability of recreational activities and associated tourism, and a resulting loss of revenue can severely impact supply chains and the economy. Drought—as well as negative perceptions of drought, fire bans, or wildfires—may also result in decreased visitations, cancellations in hotel stays, a reduction in booked holidays, or reduced merchandise sales.
Learn More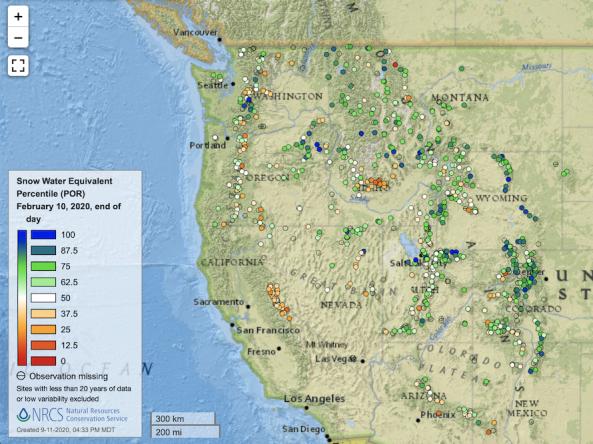
Point maps and interactive maps of snow water equivalent, snow depth, and snow density from the Natural Resources Conservation Service (NRCS) Snow Telemetry (SNOTEL).
NOHRSC snow products include estimates of snow water equivalent, snow depth, snow pack temperatures, snow sublimation, snow evaporation, blowing snow, modeled and observed snow information, a
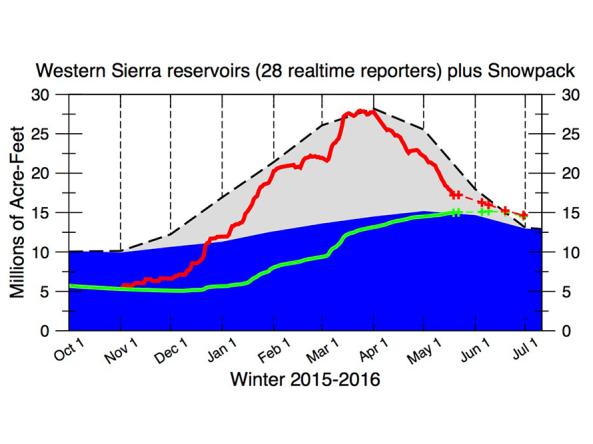
The CNAP Sierra Nevada Water Storage Tracker provides daily reservoir storage and snowpack information.
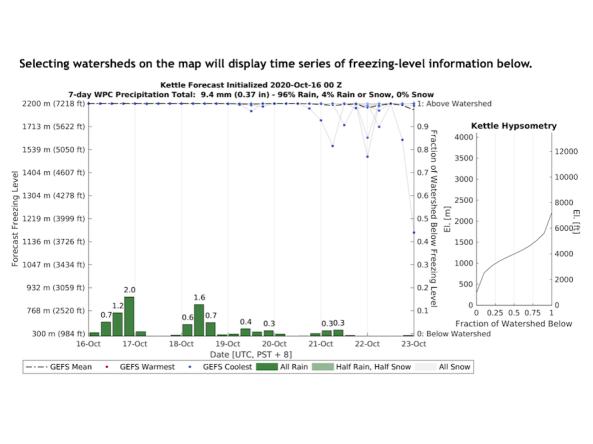
The Center for Western Weather and Water Extremes (CW3E) uses Global Ensemble Forecast System forecasts to show the evolution of the freezing level above, within, or below a watershed's terrai
Snow Today updates daily images on snow conditions and relevant data, and also provides monthly scientific analyses from January to May, or more frequently as conditions warrant.
Monthly streamflow maps comparing percent of monthly average flow to their respective 1981-2010 average. Available in spring and summer for the western U.S.

Impacts and Related Content
Summer Water Availability
Snow droughts reduce the amount of available water for spring and summer snow melt. This, in turn, reduces or shifts the timing of streamflow and reduces soil moisture, which can have impacts on water storage, irrigation, fisheries, vegetation, municipal water supplies, and wildfire.
Winter Water Management
Warmer winter storms lead to rain instead of snow at higher elevations in mountain regions. This can create challenges for water management and flood mitigation strategies, particularly when dealing with extreme events.
By Sector | Recreation and Tourism
Many local economies and industries rely on snowpack and river flows from snowmelt to support their outdoor industries, such as skiing, rafting, and fishing.
Research & Learn | Snow Drought
Find more detailed information about snow drought, including the importance of snowpack and snow drought’s impact on ecosystems, water supply, and local economies.
The Great Western Snow Drought of 2015
The winter of 2015 brought unusually warm temperatures to the western United States and serves as a classic example of how warm temperatures can cause snow drought. By April 1, not a single basin in the West was above 86% of median snow water equivalent—and most basins in Washington, Oregon, California, Nevada, Utah, and Arizona were below 40%.

Snow Drought Research and Resources
Web Resources
The Climate CIRCulator: Snowpack & Drought Blog
The Climate CIRCulator: Snow Drought Declines in the American West
NASA Earth Observatory: Snow Drought in the Rockies
National Snow and Ice Data Center (NSIDC): Snow Today
Story Map: Snow Drought in the 21st Century
U.S. Bureau of Reclamation: Emerging Technologies in Snow Monitoring
2018 Western Snow Conference Videos
Missouri River Basin
USACE Upper Missouri River Basin Soil Moisture and Plains Snow Monitoring Build-Out
Upper Missouri River Basin Soil Moisture and Plains Snow Data Value Study
Rocky Mountain West
Colorado’s Decision Support Systems SNODAS Tools
Snowpack Monitoring in the Rocky Mountain West: A User Guide (PDF)
Pacific Northwest
CIRC Pacific Northwest Snowpack, Hydrology, and Drought Resources
Seasonal Hydrologic Responses to Climate Change in the Pacific Northwest