Persistent Snow Drought and Rapid Spring Snowmelt Will Decrease Western Water Supplies and Increase Wildfire Risk
Key Points
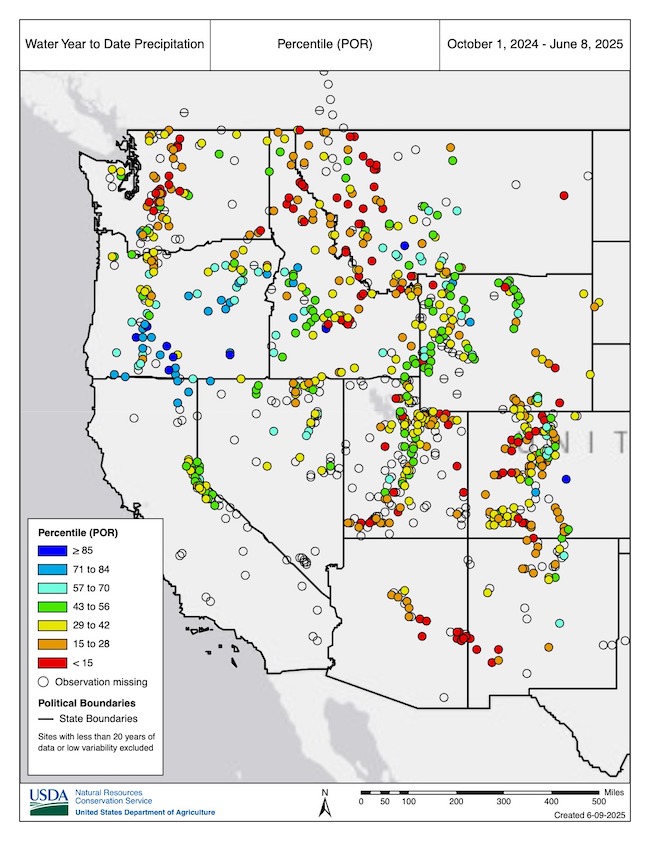
- Snow drought developed and persisted this winter in pockets of the western U.S., largely driven by lack of precipitation with a lesser role from above-normal temperatures. The most severe conditions have persisted across Arizona and New Mexico into southern Utah and Colorado.
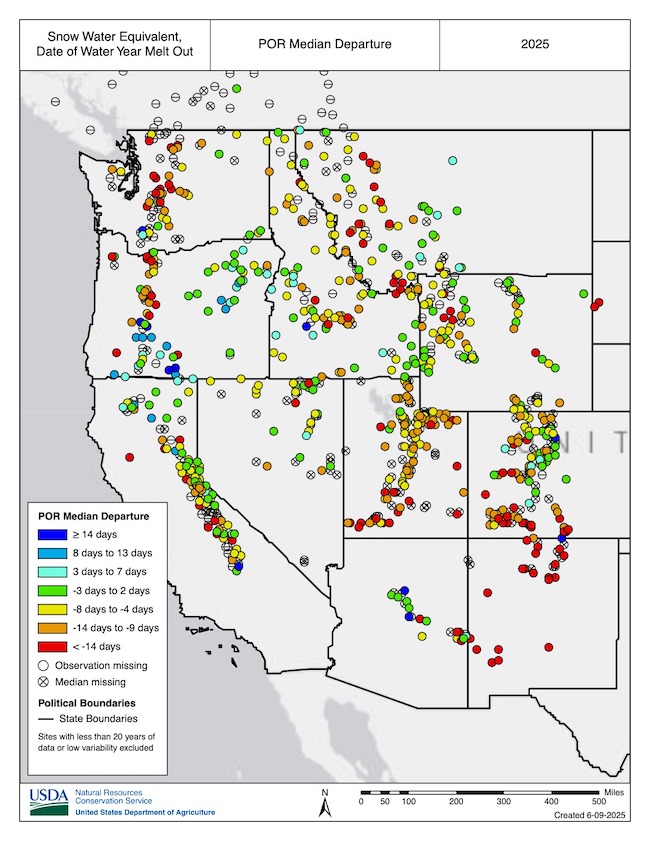
- Snowpack has nearly disappeared from monitoring stations across the West as dry and warm conditions accelerated snowmelt and early snowpack loss. Snow disappeared early even in areas without widespread snow drought conditions and with above-normal peak snow water equivalent (SWE).
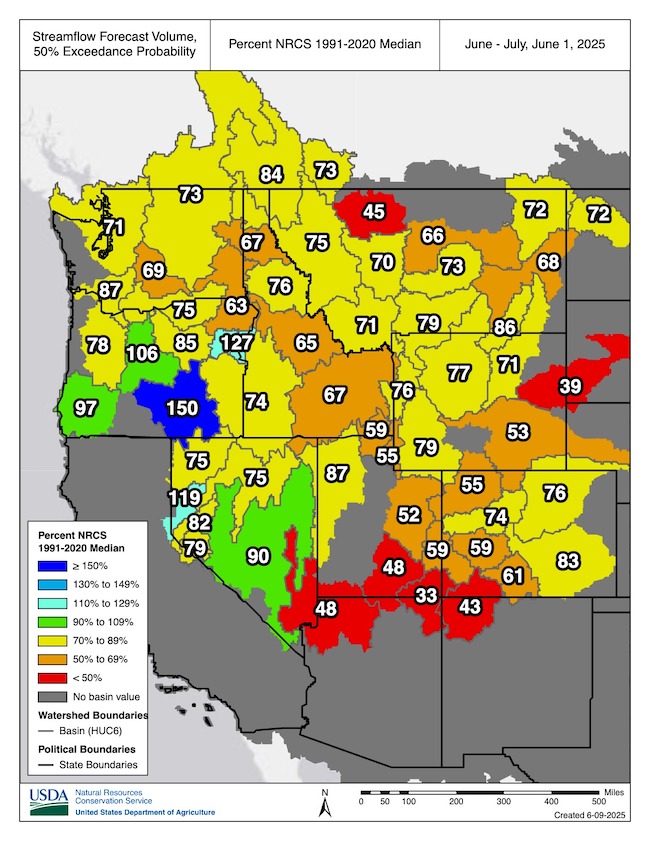
- Summer streamflow volume forecasts are lower than normal across the West. The impacts of early season snow drought in some regions and the widespread rapid melt out across the West will challenge water supplies, agriculture, outdoor recreation, and tourism, as well as increase wildfire potential (see recent Southwest and Great Plains Drought and Wildfire Outlook webinars for more information).
- Drought conditions are expected to persist or expand across much of the western United States this summer. Drought emergencies have been declared in several areas, including Washington, New Mexico, and the Navajo Nation.
- Lake Powell is at 34% of capacity, and Lake Mead is at 31% of capacity. The Colorado Basin River Forecast Center is forecasting 45% of average April-July unregulated inflows into Lake Powell.
Snow Telemetry (SNOTEL) snow water equivalent (SWE) 2025 Water Year peak as a percentage of the USDA Natural Resources Conservation Service (NRCS) 1991–2020 median. Only stations with at least 20 years of data are included.
For an interactive version of this map, please visit NRCS.
Snow Telemetry (SNOTEL) snow water equivalent (SWE) 2025 Water Year peak as a percentage of the USDA Natural Resources Conservation Service (NRCS) 1991–2020 median. Only stations with at least 20 years of data are included.
For an interactive version of this map, please visit NRCS.
Snow Telemetry (SNOTEL) snow water equivalent (SWE) values (inches) on June 8, 2025.
For an interactive version of this map, please visit the USDA Natural Resources Conservation Service (NRCS).
Drought is defined as the lack of precipitation over an extended period of time, usually for a season or more, that results in a water shortage. Changes in precipitation can substantially disrupt crops and livestock, influence the frequency and intensity of severe weather events, and affect the quality and quantity of water available for municipal and industrial use.
Learn MoreSnow drought is a period of abnormally low snowpack for the time of year. Snowpack typically acts as a natural reservoir, providing water throughout the drier summer months. Lack of snowpack storage, or a shift in timing of snowmelt, can be a challenge for drought planning.
Learn MorePeriods of drought can lead to inadequate water supply, threatening the health, safety, and welfare of communities. Streamflow, groundwater, reservoir, and snowpack data are key to monitoring and forecasting water supply.
Learn MoreIn a drought, lower water levels or snowpack can affect the availability of recreational activities and associated tourism, and a resulting loss of revenue can severely impact supply chains and the economy. Drought—as well as negative perceptions of drought, fire bans, or wildfires—may also result in decreased visitations, cancellations in hotel stays, a reduction in booked holidays, or reduced merchandise sales.
Learn MoreSWE Water Year Peak: Percentage of Median
< 50% of Median
The snow water equivalent (SWE) water year peak is less than 50% of the median SWE value, compared to historical conditions from 1991–2020.
50%–70% of Median
The snow water equivalent (SWE) water year peak is between 50%–70% of the median SWE value, compared to historical conditions from 1991–2020.
70%–90% of Median
The snow water equivalent (SWE) water year peak is between 70%–90% of the median SWE value, compared to historical conditions from 1991–2020.
90%–110% of Median
The snow water equivalent (SWE) water year peak is between 90%–110% of the median SWE value, compared to historical conditions from 1991–2020.
110%–130% of Median
The snow water equivalent (SWE) water year peak is between 110%–130% of the median SWE value, compared to historical conditions from 1991–2020.
130%–150% of Median
The snow water equivalent (SWE) water year peak is between 130%–150% of the median SWE value, compared to historical conditions from 1991–2020.
>150% of Median
The snow water equivalent (SWE) water year peak is greater than 150% of the median SWE value, compared to historical conditions from 1991–2020.
SWE Water Year Peak: Percentage of Median
< 50% of Median
The snow water equivalent (SWE) water year peak is less than 50% of the median SWE value, compared to historical conditions from 1991–2020.
50%–70% of Median
The snow water equivalent (SWE) water year peak is between 50%–70% of the median SWE value, compared to historical conditions from 1991–2020.
70%–90% of Median
The snow water equivalent (SWE) water year peak is between 70%–90% of the median SWE value, compared to historical conditions from 1991–2020.
90%–110% of Median
The snow water equivalent (SWE) water year peak is between 90%–110% of the median SWE value, compared to historical conditions from 1991–2020.
110%–130% of Median
The snow water equivalent (SWE) water year peak is between 110%–130% of the median SWE value, compared to historical conditions from 1991–2020.
130%–150% of Median
The snow water equivalent (SWE) water year peak is between 130%–150% of the median SWE value, compared to historical conditions from 1991–2020.
>150% of Median
The snow water equivalent (SWE) water year peak is greater than 150% of the median SWE value, compared to historical conditions from 1991–2020.
Snow Water Equivalent (Inches)
Snow Telemetry (SNOTEL) snow water equivalent (SWE) 2025 Water Year peak as a percentage of the USDA Natural Resources Conservation Service (NRCS) 1991–2020 median. Only stations with at least 20 years of data are included.
For an interactive version of this map, please visit NRCS.
Snow Telemetry (SNOTEL) snow water equivalent (SWE) 2025 Water Year peak as a percentage of the USDA Natural Resources Conservation Service (NRCS) 1991–2020 median. Only stations with at least 20 years of data are included.
For an interactive version of this map, please visit NRCS.
Snow Telemetry (SNOTEL) snow water equivalent (SWE) values (inches) on June 8, 2025.
For an interactive version of this map, please visit the USDA Natural Resources Conservation Service (NRCS).
View an updated, interactive version of this map from the USDA's Natural Resources Conservation Service.
View an updated, interactive version of this map from the USDA's Natural Resources Conservation Service.
View an updated, interactive version of this map from the USDA's Natural Resources Conservation Service.
Drought is defined as the lack of precipitation over an extended period of time, usually for a season or more, that results in a water shortage. Changes in precipitation can substantially disrupt crops and livestock, influence the frequency and intensity of severe weather events, and affect the quality and quantity of water available for municipal and industrial use.
Learn MoreSnow drought is a period of abnormally low snowpack for the time of year. Snowpack typically acts as a natural reservoir, providing water throughout the drier summer months. Lack of snowpack storage, or a shift in timing of snowmelt, can be a challenge for drought planning.
Learn MorePeriods of drought can lead to inadequate water supply, threatening the health, safety, and welfare of communities. Streamflow, groundwater, reservoir, and snowpack data are key to monitoring and forecasting water supply.
Learn MoreIn a drought, lower water levels or snowpack can affect the availability of recreational activities and associated tourism, and a resulting loss of revenue can severely impact supply chains and the economy. Drought—as well as negative perceptions of drought, fire bans, or wildfires—may also result in decreased visitations, cancellations in hotel stays, a reduction in booked holidays, or reduced merchandise sales.
Learn MoreSnow Drought Conditions Summary
This update is based on data available as of Monday, June 9, 2025 at 12:00 a.m. PT. We acknowledge that conditions are evolving.
Jump to conditions for your region:
- Rocky Mountain Water Year Snow Drought Summary
- New Mexico and Arizona Water Year Snow Drought Summary
- Oregon and Washington Water Year Snow Drought Summary
- California and Nevada Water Year Snow Drought Summary
- Alaska Water Year Snow Drought Summary
Rocky Mountain Water Year Snow Drought Summary
Northern Rocky Mountains
Snow Drought
Widespread snow drought conditions were not apparent in peak snow water equivalent (SWE) values across much of the northern Rocky Mountains. The region had near- to above-median peak SWE, although some SNOTEL stations peaked at 70-89% of median SWE. Most of the areas with below-median peak SWE were along the border of western Montana and eastern Idaho. Despite these conditions, the snowmelt season (April-May) was dry and warm across most of the region, which led to accelerated melt rates and early loss of snowpack. In Montana, snow at 84% of SNOTEL stations (62 locations) melted earlier than the median date. In Idaho, snow at 84% of stations (64 locations) melted early, and in Wyoming, snow at 84% of stations (57 locations) melted early. Snow is still present at some high-elevation stations in the region (about 20% of all stations).
Water Supply Outlook
The USDA Natural Resources Conservation Service’s June-July water supply forecasts indicate below-median runoff for the entire northern Rocky Mountain region, with most large river basins expected to receive less than 80% of median flows. Forecasts for the Marias, Salmon, and Upper Snake Basins are among the lowest in the region at 45%, 65%, and 67% of median, respectively. Moderate and Severe Drought (D1–D2) are present throughout the region, according to the U.S. Drought Monitor. Based on the late onset snow drought conditions, near- to below-median October-May observed runoff, and below-median June-July forecasted runoff, NOAA’s Climate Prediction Center forecasts that drought will persist and develop this summer.
Central and Southern Rocky Mountains
Snow Drought
The central Rocky Mountains (northern Utah and northern Colorado) had near-normal snow accumulation with peak snow water equivalent (SWE) of 85-105% of median at many SNOTEL stations. Snowpack in southern Utah and southern Colorado was much lower. Many locations reported peak SWE of less than 50% of median, and two stations in Utah reported record low peak SWE.
The primary driver of the low snowpack in the southern Rocky Mountains was an extremely dry winter (December-February) with record low precipitation in some areas. Across most of the central and southern Rocky Mountains, snowpack peaked early (1-2 weeks early in many locations) and then melted more quickly than normal (also 1-2 weeks early, or more) in April and May. In Utah, snow at 93% of SNOTEL stations melted earlier than the median date, and in Colorado, snow melted early at 82% of stations.
Water Supply Outlook
Water supply forecasts for central and northern Utah and Colorado indicate below-median June-July flows in three major sub-basins in the Upper Colorado: the Upper Green, Lower Green, and White-Yampa Basins are expected to receive 78%, 63%, and 59% of median runoff, respectively. In southern Utah and Colorado, the outlook is worse, with well-below-median runoff predicted for the Upper San Juan (63% of median), Lower San Juan (38% of median), and Upper Colorado-Dirty Devil (48% of median) Basins.
Low observed and forecast river flows are expected to lead to much-below-normal unregulated inflows into Lake Powell. May observed inflows were 41% of normal. The Colorado Basin River Forecast Center is forecasting 45% of normal (average) seasonal inflows. As of early June, Lake Powell was at 34% of capacity. Moderate to Extreme Drought (D1-D3) is currently widespread throughout western Colorado and most of Utah. Drought conditions are expected to persist and likely intensify throughout summer due to low snowpack and seasonal runoff.
New Mexico and Arizona Water Year Snow Drought Summary
Snow Drought
Arizona and New Mexico, along with southern Utah and Colorado, faced severe snow drought conditions this year with peak snow water equivalent (SWE) of less than 50% of median at most SNOTEL stations. Four stations in Arizona and four stations in New Mexico reported record low peak SWE. Peak SWE at some locations in central Arizona and northern New Mexico was 50-89% of median, but no station reported above 89% of median peak SWE.
Winter was extremely dry. Record low precipitation in many locations, likely influenced by a weak La Niña event, led to little snow accumulation and persistent snow drought conditions throughout the season. March storms brought the greatest snow accumulation of the season and some relief to part of Arizona. The March storms led to snow melting later than normal; however, these same locations had little to no snow on the ground for most of winter. In New Mexico, all but one SNOTEL station with at least 20 years of recorded observations were snow free at least two weeks earlier than the median date. This is due to the combined impacts of a dry winter, early peak SWE, and rapid spring snowmelt.
Water Supply Outlook
Observed October-May flows in eastern New Mexico in the Upper Pecos and Upper Canadian Basins were 144% and 95% of median, respectively. Water year flows in the Upper Rio Grande and Rio Grande-Elephant Butte Basins in western New Mexico were much lower, at 59% and 42% of median, respectively. Seasonal water supply forecasts indicate much-below-normal seasonal volumes for all of New Mexico, with many locations forecast to receive less than 25% of median flows. In Arizona, observed October-May flows were extremely low in the Little Colorado (12% of median), Salt (15% of median), and Verde (40% of median) Basins.
The USDA Natural Resources Conservation Service (NRCS) June-July runoff forecast for the Lower Colorado-Lake Mead Basin is just 48% of median. Lake Mead is currently at 31% of capacity. The lake level is lower than this time last year, but not at the record low levels set in 2022. On May 22, New Mexico Governor Michelle Lujan Grisham, signed an executive order declaring a state of emergency due to persistent and severe drought and escalating fire risk across the state. In late May, the Navajo Nation issued a Declaration of a Drought Emergency across tribal lands in Arizona, New Mexico, and Utah. The U.S. Drought Monitor indicates that drought is currently widespread in both Arizona and New Mexico, with several areas of Extreme and Exceptional Drought (D3-D4). Drought conditions are expected to persist and intensify throughout summer.
Oregon and Washington Water Year Snow Drought Summary
Snow Drought
Snow drought developed early in the season and persisted throughout the year, especially along the west slope of the Washington Cascade Range, where many SNOTEL stations reported peak snow water equivalent (SWE) of 50-69% of median. A handful of sites there reported less than 50% of median peak SWE.
Low precipitation was the main driver of the low snowpack in Washington, with some stations in the Washington Cascades reporting water year precipitation below the 15th percentile of historical conditions. Some isolated, lower-elevation locations on the west slope of the northern Oregon Cascade Range also experienced snow drought conditions this year, mainly due to warmer-than-normal spring temperatures. The southern Oregon Cascade Range and the Blue and Steens Mountains in Oregon were in a narrow wet corridor that received much-above-median water year precipitation and peak SWE greater than 150% of median. Snow melted more than two weeks earlier than the median date at 19 stations in Washington and 10 stations in Oregon.
Water Supply Outlook
Below normal June-July runoff is forecast for all basins in Washington, from 63% of median in the Lower Snake to 87% of median in the Lower Columbia. Washington issued a drought emergency in April for the Yakima Basin watersheds due to low snowpack, low runoff, and persistent drought over the past several years. This drought emergency was expanded in early June to 19 other watersheds in the Puget Sound and Central Washington regions.
Water supply forecasts are more optimistic in Oregon, with several central and southern Oregon basins expected to receive above-median runoff. Some basins in northern Oregon are forecast to receive below-median runoff during June and July, including the Middle Columbia (75% of median), Willamette (78% of median), and John Day (85%) Basins. The Washington and northern Oregon Cascade Range is currently in Moderate Drought (D1), and the Climate Prediction Center’s seasonal drought outlook indicates further drought development throughout summer is likely in other parts of northern and western Oregon.
California and Nevada Water Year Snow Drought Summary
Snow Drought
In California and far western Nevada (Lake Tahoe Basin), snowpack generally peaked above median in the north (Trinity Alps, Cascade Range, and Sierra Nevada), near median in the central Sierra Nevada, and near- to below-median in the southern Sierra Nevada. A few lower-elevation stations in the central Sierra Nevada and along the west slope of the southern Sierra Nevada reported peak snow water equivalent (SWE) of less than 70% of median, but snow drought concerns were fairly limited in California this winter. Similar to other regions across the West, April-May in California and Nevada was generally dry and warm, which led to rapid snowmelt and snow disappearing early even in locations that received above-normal peak SWE.
In northeast Nevada, peak SWE was generally above normal, with most stations reporting 110% to greater than 150% of median SWE. Peak SWE was closer to normal in central Nevada and below-normal in east-central Nevada near the Utah border. The Spring Mountains in southern Nevada received very little snow during most of the winter. Though some snow fell in the Spring Mountains in late February into March, overall snowpack was much-below-normal in that mountain range.
Water Supply Outlook
USDA Natural Resources Conservation Service (NRCS) June-July forecasts indicate runoff in the eastern Sierra Nevada is expected to be 119%, 82%, and 79% of median in the Truckee, Walker, and Carson River Basins, respectively. The California-Nevada River Forecast Center seasonal water supply forecasts indicate above-normal runoff elsewhere in California, except in parts of the central Sierra Nevada, where 80-90% of median runoff is forecast.
Nearly all of the major reservoirs in California are currently above the historical average water levels, which should help limit major surface water supply concerns this summer despite below-normal runoff forecast for parts of the Sierra Nevada. NRCS runoff forecasts for the three large basins in Nevada—Central Nevada Desert, Humboldt, and Black Rock Desert—are 90%, 75%, and 75% of median, respectively.
Currently, drought persists in southern California and central and southern Nevada. Extreme and Exceptional Drought (D3-D4) conditions are present only in large desert areas of southern California and Nevada that are largely disconnected from the seasonal snowpacks in the Sierra Nevada and northeast Nevada. The Climate Prediction Center’s seasonal drought outlook indicates that further drought development is likely throughout summer in parts of central California and far northwest Nevada.
Alaska Water Year Snow Drought Summary
Snow Drought
In South Central Alaska, peak snow water equivalent (SWE) was variable and highly dependent on elevation, especially in the coastal mountain ranges. Winter precipitation was above normal for the region, but winter mean temperatures were very warm (5-7 °F above normal), which led to more rainfall and less snow at lower elevations. Higher-elevation SNOTEL stations in South Central Alaska had peak SWE around 90-120% of median. Most of the lower-elevation stations had peak SWE around 60% of median.
Port Graham, on the southwest tip of the Kenai Peninsula, sits at 270 feet in elevation and reported peak SWE of just 19% of median despite above-normal winter precipitation. Snow melted about one to two weeks early at lower elevations in South Central Alaska. SNOTEL stations in the Fairbanks region reported peak SWE of 99-167% of median. Winter temperatures were well above normal, but the interior climate in the Fairbanks region is much colder than in coastal regions, which supported abundant snowfall at all elevations. The U.S. Drought Monitor currently shows a small area of Abnormally Dry (D0) conditions in South Central Alaska.
Low Water Year Precipitation Totals Drove Western Snow Drought
Earlier than Normal Snowmelt Across the West
Low June–July Streamflow Volume Forecasts Across the West
For More Information, Please Contact:
Daniel McEvoy
Western Regional Climate Center
Daniel.McEvoy@dri.edu
Amanda Sheffield
CIRES/NOAA/NIDIS California-Nevada Regional Drought Information Coordinator
Amanda.Sheffield@noaa.gov
Jason Gerlich
CIRES/NOAA/NIDIS Pacific Northwest and Missouri River Basin Regional Drought Information Coordinator
Jason.Gerlich@noaa.gov
NIDIS and its partners launched this snow drought effort in 2018 to provide data, maps, and tools for monitoring snow drought and its impacts as well as communicating the status of snow drought across the United States, including Alaska. Thank you to our partners for your continued support of this effort and review of these updates. If you would like to report snow drought impacts, please use the link below. Information collected will be shared with the states affected to help us better understand the short term, long term, and cumulative impacts of snow drought to the citizens and the economy of the regions reliant on snowpack.
Report Your Snow Drought Impacts
Data and Maps | Snow Drought
Research and Learn | Snow Drought