National Centers for Environmental Information (NCEI)
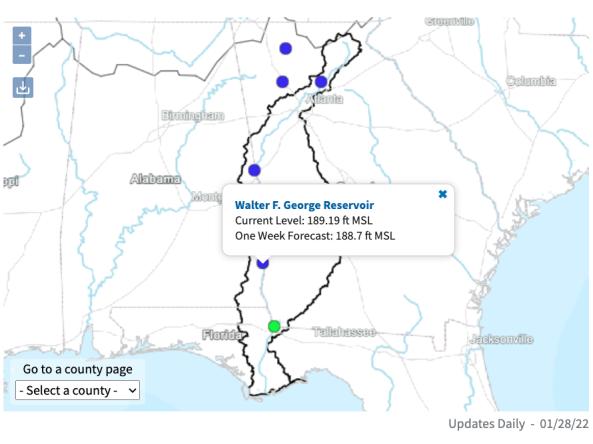
The ACF River Basin Drought and Water Dashboard is a web-based application that allows decision makers to view real-time information on the ACF River Basin all in one place.
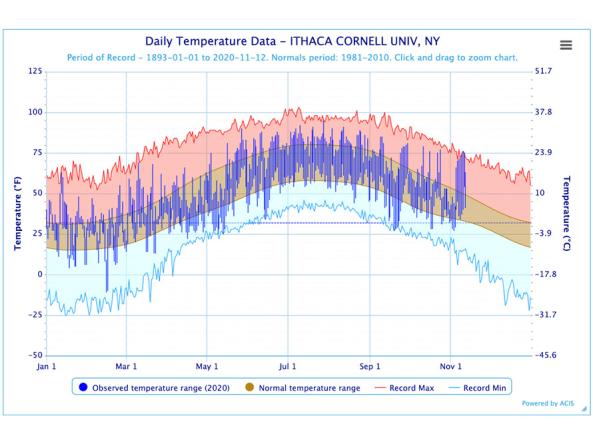
The Regional Climate Centers (RCC) Applied Climate Information System (ACIS) offers interactive temperature and precipitation charts with single- or multi-station capabilities.
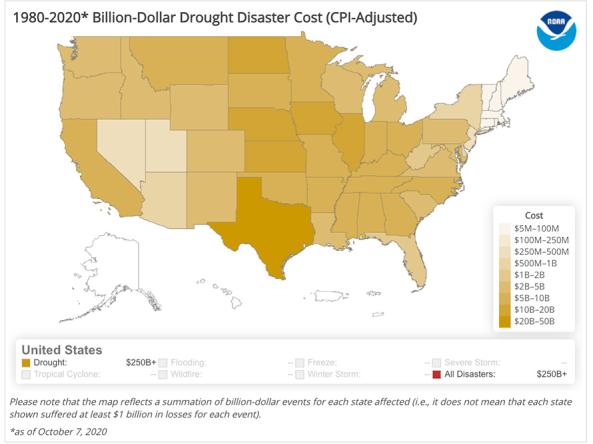
The National Centers for Environmental Information's Billion-Dollar Weather and Climate Disasters shows the weather and climate events that have had the greatest economic impact from 1980
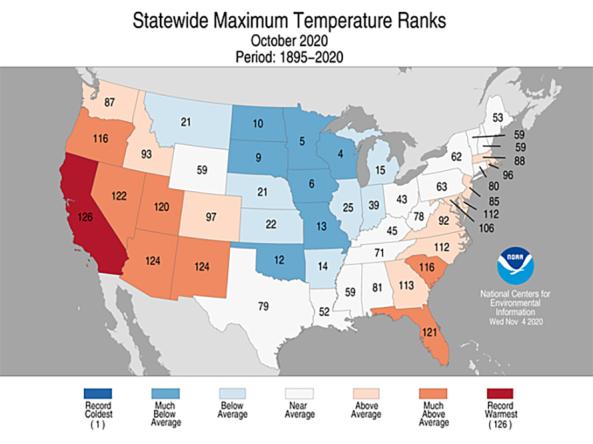
The U.S. Climate Divisional Dataset is a long-term temporally and spatially complete dataset from 1895–present for the contiguous United States.
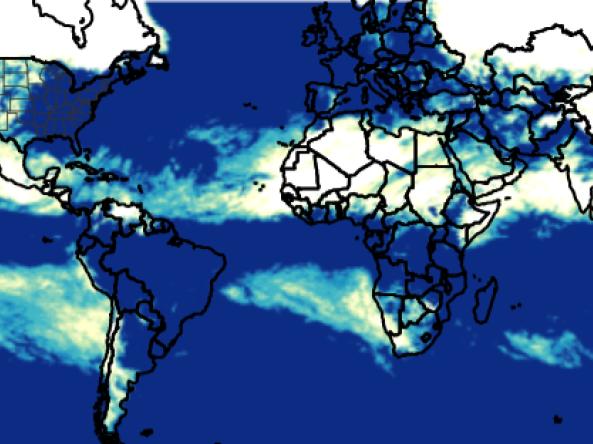
The Global Gridded Standardized Precipitation Index (SPI) is derived from the CMORPH daily dataset and includes timescales of 1, 3, 6 and 9 months. The NOAA CMORPH precipitatio
The Global Gridded Standardized Precipitation Index (SPI) is derived from the CMORPH daily dataset and includes timescales of 1, 3, 6 and 9 months. The NOAA CMORPH precipitatio
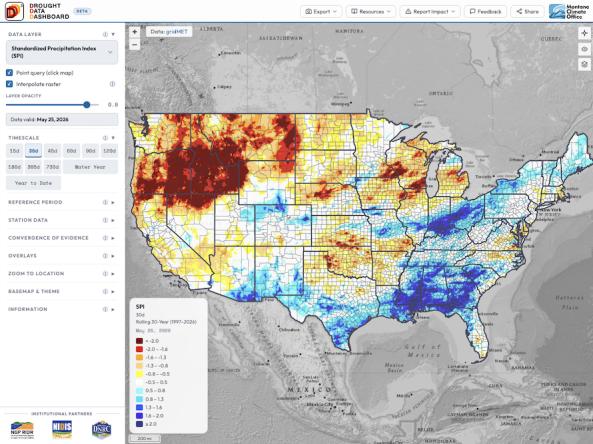
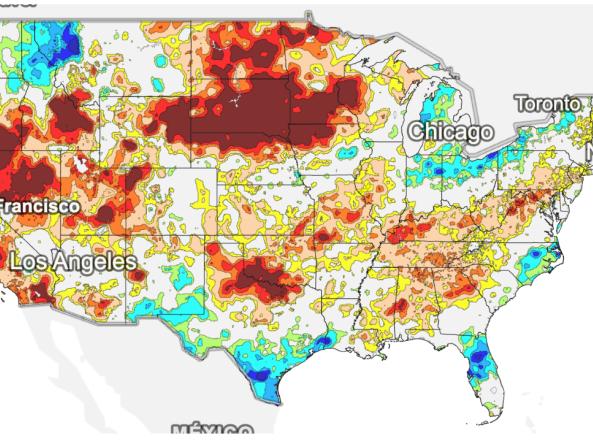
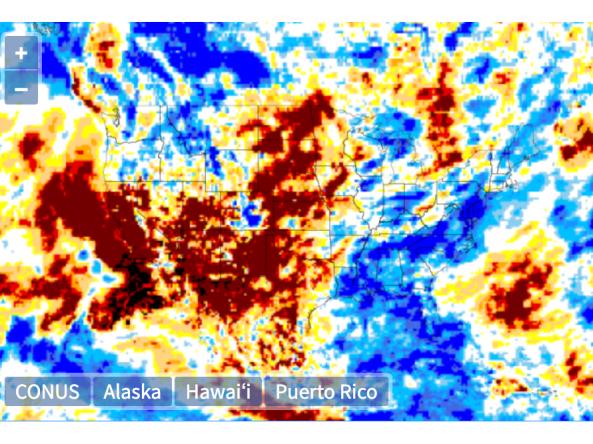
The Drought Data Dashboard, or D³, is an interactive mapping tool that allows users to view, analyze, and customize the display of key drought indices and climate variables across the co
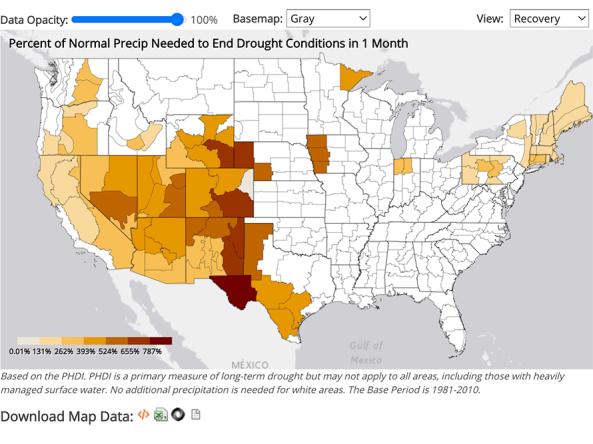
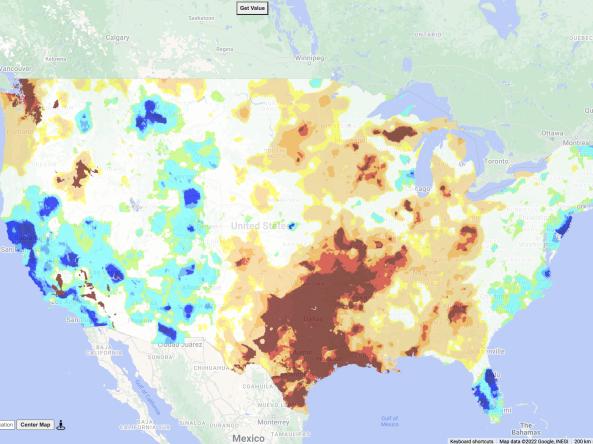
NCEI provides precipitation data that can be used to show probability or the amount of precipitation to ameliorate or end a drought at different monthly scales.
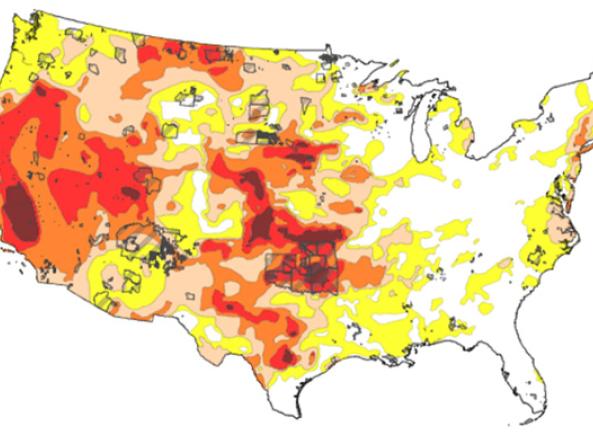
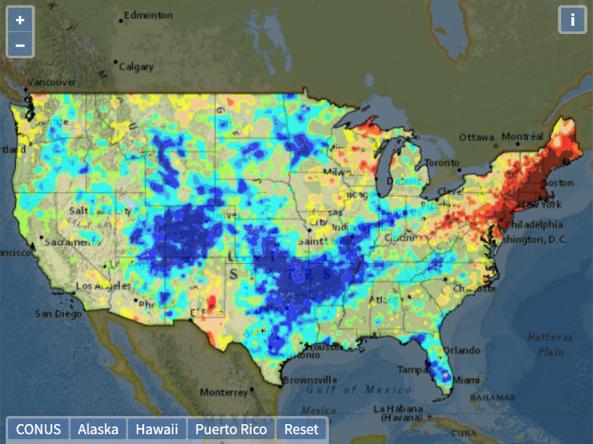
This tool shows one-month projections for EDDI, which is an early warning guidance tool that is available for monitoring.
The Global Gridded Standardized Precipitation Index (SPI) is derived from the CMORPH daily dataset and includes timescales of 1, 3, 6 and 9 months. The NOAA CMORPH precipitatio
Global Historical Climatology Network (GHCN): an integrated database of daily climate summaries from land surface stations across the globe, including a common suite of quality assurance reviews.&n
nClimGrid-Daily is a gridded dataset that includes area averages of daily maximum, minimum, and average temperatures and daily precipitation amounts for the contiguous United States from Janua

The nClimGrid-monthly dataset is a gridded dataset derived from spatially interpolating data from the Global Historical Climatology Network (GHCN), including precipitation (monthly totals) and temp
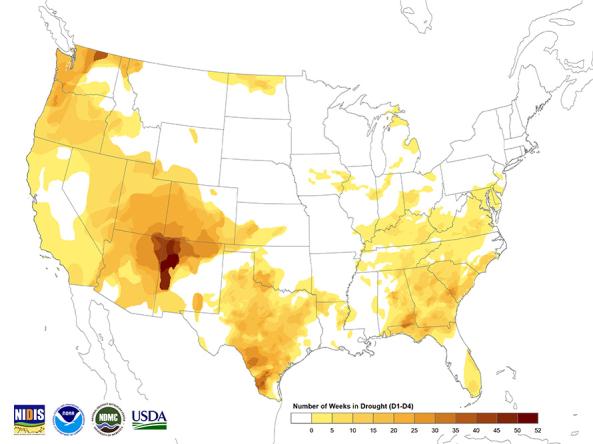
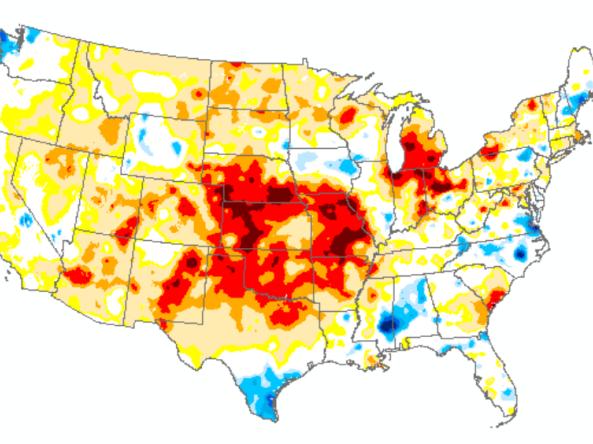
The U.S. Drought Monitor (USDM) is a weekly map, released each Thursday, to show the location and intensity of drought across the country.
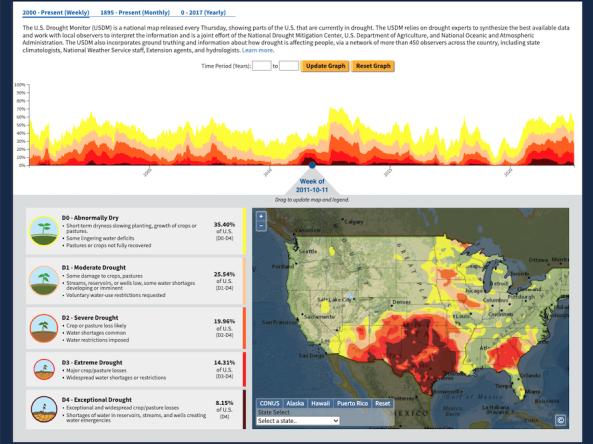
The U.S. Drought Portal's Historical Data & Conditions Tool displays three historical drought datasets side by side on an interactive time series graph and map: U.S.
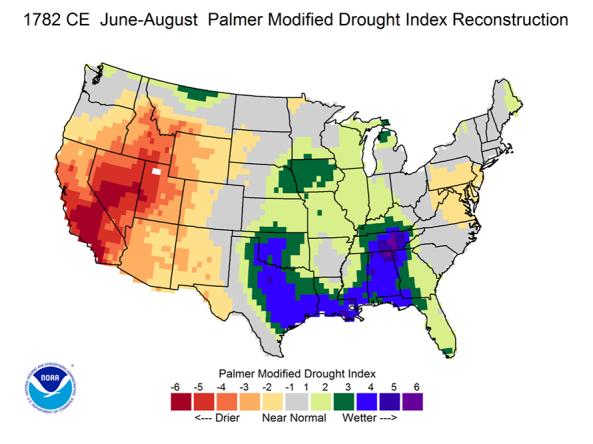
The Living Blended Drought Atlas (LBDA) is a recalibrated data series of June-July-August Palmer Modified Drought Index (PMDI) values by United States climate division, compiled by blending tree-ri
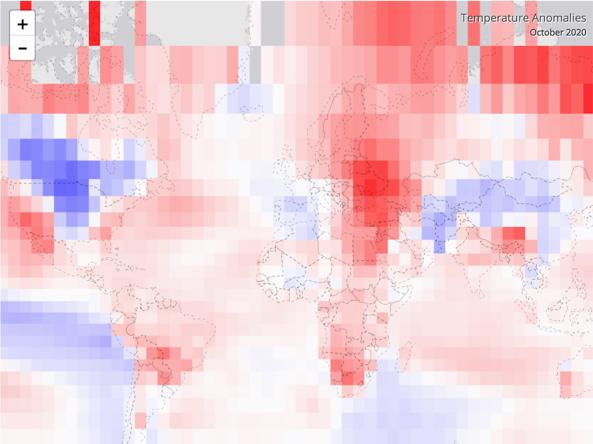
The NOAA NCEI Climate at a Glance (CAG) tool provides an analysis of monthly and annual temperatures for the globe and is intended for the study of climate variability and change.
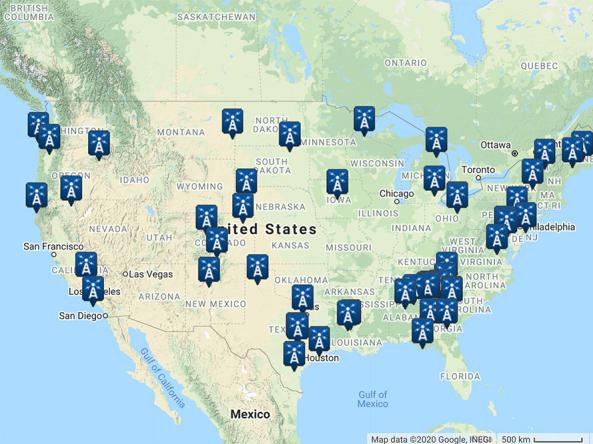
NCEI Find a Station tool: a tool for retrieving weather records from observing stations by entering the desired location, data set, data range, and data category.
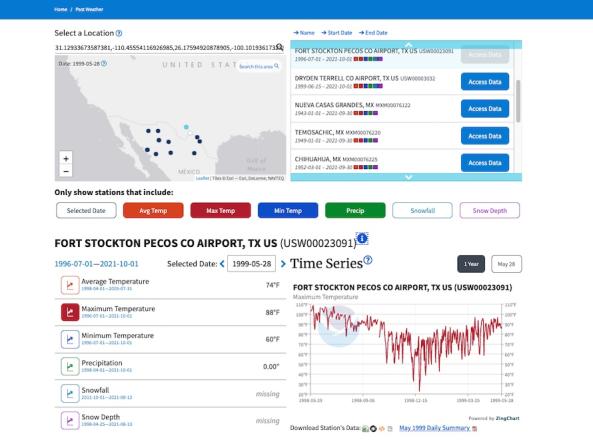
The NCEI Past Weather Tool allows users to search for historical temperature,
NCEI provides a variety of temperature and precipitation products available at the National and Global scale.
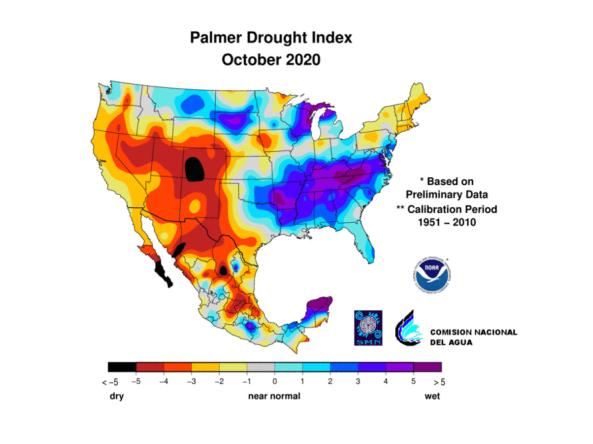
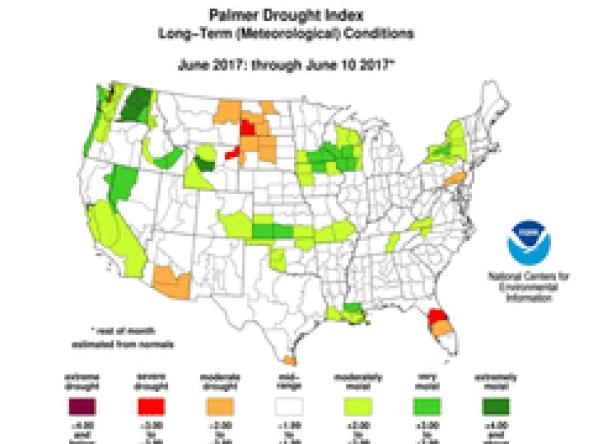
North American Drought Monitor (NADM) indices and data include, Standard Precipitation Index (SPI), Percent of Long-term Average Precipitation and Palmer Drought Severity Index (PDSI).

The OWDA provides new data to determine the causes of Old World drought and wetness and attribute past climate variability to forced and/or internal variability.

NCEI provides the paleoclimatology data and information scientists need to understand natural climate variability and future climate change.
The National Weather Service's Climate Prediction Center (CPC) produces official monthly and seasonal temperature and precipitation outlook products.
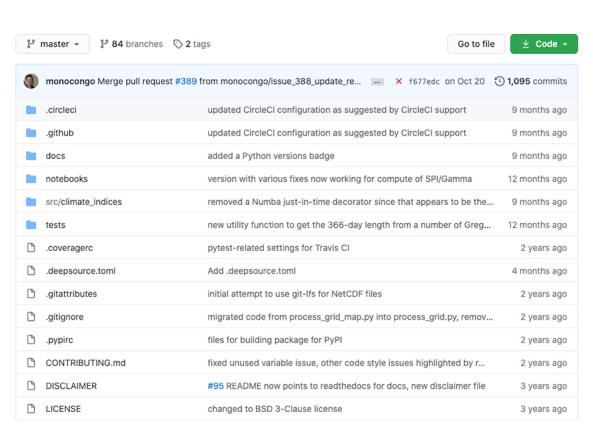
This is a developmental/forked version of code that was originally developed by NIDIS/NCEI.

NOAA's National Centers for Environmental Information (NCEI) developed Fortran code to calculate Standardized Precipitation Index (SPI) and the Palmer Drought Severity Index (PDSI). This code
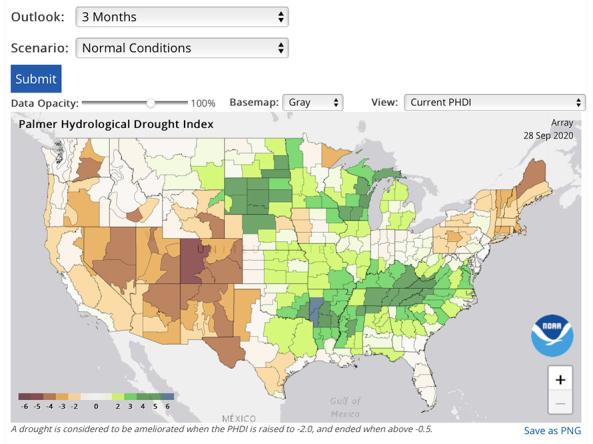
The Weekly Palmer Drought Index (PDI) and Palmer Hydrological Drought Index (PHDI) are estimations of the monthly PDI and PHDI on an operational weekly basis.
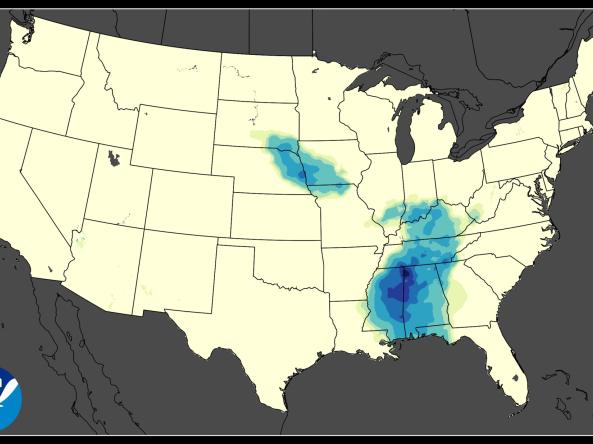
The US Gridded Standardized Precipitation Index (SPI) is derived from the nClimGrid-Daily dataset and and includes timescales of 1, 2, and 3 weeks, as well as 1, 2, 3, 4, 6, 9, and 12 months.
The United States Gridded Standardized Precipitation Evapotranspiration Index (SPEI) is derived from the nClimGrid-Monthl
The US Gridded Standardized Precipitation Index (SPI) is derived from the nClimGrid-Daily dataset and and includes timescales of 1, 2, and 3 weeks, as well as 1, 2, 3, 4, 6, 9, and 12 months.
The US Gridded Standardized Precipitation Index (SPI) is derived from the nClimGrid-Monthly dataset and includes timescales of 1, 2, 3, 6, 9, 12, 24, 36, 48, 60 and 72 months.
The US Gridded Standardized Precipitation Index (SPI) is derived from the nClimGrid-Monthly dataset and includes timescales of 1, 2, 3, 6, 9, 12, 24, 36, 48, 60 and 72 months.
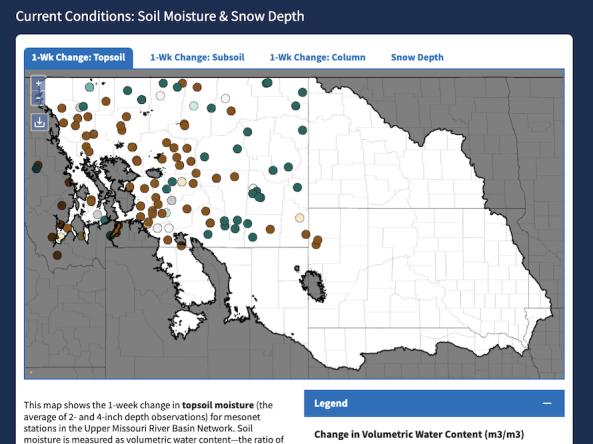
The Upper Missouri River Basin Soil Moisture and Snowpack Dashboard displays interactive maps of station-based soil moisture and snowpack data from the five state mesonets in the Upper Missou