Temperature & Precipitation
Air temperature and precipitation can have wide-ranging effects on natural processes, and their datasets are foundational for drought and climate analysis. Changes in temperature and precipitation can substantially disrupt crops and livestock, influence the frequency and intensity of severe weather events, and affect the quality and quantity of water available for municipal and industrial use.
Temperature and Precipitation Measurements
Temperature and precipitation data are collected from weather stations, weather radar, satellites, and computer models.
Warmer air temperatures increase evapotranspiration—which is the combination of evaporation from the soil and bodies of water and transpiration from plants—and lower soil moisture.
Drought is defined as the lack of precipitation over an extended period of time, usually for a season or more, that results in a water shortage.
Data, Maps, and Tools
To make data easier to use, many organizations derive products from raw data. These derived products may start with station data, which estimate (or interpolate) the information between stations using different methodologies. Radar- and satellite-based products may include station data as “ground truth” to remove bias and create more accurate products.
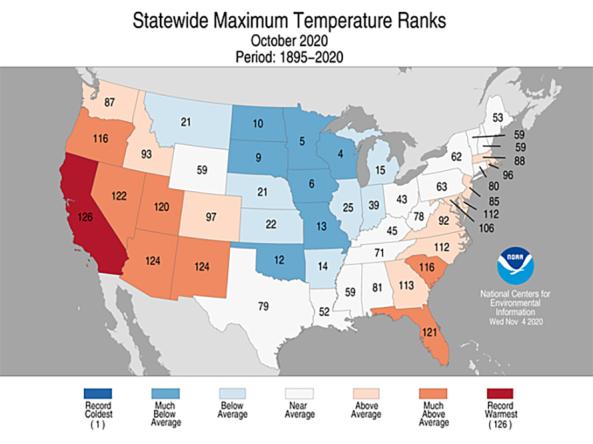
Temperature Conditions
Maximum Temperature (°F)
<0°F
The 7-day average daily maximum temperature is below 0°F.
0–10°F
The 7-day average daily maximum temperature is between 0–10°F.
10–20°F
The 7-day average daily maximum temperature is between 10–20°F.
20–30°F
The 7-day average daily maximum temperature is between 20–30°F.
30–40°F
The 7-day average daily maximum temperature is between 30–40°F.
40–60°F
The 7-day average daily maximum temperature is between 40–60°F.
60–70°F
The 7-day average daily maximum temperature is between 60–70°F.
70–80°F
The 7-day average daily maximum temperature is between 70–80°F.
80–90°F
The 7-day average daily maximum temperature is between 80–90°F.
90–100°F
The 7-day average daily maximum temperature is between 90–100°F.
>100°F
The 7-day average daily maximum temperature is between greater than 100°F.
Departure from Normal Max Temperature (°F)
>8°F Below Normal
The average maximum temperature was more than 8°F colder than normal for this location.
6–8°F Below Normal
The average maximum temperature was 6–8°F colder than normal for this location.
4–6°F Below Normal
The average maximum temperature was 4–6°F colder than normal for this location.
3–4°F Below Normal
The average maximum temperature was 3–4°F colder than normal for this location.
1–3°F Below Normal
The average maximum temperature was 1–3°F colder than normal for this location.
0–1°F Below Normal
The average maximum temperature was 0–1°F colder than normal for this location.
0–1°F Above Normal
The average maximum temperature was 0–1°F warmer than normal for this location.
1–3°F Above Normal
The average maximum temperature was 1–3°F warmer than normal for this location.
3–4°F Above Normal
The average maximum temperature was 3–4°F warmer than normal for this location.
4–6°F Above Normal
The average maximum temperature was 4–6°F warmer than normal for this location.
6–8°F Above Normal
The average maximum temperature was 6–8°F warmer than normal for this location.
>8°F Above Normal
The average maximum temperature was more than 8°F warmer than normal for this location.
This map shows the average maximum daily temperature (°F) for the last 7 days. Blue hues indicate cooler temperatures, while red hues indicate warmer temperatures.
This map shows the average maximum daily temperature for the past 7 days compared to the historical average (1991–2020) for the same 7 days. Negative values (blue hues) indicate colder than normal temperatures, and positive values (red hues) indicate warmer than normal temperatures.
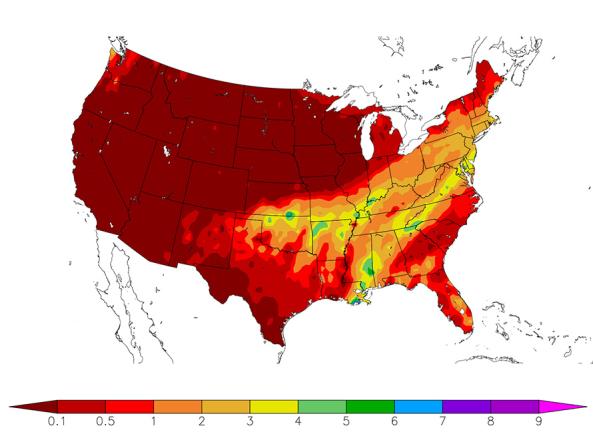
This map shows the average maximum daily temperature for the past 30 days compared to the historical average (1991–2020) for the same 30 days. Negative values (blue hues) indicate colder than normal temperatures, and positive values (red hues) indicate warmer than normal temperatures.
Temperature data are updated daily, with a delay of 3 to 4 days to allow for data collection and quality control.
Temperature data are updated daily, with a delay of 3 to 4 days to allow for data collection and quality control.
Temperature data are updated daily, with a delay of 3 to 4 days to allow for data collection and quality control.
Air temperature can have wide-ranging effects on natural processes. Warmer air temperatures increase evapotranspiration—which is the combination of evaporation from the soil and bodies of water and transpiration from plants—and lower soil moisture.
Learn MoreDrought can reduce the water availability and water quality necessary for productive farms, ranches, and grazing lands, resulting in significant negative direct and indirect economic impacts to the agricultural sector. Monitoring agricultural drought typically focuses on examining levels of precipitation, evaporative demand, soil moisture, and surface/groundwater quantity and quality.
Learn MoreAir temperature can have wide-ranging effects on natural processes. Warmer air temperatures increase evapotranspiration—which is the combination of evaporation from the soil and bodies of water and transpiration from plants—and lower soil moisture.
Learn MoreDrought can reduce the water availability and water quality necessary for productive farms, ranches, and grazing lands, resulting in significant negative direct and indirect economic impacts to the agricultural sector. Monitoring agricultural drought typically focuses on examining levels of precipitation, evaporative demand, soil moisture, and surface/groundwater quantity and quality.
Learn MorePrecipitation Conditions
Inches of Precipitation
This location received less than 0.01 inch of precipitation during this 7-day period.
This location received 0.01–0.5 inch of precipitation during this 7-day period.
This location received 0.5–1 inch of precipitation during this 7-day period.
This location received 1–2 inches of precipitation during this 7-day period.
This location received 2–4 inches of precipitation during this 7-day period.
This location received 4–6 inches of precipitation during this 7-day period.
This location received 6–8 inches of precipitation during this 7-day period.
This location received more than 8 inches of precipitation during this 7-day period.
Precipitation Shown as a Percentage of Normal Conditions
<25% of Normal
Precipitation was only 0% to 25% of the historical average for this location, compared to the same date range from 1991–2020.
25%–50% of Normal
Precipitation was 25% to 50% of the historical average for this location, compared to the same date range from 1991–2020.
50%–75% of Normal
Precipitation was 50% to 75% of the historical average for this location, compared to the same date range from 1991–2020.
75%–100% of Normal
Precipitation was 75% to 100% of the historical average for this location, compared to the same date range from 1991–2020.
100%–150% of Normal
Precipitation was 100% to 150% of the historical average for this location, compared to the same date range from 1991–2020.
150%–200% of Normal
Precipitation was 150% to 200% of the historical average for this location, compared to the same date range from 1991–2020.
200%–300% of Normal
Precipitation was 200% to 300% of the historical average for this location, compared to the same date range from 1991–2020.
>300% of Normal
Precipitation was greater than 300% of the historical average for this location, compared to the same date range from 1991–2020.
This map shows total precipitation (in inches) for the past 7 days. Dark blue shades indicate the highest precipitation amounts.
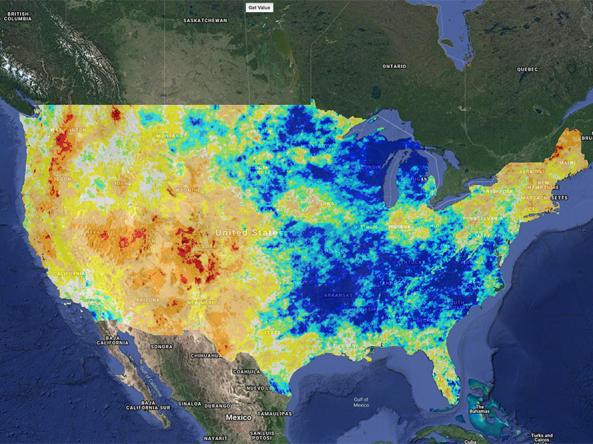
This map shows precipitation for the past 30 days as a percentage of the historical average (1991–2020) for the same time period. Green/blue shades indicate above-normal precipitation, while brown shades indicate below-normal precipitation.
This map shows precipitation for the past 60 days as a percentage of the historical average (1991–2020) for the same time period. Green/blue shades indicate above-normal precipitation, while brown shades indicate below-normal precipitation.
Precipitation data are updated daily, with a delay of 3 to 4 days to allow for data collection and quality control.
Precipitation data are updated daily, with a delay of 3 to 4 days to allow for data collection and quality control.
Precipitation data are updated daily, with a delay of 3 to 4 days to allow for data collection and quality control.
Drought is defined as the lack of precipitation over an extended period of time, usually for a season or more, that results in a water shortage. Changes in precipitation can substantially disrupt crops and livestock, influence the frequency and intensity of severe weather events, and affect the quality and quantity of water available for municipal and industrial use.
Learn MorePeriods of drought can lead to inadequate water supply, threatening the health, safety, and welfare of communities. Streamflow, groundwater, reservoir, and snowpack data are key to monitoring and forecasting water supply.
Learn MoreDrought can reduce the water availability and water quality necessary for productive farms, ranches, and grazing lands, resulting in significant negative direct and indirect economic impacts to the agricultural sector. Monitoring agricultural drought typically focuses on examining levels of precipitation, evaporative demand, soil moisture, and surface/groundwater quantity and quality.
Learn MoreDrought is defined as the lack of precipitation over an extended period of time, usually for a season or more, that results in a water shortage. Changes in precipitation can substantially disrupt crops and livestock, influence the frequency and intensity of severe weather events, and affect the quality and quantity of water available for municipal and industrial use.
Learn MorePeriods of drought can lead to inadequate water supply, threatening the health, safety, and welfare of communities. Streamflow, groundwater, reservoir, and snowpack data are key to monitoring and forecasting water supply.
Learn MoreDrought can reduce the water availability and water quality necessary for productive farms, ranches, and grazing lands, resulting in significant negative direct and indirect economic impacts to the agricultural sector. Monitoring agricultural drought typically focuses on examining levels of precipitation, evaporative demand, soil moisture, and surface/groundwater quantity and quality.
Learn More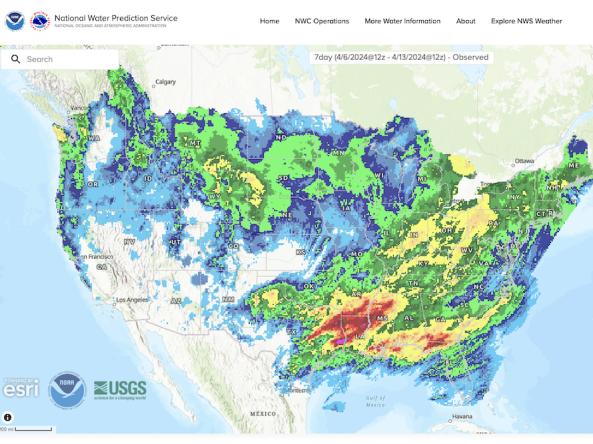
The National Weather Service's National Water Prediction Service (NWPS) provides short-term observed and climatic trends of precipitation across the lower 48 United States (CONUS), Puerto Ric
Climate Engine allows users to analyze and interact with climate and earth observations for decision support related to drought, water use, agricultural, wildfire, and ecology.
NCEI provides a variety of temperature and precipitation products available at the National and Global scale.
HPRCC produces daily climate maps using data from the Applied Climate Information System (ACIS). The maps and data can be accessed and downloaded from the HPRCC website.
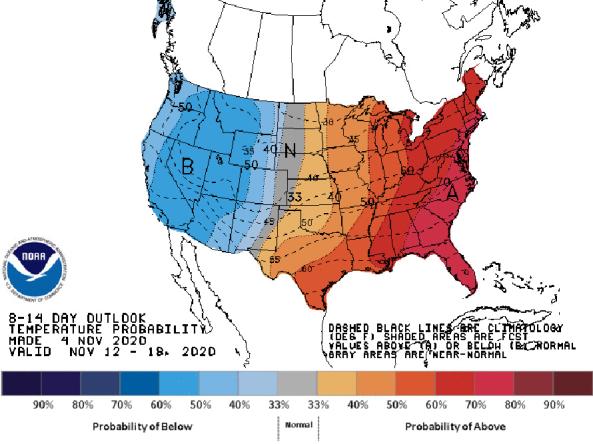
National Weather Service (NWS) Climate Prediction Center (CPC) generates outlooks that view probabilities of above- or below-normal temperature and precipitation maps at the 6-10 Day, 8-14 Day, Wee
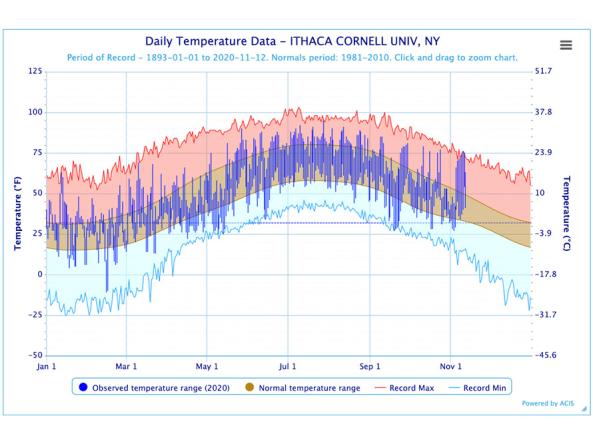
The Regional Climate Centers (RCC) Applied Climate Information System (ACIS) offers interactive temperature and precipitation charts with single- or multi-station capabilities.

Related Content
Research & Learn | Flash Drought
Flash drought intensifies rapidly due to changes in precipitation, temperature, wind, and radiation. Find more information about flash drought on this Research & Learn page.
Research & Learn | Monitoring Drought
Drought monitoring at the national, regional, and local levels is an integral part of drought early warning, planning, and mitigation. Learn more about drought monitoring here.