Historical Drought
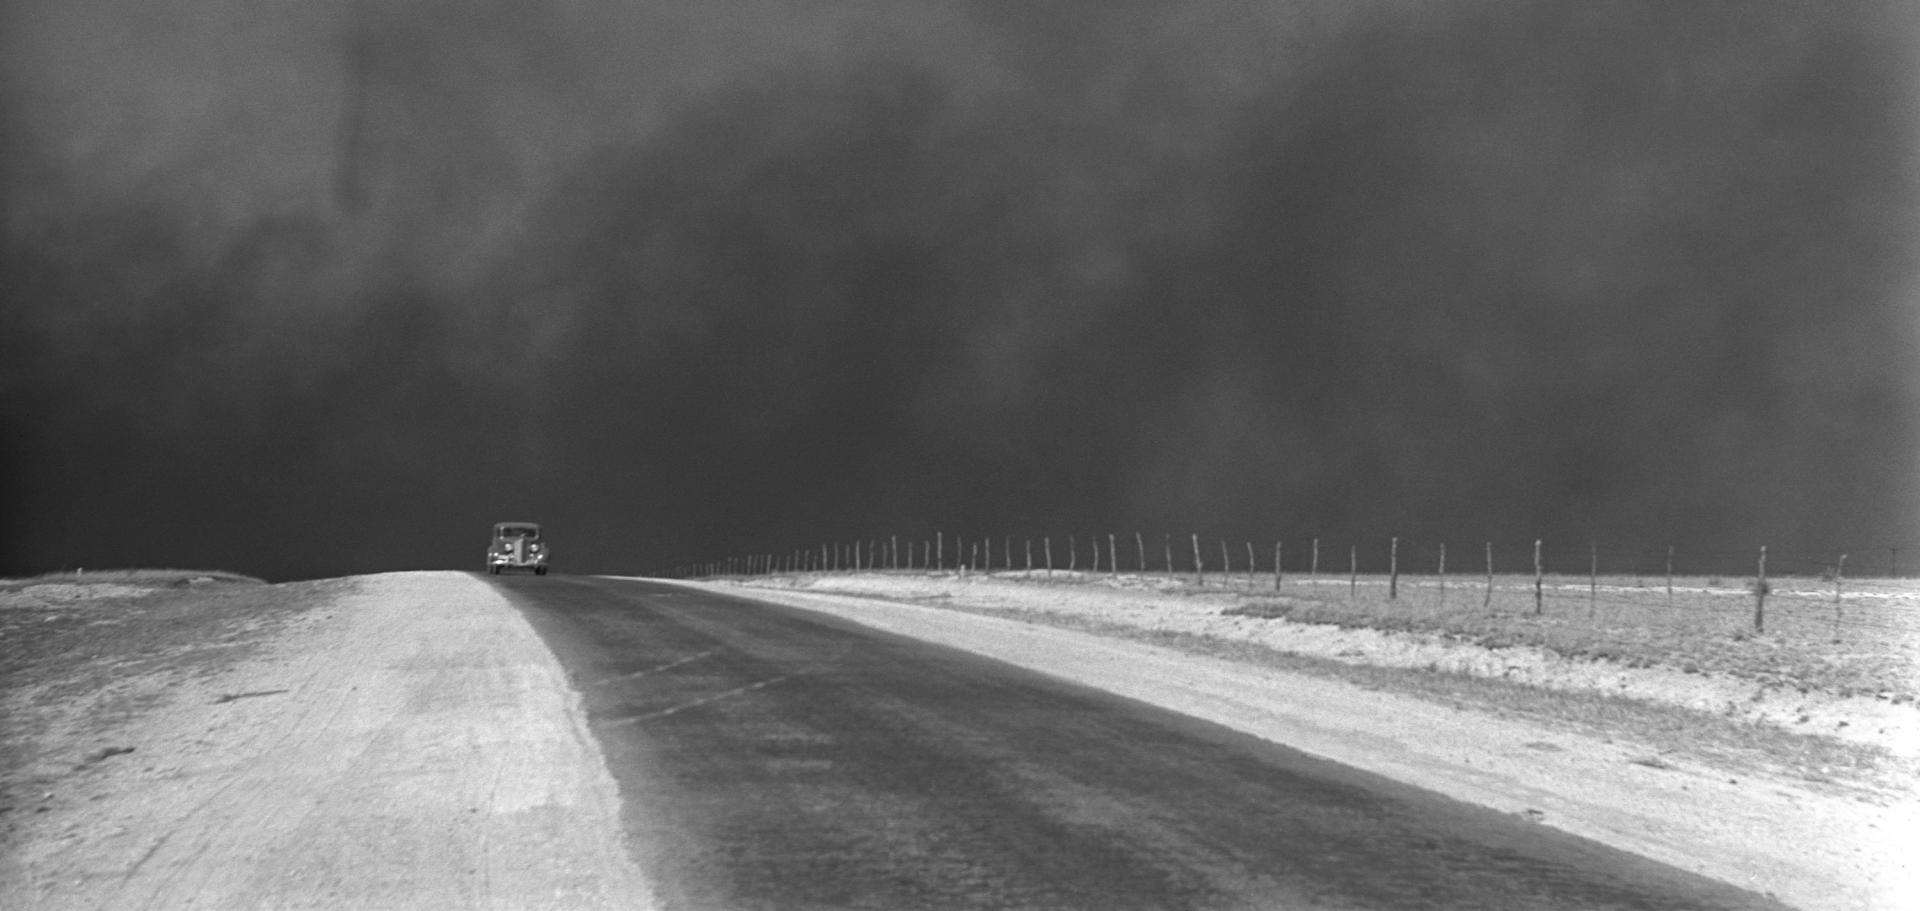
The 1930s “Dust Bowl” drought remains the most significant drought—meteorological and agricultural—in the United States’ historical record.
Drought Throughout History
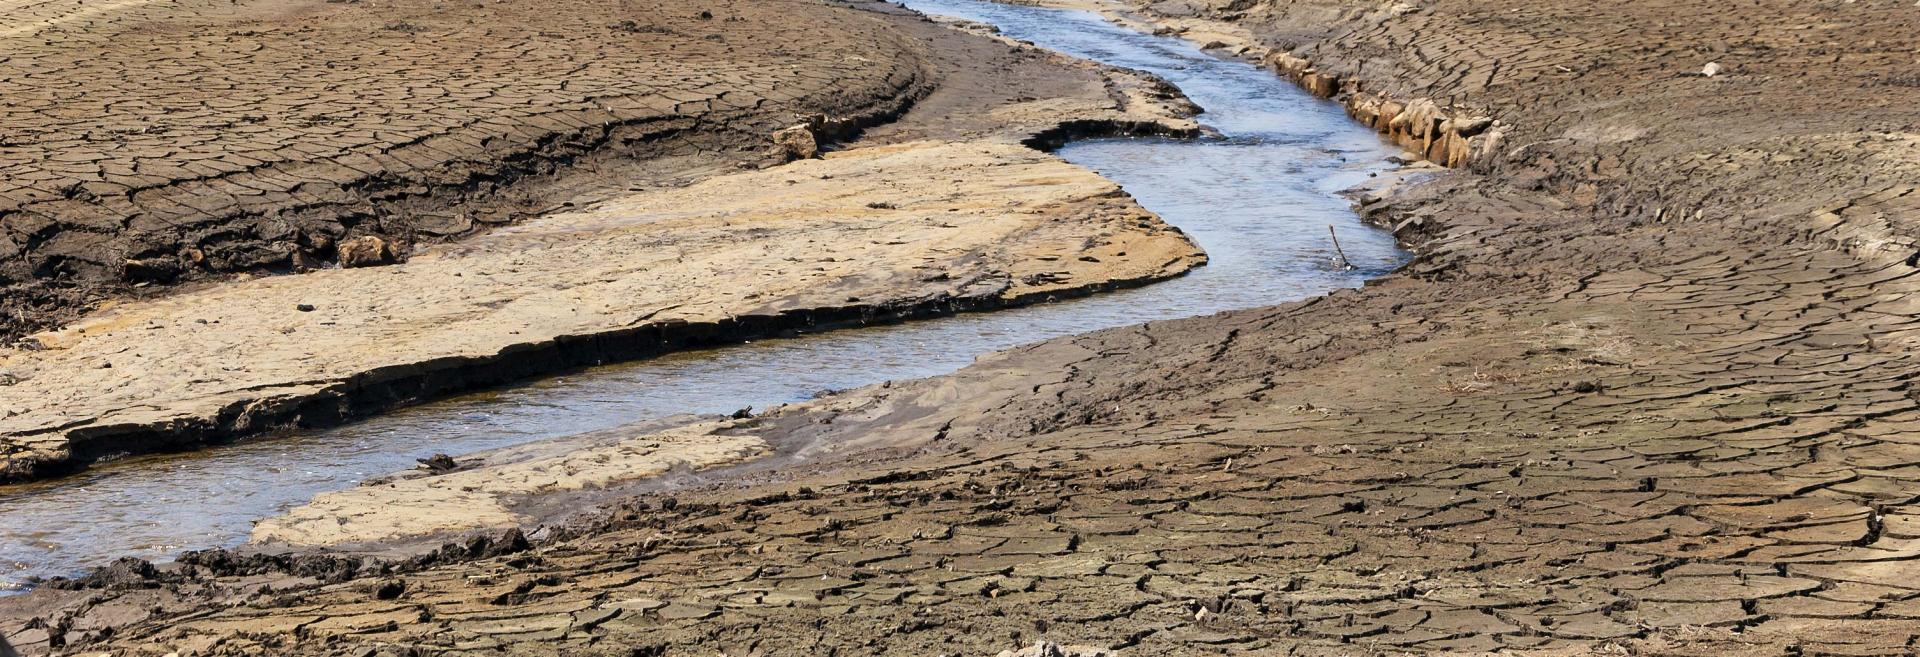
Drought is a normal climate pattern that has occurred in varying degrees of length, severity, and size throughout history.
Tree ring archives indicate that agricultural droughts such as those that happened in the United States during the 1930s Dust Bowl era have occurred occasionally over the last 2,000 years, and climate model simulations suggest that droughts that may last several years to even decades occur naturally in the southwestern U.S.

Droughts in the 20th- and 21st-Century United States
Between 1895 and 2010, on average, around 14 percent of the United States was experiencing severe to extreme drought (D2–D3) in any given year, according to the U.S. Drought Monitor. While recent droughts and heat waves have made news and broken records in some areas of the United States, by the size of the geographical area affected and the length of time that it persisted, the Dust Bowl era of the 1930s is still the most notable drought and extreme heat event in the U.S. historical record.
A 2017 study identified 13 major drought episodes—when 10 percent or more of the country is in drought—that affected the United States between 1900 and 2014. Of these, 11 covered 10 percent or more of the United States (excepting Alaska and Hawaii) for at least 90 percent of their duration. The three longest drought episodes occurred between July 1928 and May 1942 (the 1930s Dust Bowl drought), July 1949 and September 1957 (the 1950s drought), and June 1998 and December 2014 (the early 21st-century drought). Each of these drought episodes covered 60 percent or more of the contiguous United States at its peak and lasted 99 months or longer (NCEI; Heim 2017).
At the beginning of the 21st century, several regional droughts were plaguing parts of the contiguous United States. By 2012, these droughts had combined into a national-scale event the likes of which hadn’t been seen in decades. With two-thirds of the lower 48 states in drought by the end of September 2012, many began to speculate that it was as severe as the drought episodes of the 1930s and 1950s.
Key Takeaways

Looking Forward
Global climate change is expected to change drought patterns, their frequency, and intensity across the United States. As the Earth’s average temperatures have risen, evaporation rates have increased, making more water available for precipitation in some areas but contributing to drying in others. As the climate continues to change, some areas will likely experience increased precipitation and flooding, but other locations will likely experience less precipitation and increased risk of drought.
For example, climate projections for the southwestern United States indicate that this region may experience chronic future precipitation deficits, particularly in the spring, increasing the risk of meteorological drought. Significant declines in precipitation are not confidently projected in the U.S. outside of the Southwest; however, higher temperatures in the future may increase the frequency and magnitude of agricultural drought across the country as a result of increased evapotranspiration.
The NOAA Drought Task Force Report on the 2020–2021 Southwestern U.S. Drought found that continued warming of the Southwest U.S. due to greenhouse gas emissions will make even randomly occurring seasons of average- to below-average precipitation a potential drought trigger, and intensify droughts beyond what would be expected from rainfall or snowpack deficits alone. This report showed that the 2020–2021 southwestern U.S. drought could not have been as severe as it was without that added warming. In fact, a drought of that severity could not have happened in a pre-2000 climate. The report concluded, “In the longer-term, the atmospheric demands on regional land surface moisture will continue to increase due to…human-caused global warming. Such growing demands mean a more arid U.S. Southwest and greater sensitivity to droughts in the future.”
The Climate Science Special Report, Part I of the Fourth National Climate Assessment, found that annual trends toward earlier spring melt and reduced snowpack are already affecting water resources in the western United States. These trends are expected to continue. The report also points out that, under higher emission scenarios and assuming that no changes are made to current management of water resources, chronic, long-duration hydrological drought is increasingly possible before the end of this century.
Key Takeaways
Resources
Helpful Links
Interactive Historical Drought Tool
U.S. Drought Portal
Research Spotlight: Climate-Driven Megadrought
U.S. Drought Portal
Historic Palmer Drought Severity Index
National Drought Mitigation Center
Drought Risk Atlas
National Drought Mitigation Center
Story Map: Drought Over Time
USDA Forest Service | Office of Climate and Sustainability
Story Map: Historical Temperature
USDA Forest Service | Office of Climate and Sustainability
Story Map: Precipitation
USDA Forest Service | Office of Climate and Sustainability
Story Map: Temperature
USDA Forest Service | Office of Climate and Sustainability
Videos
Megadroughts Projected for American West
NASA Goddard
Human Influence on Global Droughts Goes Back 100 Years
NASA Goddard
References
Content on this page excerpted and adapted from:
NOAA Drought Task Force Report on the Southwestern U.S. Drought
NOAA Drought Task Force IV
Drought Monitoring: Historical and Current Perspectives
Drought Mitigation Center Faculty Publications, 2012
A Comparison of the Early Twenty-First Century Drought in the United States to the 1930s and 1950s Drought Episodes
Bulletin of the American Meteorological Society, 98(12), 2017
Climate Science Special Report: Fourth National Climate Assessment, Volume I | Chapter 8: Droughts, Floods, and Wildfire
U.S. Global Change Research Program
A Historical Perspective on Drought
NOAA National Centers for Environmental Information
Climate Change Indicators: Drought
U.S. Environmental Protection Agency

Related Content
Data & Maps | Historical Data and Conditions
Explore historical drought conditions on graphs and maps and access historical drought information from the U.S. Drought Monitor, Standardized Precipitation Index, and paleoclimate data.
Data & Maps | Paleoclimate
Paleoclimatologists use proxy climate records to estimate past conditions, extending our understanding of climate back hundreds to millions of years.

