Agriculture
Agricultural drought results from below-normal precipitation and/or above-normal temperatures/wind that evaporate moisture from soils and plants. The location, extent, and severity of drought impacts to agriculture depend on underlying social and ecosystem vulnerabilities, access to irrigation, types of crops grown, and other factors.
Agricultural Drought
According to the National Drought Mitigation Center, agricultural drought “links various characteristics of meteorological (or hydrological) drought to agricultural impacts.” Detection and monitoring of agricultural drought focuses on precipitation deficits, differences between actual and potential evapotranspiration (evaporation from the soil and other surfaces and transpiration from plants), soil water deficits, and reduced water availability.
U.S. Crops and Livestock in Drought
Corn Produced by County
U.S. Drought Monitor
D0 - Abnormally Dry
Abnormally Dry (D0) indicates a region that is going into or coming out of drought, according to the U.S. Drought Monitor. View typical impacts by state.
D1 – Moderate Drought
Moderate Drought (D1) is the first of four drought categories (D1–D4), according to the U.S. Drought Monitor. View typical impacts by state.
D2 – Severe Drought
Severe Drought (D2) is the second of four drought categories (D1–D4), according to the U.S. Drought Monitor. View typical impacts by state.
D3 – Extreme Drought
Extreme Drought (D3) is the third of four drought categories (D1–D4), according to the U.S. Drought Monitor. View typical impacts by state.
D4 – Exceptional Drought
Exceptional Drought (D4) is the most intense drought category, according to the U.S. Drought Monitor. View typical impacts by state.
Soybeans Produced by County
U.S. Drought Monitor
D0 - Abnormally Dry
Abnormally Dry (D0) indicates a region that is going into or coming out of drought, according to the U.S. Drought Monitor. View typical impacts by state.
D1 – Moderate Drought
Moderate Drought (D1) is the first of four drought categories (D1–D4), according to the U.S. Drought Monitor. View typical impacts by state.
D2 – Severe Drought
Severe Drought (D2) is the second of four drought categories (D1–D4), according to the U.S. Drought Monitor. View typical impacts by state.
D3 – Extreme Drought
Extreme Drought (D3) is the third of four drought categories (D1–D4), according to the U.S. Drought Monitor. View typical impacts by state.
D4 – Exceptional Drought
Exceptional Drought (D4) is the most intense drought category, according to the U.S. Drought Monitor. View typical impacts by state.
Hay Produced by County
U.S. Drought Monitor
D0 - Abnormally Dry
Abnormally Dry (D0) indicates a region that is going into or coming out of drought, according to the U.S. Drought Monitor. View typical impacts by state.
D1 – Moderate Drought
Moderate Drought (D1) is the first of four drought categories (D1–D4), according to the U.S. Drought Monitor. View typical impacts by state.
D2 – Severe Drought
Severe Drought (D2) is the second of four drought categories (D1–D4), according to the U.S. Drought Monitor. View typical impacts by state.
D3 – Extreme Drought
Extreme Drought (D3) is the third of four drought categories (D1–D4), according to the U.S. Drought Monitor. View typical impacts by state.
D4 – Exceptional Drought
Exceptional Drought (D4) is the most intense drought category, according to the U.S. Drought Monitor. View typical impacts by state.
Beef Cattle Produced by County
U.S. Drought Monitor
D0 - Abnormally Dry
Abnormally Dry (D0) indicates a region that is going into or coming out of drought, according to the U.S. Drought Monitor. View typical impacts by state.
D1 – Moderate Drought
Moderate Drought (D1) is the first of four drought categories (D1–D4), according to the U.S. Drought Monitor. View typical impacts by state.
D2 – Severe Drought
Severe Drought (D2) is the second of four drought categories (D1–D4), according to the U.S. Drought Monitor. View typical impacts by state.
D3 – Extreme Drought
Extreme Drought (D3) is the third of four drought categories (D1–D4), according to the U.S. Drought Monitor. View typical impacts by state.
D4 – Exceptional Drought
Exceptional Drought (D4) is the most intense drought category, according to the U.S. Drought Monitor. View typical impacts by state.
This map displays acres of corn crop production by county alongside current U.S. Drought Monitor (USDM) drought designations.
Crop data come from the U.S. Department of Agriculture's Census of Agriculture, which is conducted every 5 years (data from 2017).
This map displays acres of soybean crop production by county alongside current U.S. Drought Monitor (USDM) drought designations.
Crop data come from the U.S. Department of Agriculture's Census of Agriculture, which is conducted every 5 years (data from 2017).
This map displays acres of hay crop production by county alongside current U.S. Drought Monitor (USDM) drought designations.
Crop data come from the U.S. Department of Agriculture's Census of Agriculture, which is conducted every 5 years (data from 2017).
This map displays beef cattle by county alongside current U.S. Drought Monitor (USDM) drought designations.
Livestock data come from the U.S. Department of Agriculture's Census of Agriculture, which is conducted every 5 years (data from 2017).
The USDA National Agricultural Statistics Service conducts a Census of Agriculture every 5 years (data from 2017). The U.S. Drought Monitor is updated every Thursday morning, with data valid through that Tuesday at 7 am Eastern.
The USDA National Agricultural Statistics Service conducts a Census of Agriculture every 5 years (data from 2017). The U.S. Drought Monitor is updated every Thursday morning, with data valid through that Tuesday at 7 am Eastern.
The USDA National Agricultural Statistics Service conducts a Census of Agriculture every 5 years (data from 2017). The U.S. Drought Monitor is updated every Thursday morning, with data valid through that Tuesday at 7 am Eastern.
The USDA National Agricultural Statistics Service conducts a Census of Agriculture every 5 years (data from 2017). The U.S. Drought Monitor is updated every Thursday morning, with data valid through that Tuesday at 7 am Eastern.
Soil Moisture Conditions
0–100 cm Soil Moisture Percentile
0–2nd Percentile
Soil moisture at 0–100cm depth is in the bottom 2% (0–2nd percentile) of historical measurements for this day of the year. Learn more.
2nd–5th Percentile
Soil moisture at 0–100cm depth falls between the 2nd to 5th percentile of historical measurements for this day of the year. Learn more.
5th–10th Percentile
Soil moisture at 0–100cm depth falls between the 5th to 10th percentile of historical measurements for this day of the year. Learn more.
10th–20th Percentile
Soil moisture at 0–100cm depth falls between the 10th to 20th percentile of historical measurements for this day of the year. Learn more.
20th–30th Percentile
Soil moisture at 0–100cm depth falls between the 20th to 30th percentile of historical measurements for this day of the year. Learn more.
30th–70th Percentile
Soil moisture at 0–100cm depth falls between the 30th to 70th percentile of historical measurements for this day of the year. Learn more.
70th–80th Percentile
Soil moisture at 0–100cm depth falls between the 70th to 80th percentile of historical measurements for this day of the year. Learn more.
80th–90th Percentile
Soil moisture at 0–100cm depth falls between the 80th to 90th percentile of historical measurements for this day of the year. Learn more.
90th–95th Percentile
Soil moisture at 0–100cm depth falls between the 90th to 95th percentile of historical measurements for this day of the year. Learn more.
95th–98th Percentile
Soil moisture at 0–100cm depth falls between the 95th to 98th percentile of historical measurements for this day of the year. Learn more.
98th–100th Percentile
Soil moisture at 0–100cm depth is in the top 2% (98th to 100th percentile) of historical measurements for this day of the year. Learn more.
Soil Moisture Anomaly
An accurate depiction of soil moisture conditions can provide valuable insights for agricultural monitoring, weather prediction, and drought and flood early warning.
This map shows the moisture content of the top 1 meter of soil compared to historical conditions from 1981–2013, based on NASA's Short-term Prediction and Transition Center – Land Information System (SPoRT-LIS).
Red and orange hues indicate drier soils, while greens and blues indicate greater soil moisture.
An accurate depiction of soil moisture conditions can provide valuable insights for agricultural monitoring, weather prediction, and drought and flood early warning.
This map shows the moisture content of the top 1 meter of soil, according to NASA's Crop Condition and Soil Moisture Analytics tool (Crop-CASMA). It relies on remotely sensed soil moisture data derived from NASA missions.
Soil moisture is shown as a deviation from average soil moisture conditions from 2015–present. Brown hues indicate below-average soil moisture, and blue hues indicate above-average soil moisture.
This map updates daily with data from NASA's Short-term Prediction and Transition Center – Land Information System (SPoRT-LIS).
Data are updated daily, with a 3-day delay.
Soil moisture plays an important role in drought and flood forecasting, agricultural monitoring, forest fire prediction, water supply management, and other natural resource activities. Soil moisture observations can forewarn of impending drought or flood conditions before other more standard indicators are triggered.
Learn MoreFlash drought is the rapid onset or intensification of drought. Unlike slow-evolving drought, which is caused by a decline in precipitation, flash drought occurs when low precipitation is accompanied by abnormally high temperatures, high winds, and/or changes in radiation. These sometimes-rapid changes can quickly raise evapotranspiration rates and remove available water from the landscape.
Learn MoreDrought can reduce the water availability and water quality necessary for productive farms, ranches, and grazing lands, resulting in significant negative direct and indirect economic impacts to the agricultural sector. Monitoring agricultural drought typically focuses on examining levels of precipitation, evaporative demand, soil moisture, and surface/groundwater quantity and quality.
Learn MoreDrought can result in reduced growth rates, increased stress on vegetation, and alterations or transformations to the plant community and/or the entire ecosystem. During periods of drought, plants increase their demand for water through increased evapotranspiration and longer growing seasons.
Learn MoreSoil moisture plays an important role in drought and flood forecasting, agricultural monitoring, forest fire prediction, water supply management, and other natural resource activities. Soil moisture observations can forewarn of impending drought or flood conditions before other more standard indicators are triggered.
Learn More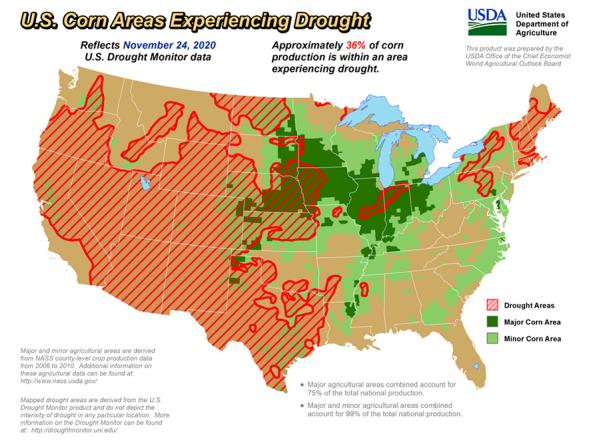
The U.S. Department of Agriculture produces weekly maps and charts displaying locations and percentages of drought-affected areas corn, soybeans, hay, cattle, and winter wheat.
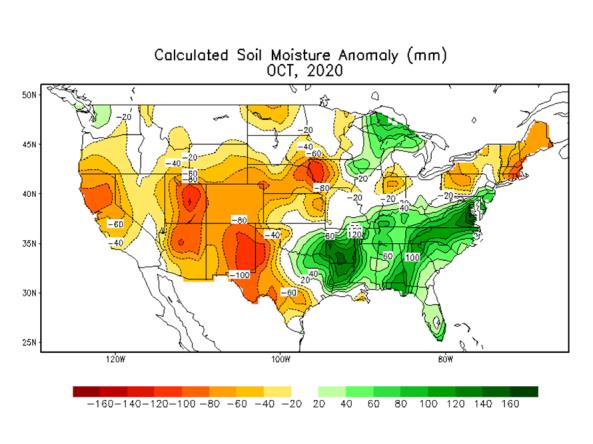
Soil moisture conditions at the daily and monthly scales depicting total soil moisture, percentiles and anomalies, as well as monthly and seasonal change.
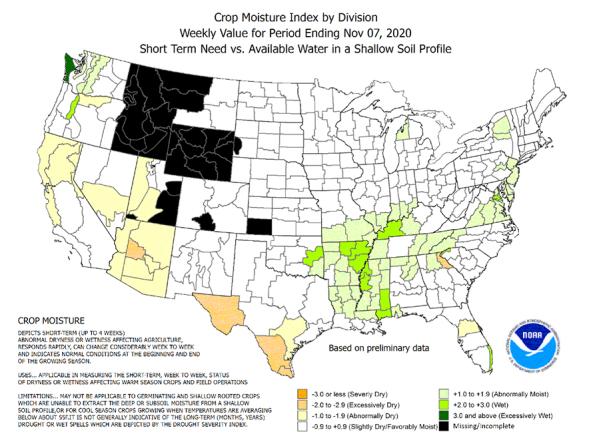
The CMI is an index of the relative dryness or wetness affecting water sensitive economies. It provides the short-term or current status of purely agricultural drought or moisture surplus.
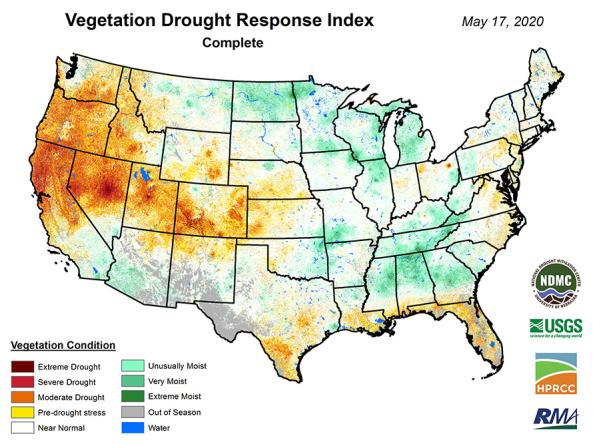
VegDRI: a weekly depiction of vegetation stress across the contiguous United States.
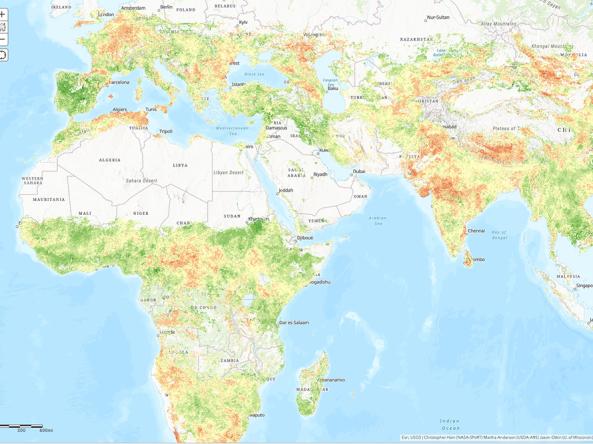
NASA/USDA provides access to Evaporative Stress Index (ESI) data products - a drought index based on remotely sensed evapotranspiration (ET).
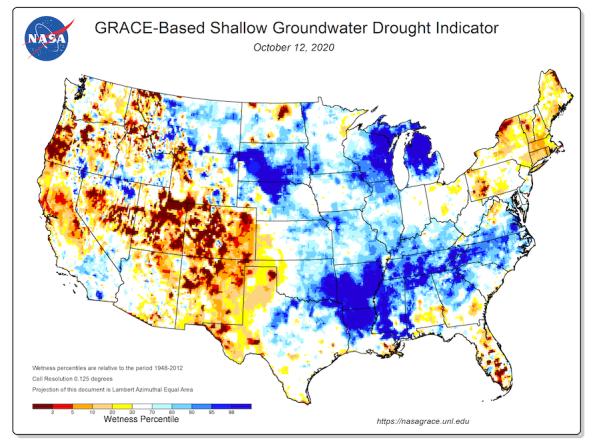
Groundwater and soil moisture drought indicators based on terrestrial water storage observations derived from GRACE satellite data and integrated with other observations, produced each week by NASA

Impacts and Related Content
Reduced Crop and Forage Yields
Agricultural drought by definition refers to conditions that result in adverse plant responses, which can range from reduced crop and forage yields to total crop or forage failure.
Increased Expenses for Feeding/Watering/De-Stocking Livestock
During agricultural drought, farmers and ranchers face increased expenses for feeding and watering livestock, and significant costs may be incurred if they are forced to de-stock due to insufficient feed.
Widespread Economic Impacts
The costs of agricultural drought impacts are spread across the food system, affecting everyone from farm input suppliers to farmers to consumers.
Ecosystem Functions
Drought can contribute to insect and plant disease outbreaks that stress vegetation. Drought also increases the risks of wind erosion and wildfire, which can impact the health of agricultural communities. Finally, drought can alter ecosystem functions that are key for agriculture, including pollination, soil retention, and soil fertility.
By Sector | Agriculture
Visit the Sector page to learn more about drought's substantial negative impacts on agricultural production.
Agriculture Resources and Research
Web Resources
Climate Toolbox | Future Crop Sustainability Tool
Midwest Regional Climate Center | Useful to Usable (U2U) Crop Decision Dashboard
Midwest Regional Climate Center | Irrigation Investment Tool
State Mesonet Observational Data
U.S. Agricultural Commodities in Drought
USDA | National Agricultural Statistics Service | Agricultural Impacts by State