U.S. Agricultural Commodities in Drought
United States Department of Agriculture (USDA), National Drought Mitigation Center
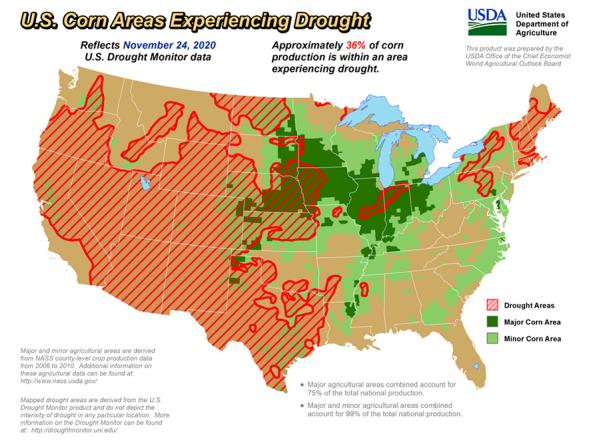
The U.S. Agricultural Commodities in Drought website provides information about the percentage of growing area that is affected by drought for various agricultural commodities, according to the U.S. Drought Monitor.
Statistics are calculated each week by overlaying U.S. Drought Monitor data on drought extent and severity over maps of major and minor agricultural areas for several commodities. Agricultural data are obtained from the U.S. Department of Agriculture National Agricultural Statistics Service Census of Agriculture, which is undertaken every five years.
Users can view statistics, time series, and maps for both row crops and livestock & forage, as well as drought monitoring, risk management, and planning resources for speciality crops.
In addition, users can view current and historical crop progress reports from the U.S. Department of Agriculture. During the growing season, these maps are generated each week by the USDA Office of the Chief Economist, based on Crop Progress report data from the USDA National Agricultural Statistics Service, to facilitate internal USDA assessments of domestic crop progress and conditions.
How to
How do I use the site?
- To view statistics, maps, and resources for specific agricultural commodities, select a category from the home page: row crops, livestock & forage, or specialty crops.
- All three pages contains links to resources for drought monitoring & prediction, risk management and disaster relief programs, drought planning & management, and additional state and regional resources.
- The row crops and livestock & forage pages contain current statistics showing the percent area (%) of agricultural commodities affected by drought, as well as links to data tables, time series graphics, and national maps.
- Use the dropdown menus to select specific commodity types and location for the data tables and time series, and to select commodity types and dates for the maps.
- To zoom in on a particular time period on the time series graphs, click and drag your cursor. Double click anywhere on the time series to return to the full period of record.
- To view maps and data from the USDA National Agricultural Statistics Service's weekly Crop Progress Reports, click the "Crop Progress" link in the main menu.
- Select the type of map (e.g., progress this week, topsoil moisture), date, crop, and crop stage (e.g., planted, harvested), and other settings from the dropdown menus to display the desired map.
- Click the "Download Map" button to download the map image as a PNG file.
- Click the text links above the map to view more Crop Progress graphical products, metadata, and terms and definitions from the USDA.
- To view an archive of U.S. Agriculture in Drought PDF reports produced by the USDA Office of the Chief Economist, click the "Archive" link in the main site menu, then select a date to view the PDF. The archive goes back to July 31, 2012.
Access
U.S. Agricultural Commodities in Drought: Main website to access data tables, maps, and time series
Percentage of Crops and Livestock in Drought Maps (PDF): View current USDA report on the percentage of crops and livestock located in drought, produced weekly on Thursdays.
U.S. Agricultural Commodities in Drought Archive: View PDF reports going back to 2012.
Documentation
Statistics are calculated each week by overlaying U.S. Drought Monitor (USDM) data on drought extent and severity over maps of major and minor agricultural areas for several commodities. Agricultural data are obtained from the U.S. Department of Agriculture National Agricultural Statistics Service Census of Agriculture, which is undertaken every five years.
Major and minor agricultural areas are designated based on the intensity of production, the livestock inventory, or the acres harvested in the case of alfalfa and hay. A county is considered in drought if the center point of the county is in a drought area according to the USDM. The statistics presented on this site are calculated for each commodity by summing production across all counties in drought and then dividing that by the total national production for that commodity.
Additional Documentation: