Vegetation
Vegetation refers to plant life, including agricultural and developed vegetation, desert and semi-desert, forest, shrubs, herbs, and natural land cover. Drought can result in reduced growth rates, increased stress on vegetation, and alterations or transformations to the plant community and/or the entire ecosystem.
Vegetation and Drought

Water is necessary for every aspect of plant development, including gemination, cell division, and respiration. The stress of drought may induce complex changes in biochemical, physiological, and morphological aspects of plants, limiting vegetative health, growth, regeneration of the plant population, the vegetative community in a region, and/or the entire ecosystem. The exact nature of impacts to vegetation depends on the drought—its severity, spatial extent, seasonal timing, and persistence, and the capacity of the vegetation to absorb and adapt to disturbances, and vegetation management actions.
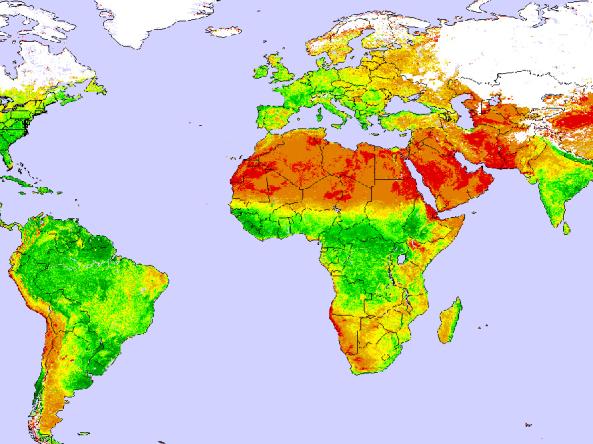
The Vegetation Health Index is a proxy characterizing vegetation health or a combined estimation of moisture and thermal conditions. Vegetation health is often used to estimate crop condition and anticipated yield. Values below 40 (pink/orange shades) indicate different levels of vegetation stress, and losses of crop and pasture production might be expected. Values above 60 (green/blue shades) indicate favorable conditions.
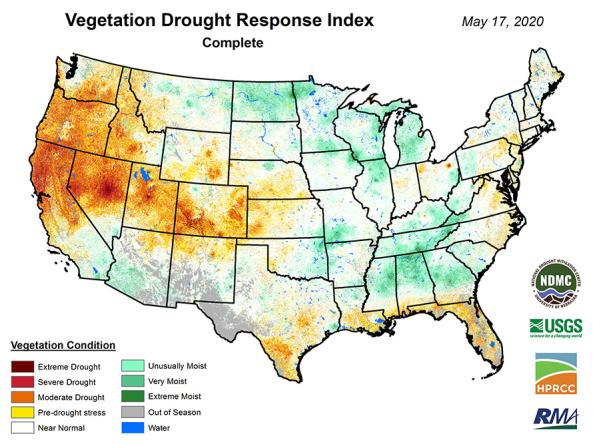
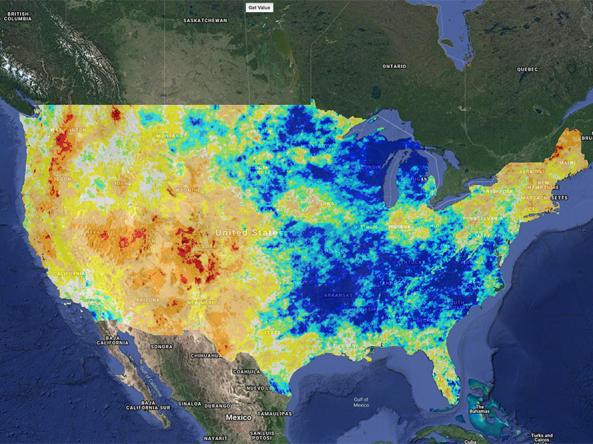
The Vegetation Drought Response Index (VegDRI) is a weekly depiction of drought's effects on vegetation stress across the contiguous United States. Yellow/red hues indicate drought conditions, while green hues indicate moist conditions.
The map incorporates satellite observations of vegetation conditions, climate data, and environmental characteristics (e.g., land cover, land use, soil type).
A drought index combines multiple drought indicators (e.g., precipitation, temperature, soil moisture) to depict drought conditions. For some products, like the U.S. Drought Monitor, authors combine their analysis of drought indicators with input from local observers. Other drought indices, like the Standardized Precipitation Index (SPI), use an objective calculation to describe the severity, location, timing, and/or duration of drought.
Learn MoreFlash drought is the rapid onset or intensification of drought. Unlike slow-evolving drought, which is caused by a decline in precipitation, flash drought occurs when low precipitation is accompanied by abnormally high temperatures, high winds, and/or changes in radiation. These sometimes-rapid changes can quickly raise evapotranspiration rates and remove available water from the landscape.
Learn MoreDrought can reduce the water availability and water quality necessary for productive farms, ranches, and grazing lands, resulting in significant negative direct and indirect economic impacts to the agricultural sector. Monitoring agricultural drought typically focuses on examining levels of precipitation, evaporative demand, soil moisture, and surface/groundwater quantity and quality.
Learn MoreDrought can result in reduced growth rates, increased stress on vegetation, and alterations or transformations to the plant community and/or the entire ecosystem. During periods of drought, plants increase their demand for water through increased evapotranspiration and longer growing seasons.
Learn MoreA drought index combines multiple drought indicators (e.g., precipitation, temperature, soil moisture) to depict drought conditions. For some products, like the U.S. Drought Monitor, authors combine their analysis of drought indicators with input from local observers. Other drought indices, like the Standardized Precipitation Index (SPI), use an objective calculation to describe the severity, location, timing, and/or duration of drought.
Learn MoreFlash drought is the rapid onset or intensification of drought. Unlike slow-evolving drought, which is caused by a decline in precipitation, flash drought occurs when low precipitation is accompanied by abnormally high temperatures, high winds, and/or changes in radiation. These sometimes-rapid changes can quickly raise evapotranspiration rates and remove available water from the landscape.
Learn MoreDrought can alter the ecological balance of natural systems and harm fish, wildlife, and plant species, as well as the benefits that these ecosystems provide to human communities. The environmental consequences of drought include losses in plant growth; increases in fire and insect outbreaks; altered rates of carbon, nutrient, and water cycling; and local species extinctions.
Learn MoreDrought can result in reduced growth rates, increased stress on vegetation, and alterations or transformations to the plant community and/or the entire ecosystem. During periods of drought, plants increase their demand for water through increased evapotranspiration and longer growing seasons.
Learn MoreUnfavorable Conditions
Favorable Conditions
Vegetation Conditions
The Vegetation Health Index is a proxy characterizing vegetation health or a combined estimation of moisture and thermal conditions. Vegetation health is often used to estimate crop condition and anticipated yield. Values below 40 (pink/orange shades) indicate different levels of vegetation stress, and losses of crop and pasture production might be expected. Values above 60 (green/blue shades) indicate favorable conditions.
The Vegetation Drought Response Index (VegDRI) is a weekly depiction of drought's effects on vegetation stress across the contiguous United States. Yellow/red hues indicate drought conditions, while green hues indicate moist conditions.
The map incorporates satellite observations of vegetation conditions, climate data, and environmental characteristics (e.g., land cover, land use, soil type).
The Vegetation Health Index map updates weekly.
VegDRI data are updated weekly.
A drought index combines multiple drought indicators (e.g., precipitation, temperature, soil moisture) to depict drought conditions. For some products, like the U.S. Drought Monitor, authors combine their analysis of drought indicators with input from local observers. Other drought indices, like the Standardized Precipitation Index (SPI), use an objective calculation to describe the severity, location, timing, and/or duration of drought.
Learn MoreFlash drought is the rapid onset or intensification of drought. Unlike slow-evolving drought, which is caused by a decline in precipitation, flash drought occurs when low precipitation is accompanied by abnormally high temperatures, high winds, and/or changes in radiation. These sometimes-rapid changes can quickly raise evapotranspiration rates and remove available water from the landscape.
Learn MoreDrought can reduce the water availability and water quality necessary for productive farms, ranches, and grazing lands, resulting in significant negative direct and indirect economic impacts to the agricultural sector. Monitoring agricultural drought typically focuses on examining levels of precipitation, evaporative demand, soil moisture, and surface/groundwater quantity and quality.
Learn MoreDrought can result in reduced growth rates, increased stress on vegetation, and alterations or transformations to the plant community and/or the entire ecosystem. During periods of drought, plants increase their demand for water through increased evapotranspiration and longer growing seasons.
Learn MoreA drought index combines multiple drought indicators (e.g., precipitation, temperature, soil moisture) to depict drought conditions. For some products, like the U.S. Drought Monitor, authors combine their analysis of drought indicators with input from local observers. Other drought indices, like the Standardized Precipitation Index (SPI), use an objective calculation to describe the severity, location, timing, and/or duration of drought.
Learn MoreFlash drought is the rapid onset or intensification of drought. Unlike slow-evolving drought, which is caused by a decline in precipitation, flash drought occurs when low precipitation is accompanied by abnormally high temperatures, high winds, and/or changes in radiation. These sometimes-rapid changes can quickly raise evapotranspiration rates and remove available water from the landscape.
Learn MoreDrought can alter the ecological balance of natural systems and harm fish, wildlife, and plant species, as well as the benefits that these ecosystems provide to human communities. The environmental consequences of drought include losses in plant growth; increases in fire and insect outbreaks; altered rates of carbon, nutrient, and water cycling; and local species extinctions.
Learn MoreDrought can result in reduced growth rates, increased stress on vegetation, and alterations or transformations to the plant community and/or the entire ecosystem. During periods of drought, plants increase their demand for water through increased evapotranspiration and longer growing seasons.
Learn MoreData and Map Gallery
Monitoring vegetation productivity responses to drought variability over a large spatial extent is generally aided by remote sensing approaches, particularly in areas with sparse climate and vegetation monitoring stations (El-Vilaly 2018). Below are resources to monitor drought effects on vegetation, access indices describing evaporative demand and stress, and consult maps depicting vegetation health, greenness, drought severity, and more.
VegDRI: a weekly depiction of vegetation stress across the contiguous United States.
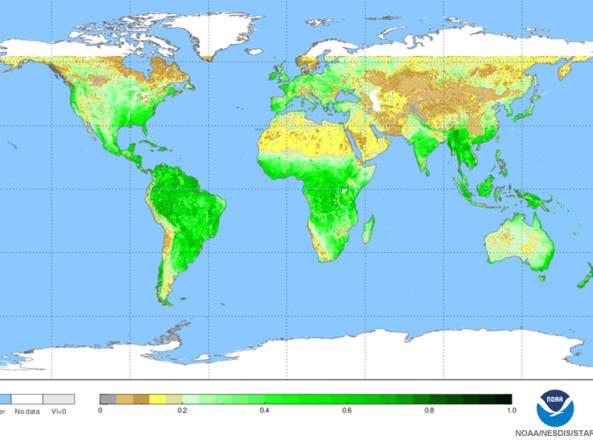
NOAA Center for Satellite Applications and Research (STAR) normalized difference vegetation index (NDVI) maps
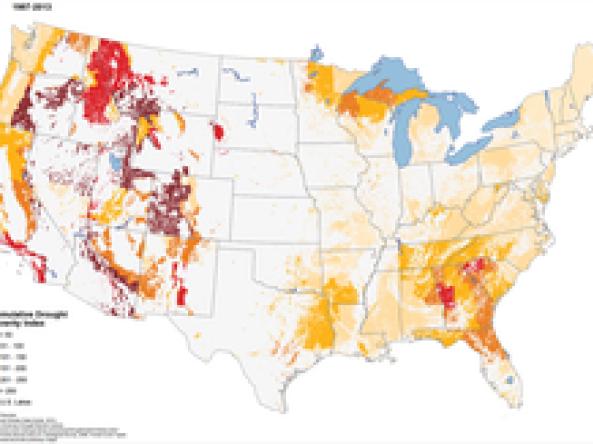
U.S Forest Service Cumulative Drought Severity Index (CDSI): allows users to compare the severity of droughts experienced by different forest ecosystems between two periods, 1960-1986 & 1987-20

A selection of worldwide maps monitoring different aspects of vegetation health.
Global and Regional Vegetation Health (VH) is a NOAA/NESDIS system estimating vegetation health, moisture condition, thermal condition and their products.
Climate Engine allows users to analyze and interact with climate and earth observations for decision support related to drought, water use, agricultural, wildfire, and ecology.

Related Content
Data & Maps | Soil Moisture
Drought can affect soil chemical, physical, and biological activities that are essential for plant and soil health. Impacts may include lack of nutrient uptake by vegetation, increased soil temperatures, altered microbial activity, changes in organic matter decomposition, and increased release of CO2.
Data & Maps | Agriculture
In agricultural ecosystems, drought may affect the growth rate and development of crop production. Without irrigation, drought-induced crop losses may be extensive, resulting in significant economic losses.
Data & Maps | Fire
Drought stress on vegetation can include damage to forests and soils, which in turn may increase wildfire frequency, severity, and spatial extent. View datasets and maps on current and predicted outlooks for fire risk, potential, and occurrence.
Research & Learn | Ecological Drought
Ecological drought refers to extreme drought impacts that exceed the capacity of both human and natural systems to adapt. Thus, ecological drought could drive irreversible changes in vegetation ecosystems—for example, from forest to shrubs—thereby changing the ecosystem benefits and services once provided by forests.
Vegetation Research and Resources
Web Resources
Remote Sensing Phenology
U.S. Geological Survey
ECOSTRESS
NASA Jet Propulsion Laboratory
Monitoring Vegetation Drought Stress
U.S. Geological Survey
Effects of Drought on Forests and Rangelands
U.S. Department of Agriculture
How Drought Affects Your Forest
American Forest Foundation