NOAA STAR Global Vegetation Health Products
NOAA National Environmental Satellite, Data, and Information Service (NESDIS) Center for Satellite Applications and Research (STAR)
Measurements from energy-detecting instruments on satellites provide a way to monitor vegetation health, drought, soil saturation, moisture and thermal conditions, fire risk, greenness of vegetation cover, vegetation fraction, leaf area index, start/end of the growing season, and crop and pasture productivity.
Where do these data come from?
Data and images are derived from the radiance (type and amount of energy) observed by the VIIRS instrument onboard the Soumi-NPP satellite. VIIRS stands for Visible Infrared Imaging Radiometer Suite: the instrument is on the Soumi-NPP satellite.
How to
What can I do with these data?
- Compare various datasets to explore recent and current growing conditions across 245 countries or regions around the world.
- See how and where vegetation health has improved or declined over the last week
- Look for areas of increased drought risk
- Identify areas with an enhanced risk of malaria
How do I use the site?
- Click drop-down menus to select data type, area of interest, and time period.
- Check or uncheck the mask by desert and snow boxes to improve the display.
- Check the legend below each map, and read the information directly below the legend to interpret the image.
Access
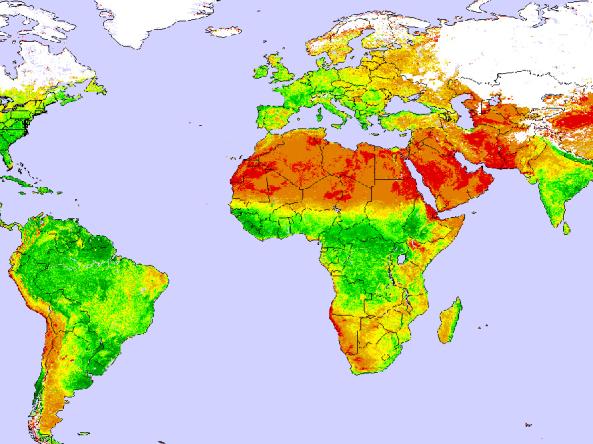
Global Vegetation Health Images: View Global vegetation images. Use the drop-down menus to view different vegetation products or to view past maps.
Global Vegetation Health Timeseries: Weekly averages of vegetation health products are available for different countries and states from 1982 to present, including separate graphs for crop land areas. These data are also available as text file downloads.
Drought Timeseries by Areas: The weekly percentage of drought area for different countries and states are calculated from 1982 to present, including separate graphs for crop land areas. These data are also available as text file downloads.
Documentation