Advancing Drought Science and Preparedness Across the Nation
The National Integrated Drought Information System (NIDIS) is a multi-agency partnership that coordinates drought monitoring, forecasting, planning, and information at national, tribal, state, and local levels.
The U.S. Drought Monitor depicts the location and intensity of drought across the country using 5 classifications: Abnormally Dry (D0), showing areas that may be going into or are coming out of drought, and four levels of drought (D1–D4).
The U.S. Drought Monitor is a joint effort of the National Drought Mitigation Center, U.S. Department of Agriculture, National Oceanic and Atmospheric Administration, and National Aeronautics and Space Administration.
This map shows precipitation for the past 30 days as a percentage of the historical average (1991–2020) for the same time period. Green/blue shades indicate above-normal precipitation, while brown shades indicate below-normal precipitation.
This map shows the average maximum daily temperature for the past 30 days compared to the historical average (1991–2020) for the same 30 days. Negative values (blue hues) indicate colder than normal temperatures, and positive values (red hues) indicate warmer than normal temperatures.
A drought index combines multiple drought indicators (e.g., precipitation, temperature, soil moisture) to depict drought conditions. For some products, like the U.S. Drought Monitor, authors combine their analysis of drought indicators with input from local observers. Other drought indices, like the Standardized Precipitation Index (SPI), use an objective calculation to describe the severity, location, timing, and/or duration of drought.
Learn MorePeriods of drought can lead to inadequate water supply, threatening the health, safety, and welfare of communities. Streamflow, groundwater, reservoir, and snowpack data are key to monitoring and forecasting water supply.
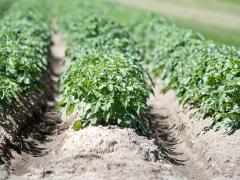
Learn MoreDrought can reduce the water availability and water quality necessary for productive farms, ranches, and grazing lands, resulting in significant negative direct and indirect economic impacts to the agricultural sector. Monitoring agricultural drought typically focuses on examining levels of precipitation, evaporative demand, soil moisture, and surface/groundwater quantity and quality.
Learn MoreDrought is defined as the lack of precipitation over an extended period of time, usually for a season or more, that results in a water shortage. Changes in precipitation can substantially disrupt crops and livestock, influence the frequency and intensity of severe weather events, and affect the quality and quantity of water available for municipal and industrial use.
Learn MorePeriods of drought can lead to inadequate water supply, threatening the health, safety, and welfare of communities. Streamflow, groundwater, reservoir, and snowpack data are key to monitoring and forecasting water supply.
Learn MoreDrought can reduce the water availability and water quality necessary for productive farms, ranches, and grazing lands, resulting in significant negative direct and indirect economic impacts to the agricultural sector. Monitoring agricultural drought typically focuses on examining levels of precipitation, evaporative demand, soil moisture, and surface/groundwater quantity and quality.
Learn MoreAir temperature can have wide-ranging effects on natural processes. Warmer air temperatures increase evapotranspiration—which is the combination of evaporation from the soil and bodies of water and transpiration from plants—and lower soil moisture.
Learn MoreDrought can reduce the water availability and water quality necessary for productive farms, ranches, and grazing lands, resulting in significant negative direct and indirect economic impacts to the agricultural sector. Monitoring agricultural drought typically focuses on examining levels of precipitation, evaporative demand, soil moisture, and surface/groundwater quantity and quality.
Learn MoreU.S. Drought Monitor Category
% of U.S.Abnormally Dry
Abnormally Dry (D0) indicates a region that is going into or coming out of drought.
Moderate Drought
Moderate Drought (D1) is the first of four drought categories (D1–D4), according to the U.S. Drought Monitor.
Severe Drought
Severe Drought (D2) is the second of four drought categories (D1–D4), according to the U.S. Drought Monitor.
Extreme Drought
Extreme Drought (D3) is the third of four drought categories (D1–D4), according to the U.S. Drought Monitor.
Exceptional Drought
Exceptional Drought (D4) is the most intense drought category, according to the U.S. Drought Monitor.
Total Area in Drought (D1–D4)
Percent area of the 50 U.S. states and Puerto Rico that is currently in drought (D1–D4), according to the U.S. Drought Monitor.
Precipitation Shown as a Percentage of Normal Conditions
<25% of Normal
Precipitation was only 0% to 25% of the historical average for this location, compared to the same date range from 1991–2020.
25%–50% of Normal
Precipitation was 25% to 50% of the historical average for this location, compared to the same date range from 1991–2020.
50%–75% of Normal
Precipitation was 50% to 75% of the historical average for this location, compared to the same date range from 1991–2020.
75%–100% of Normal
Precipitation was 75% to 100% of the historical average for this location, compared to the same date range from 1991–2020.
100%–150% of Normal
Precipitation was 100% to 150% of the historical average for this location, compared to the same date range from 1991–2020.
150%–200% of Normal
Precipitation was 150% to 200% of the historical average for this location, compared to the same date range from 1991–2020.
200%–300% of Normal
Precipitation was 200% to 300% of the historical average for this location, compared to the same date range from 1991–2020.
>300% of Normal
Precipitation was greater than 300% of the historical average for this location, compared to the same date range from 1991–2020.
Departure from Normal Max Temperature (°F)
>8°F Below Normal
The average maximum temperature was more than 8°F colder than normal for this location.
6–8°F Below Normal
The average maximum temperature was 6–8°F colder than normal for this location.
4–6°F Below Normal
The average maximum temperature was 4–6°F colder than normal for this location.
3–4°F Below Normal
The average maximum temperature was 3–4°F colder than normal for this location.
1–3°F Below Normal
The average maximum temperature was 1–3°F colder than normal for this location.
0–1°F Below Normal
The average maximum temperature was 0–1°F colder than normal for this location.
0–1°F Above Normal
The average maximum temperature was 0–1°F warmer than normal for this location.
1–3°F Above Normal
The average maximum temperature was 1–3°F warmer than normal for this location.
3–4°F Above Normal
The average maximum temperature was 3–4°F warmer than normal for this location.
4–6°F Above Normal
The average maximum temperature was 4–6°F warmer than normal for this location.
6–8°F Above Normal
The average maximum temperature was 6–8°F warmer than normal for this location.
>8°F Above Normal
The average maximum temperature was more than 8°F warmer than normal for this location.
The U.S. Drought Monitor depicts the location and intensity of drought across the country using 5 classifications: Abnormally Dry (D0), showing areas that may be going into or are coming out of drought, and four levels of drought (D1–D4).
The U.S. Drought Monitor is a joint effort of the National Drought Mitigation Center, U.S. Department of Agriculture, National Oceanic and Atmospheric Administration, and National Aeronautics and Space Administration.
This map shows precipitation for the past 30 days as a percentage of the historical average (1991–2020) for the same time period. Green/blue shades indicate above-normal precipitation, while brown shades indicate below-normal precipitation.
This map shows the average maximum daily temperature for the past 30 days compared to the historical average (1991–2020) for the same 30 days. Negative values (blue hues) indicate colder than normal temperatures, and positive values (red hues) indicate warmer than normal temperatures.
The U.S. Drought Monitor map is released every Thursday morning, with data valid through Tuesday at 7 am Eastern.
Precipitation data are updated daily, with a delay of 3 to 4 days to allow for data collection and quality control.
Temperature data are updated daily, with a delay of 3 to 4 days to allow for data collection and quality control.
A drought index combines multiple drought indicators (e.g., precipitation, temperature, soil moisture) to depict drought conditions. For some products, like the U.S. Drought Monitor, authors combine their analysis of drought indicators with input from local observers. Other drought indices, like the Standardized Precipitation Index (SPI), use an objective calculation to describe the severity, location, timing, and/or duration of drought.
Learn MorePeriods of drought can lead to inadequate water supply, threatening the health, safety, and welfare of communities. Streamflow, groundwater, reservoir, and snowpack data are key to monitoring and forecasting water supply.
Learn MoreDrought can reduce the water availability and water quality necessary for productive farms, ranches, and grazing lands, resulting in significant negative direct and indirect economic impacts to the agricultural sector. Monitoring agricultural drought typically focuses on examining levels of precipitation, evaporative demand, soil moisture, and surface/groundwater quantity and quality.
Learn MoreDrought is defined as the lack of precipitation over an extended period of time, usually for a season or more, that results in a water shortage. Changes in precipitation can substantially disrupt crops and livestock, influence the frequency and intensity of severe weather events, and affect the quality and quantity of water available for municipal and industrial use.
Learn MorePeriods of drought can lead to inadequate water supply, threatening the health, safety, and welfare of communities. Streamflow, groundwater, reservoir, and snowpack data are key to monitoring and forecasting water supply.
Learn MoreDrought can reduce the water availability and water quality necessary for productive farms, ranches, and grazing lands, resulting in significant negative direct and indirect economic impacts to the agricultural sector. Monitoring agricultural drought typically focuses on examining levels of precipitation, evaporative demand, soil moisture, and surface/groundwater quantity and quality.
Learn MoreAir temperature can have wide-ranging effects on natural processes. Warmer air temperatures increase evapotranspiration—which is the combination of evaporation from the soil and bodies of water and transpiration from plants—and lower soil moisture.
Learn MoreDrought can reduce the water availability and water quality necessary for productive farms, ranches, and grazing lands, resulting in significant negative direct and indirect economic impacts to the agricultural sector. Monitoring agricultural drought typically focuses on examining levels of precipitation, evaporative demand, soil moisture, and surface/groundwater quantity and quality.
Learn More