Gridded Surface Meteorological (gridMET) Dataset
University of California, Merced
The Gridded Surface Meteorological (gridMET) dataset is a "dataset of daily high-spatial resolution (~4-km, 1/24th degree) surface meteorological data covering the contiguous U.S. from 1979-yesterday. We have also extended these data to cover southern British Columbia in our real time products. These data can provide important inputs for ecological, agricultural, and hydrological models. These data are updated daily.
gridMET blends spatial attributes of gridded climate data from PRISM with desirable temporal attributes (and additional variables) from regional reanalysis (NLDAS-2) using climatically aided interpolation. The resulting product is a spatially and temporally complete, high-resolution (1/24th degree ~4-km) gridded dataset of surface meteorological variables."
This map shows total precipitation (in inches) for the past 7 days. Dark blue shades indicate the highest precipitation amounts.
This map shows precipitation for the past 30 days as a percentage of the historical average (1991–2020) for the same time period. Green/blue shades indicate above-normal precipitation, while brown shades indicate below-normal precipitation.
This map shows precipitation for the past 60 days as a percentage of the historical average (1991–2020) for the same time period. Green/blue shades indicate above-normal precipitation, while brown shades indicate below-normal precipitation.
Drought is defined as the lack of precipitation over an extended period of time, usually for a season or more, that results in a water shortage. Changes in precipitation can substantially disrupt crops and livestock, influence the frequency and intensity of severe weather events, and affect the quality and quantity of water available for municipal and industrial use.
Learn MorePeriods of drought can lead to inadequate water supply, threatening the health, safety, and welfare of communities. Streamflow, groundwater, reservoir, and snowpack data are key to monitoring and forecasting water supply.
Learn MoreDrought can reduce the water availability and water quality necessary for productive farms, ranches, and grazing lands, resulting in significant negative direct and indirect economic impacts to the agricultural sector. Monitoring agricultural drought typically focuses on examining levels of precipitation, evaporative demand, soil moisture, and surface/groundwater quantity and quality.
Learn MoreDrought is defined as the lack of precipitation over an extended period of time, usually for a season or more, that results in a water shortage. Changes in precipitation can substantially disrupt crops and livestock, influence the frequency and intensity of severe weather events, and affect the quality and quantity of water available for municipal and industrial use.
Learn MorePeriods of drought can lead to inadequate water supply, threatening the health, safety, and welfare of communities. Streamflow, groundwater, reservoir, and snowpack data are key to monitoring and forecasting water supply.
Learn MoreDrought can reduce the water availability and water quality necessary for productive farms, ranches, and grazing lands, resulting in significant negative direct and indirect economic impacts to the agricultural sector. Monitoring agricultural drought typically focuses on examining levels of precipitation, evaporative demand, soil moisture, and surface/groundwater quantity and quality.
Learn MoreInches of Precipitation
This location received less than 0.01 inch of precipitation during this 7-day period.
This location received 0.01–0.5 inch of precipitation during this 7-day period.
This location received 0.5–1 inch of precipitation during this 7-day period.
This location received 1–2 inches of precipitation during this 7-day period.
This location received 2–4 inches of precipitation during this 7-day period.
This location received 4–6 inches of precipitation during this 7-day period.
This location received 6–8 inches of precipitation during this 7-day period.
This location received more than 8 inches of precipitation during this 7-day period.
Precipitation Shown as a Percentage of Normal Conditions
<25% of Normal
Precipitation was only 0% to 25% of the historical average for this location, compared to the same date range from 1991–2020.
25%–50% of Normal
Precipitation was 25% to 50% of the historical average for this location, compared to the same date range from 1991–2020.
50%–75% of Normal
Precipitation was 50% to 75% of the historical average for this location, compared to the same date range from 1991–2020.
75%–100% of Normal
Precipitation was 75% to 100% of the historical average for this location, compared to the same date range from 1991–2020.
100%–150% of Normal
Precipitation was 100% to 150% of the historical average for this location, compared to the same date range from 1991–2020.
150%–200% of Normal
Precipitation was 150% to 200% of the historical average for this location, compared to the same date range from 1991–2020.
200%–300% of Normal
Precipitation was 200% to 300% of the historical average for this location, compared to the same date range from 1991–2020.
>300% of Normal
Precipitation was greater than 300% of the historical average for this location, compared to the same date range from 1991–2020.
This map shows total precipitation (in inches) for the past 7 days. Dark blue shades indicate the highest precipitation amounts.
This map shows precipitation for the past 30 days as a percentage of the historical average (1991–2020) for the same time period. Green/blue shades indicate above-normal precipitation, while brown shades indicate below-normal precipitation.
This map shows precipitation for the past 60 days as a percentage of the historical average (1991–2020) for the same time period. Green/blue shades indicate above-normal precipitation, while brown shades indicate below-normal precipitation.
Precipitation data are updated daily, with a delay of 3 to 4 days to allow for data collection and quality control.
Precipitation data are updated daily, with a delay of 3 to 4 days to allow for data collection and quality control.
Precipitation data are updated daily, with a delay of 3 to 4 days to allow for data collection and quality control.
Drought is defined as the lack of precipitation over an extended period of time, usually for a season or more, that results in a water shortage. Changes in precipitation can substantially disrupt crops and livestock, influence the frequency and intensity of severe weather events, and affect the quality and quantity of water available for municipal and industrial use.
Learn MorePeriods of drought can lead to inadequate water supply, threatening the health, safety, and welfare of communities. Streamflow, groundwater, reservoir, and snowpack data are key to monitoring and forecasting water supply.
Learn MoreDrought can reduce the water availability and water quality necessary for productive farms, ranches, and grazing lands, resulting in significant negative direct and indirect economic impacts to the agricultural sector. Monitoring agricultural drought typically focuses on examining levels of precipitation, evaporative demand, soil moisture, and surface/groundwater quantity and quality.
Learn MoreDrought is defined as the lack of precipitation over an extended period of time, usually for a season or more, that results in a water shortage. Changes in precipitation can substantially disrupt crops and livestock, influence the frequency and intensity of severe weather events, and affect the quality and quantity of water available for municipal and industrial use.
Learn MorePeriods of drought can lead to inadequate water supply, threatening the health, safety, and welfare of communities. Streamflow, groundwater, reservoir, and snowpack data are key to monitoring and forecasting water supply.
Learn MoreDrought can reduce the water availability and water quality necessary for productive farms, ranches, and grazing lands, resulting in significant negative direct and indirect economic impacts to the agricultural sector. Monitoring agricultural drought typically focuses on examining levels of precipitation, evaporative demand, soil moisture, and surface/groundwater quantity and quality.
Learn MoreDrought is defined as the lack of precipitation over an extended period of time, usually for a season or more, that results in a water shortage. Changes in precipitation can substantially disrupt crops and livestock, influence the frequency and intensity of severe weather events, and affect the quality and quantity of water available for municipal and industrial use.
Learn MorePeriods of drought can lead to inadequate water supply, threatening the health, safety, and welfare of communities. Streamflow, groundwater, reservoir, and snowpack data are key to monitoring and forecasting water supply.
Learn MoreDrought can reduce the water availability and water quality necessary for productive farms, ranches, and grazing lands, resulting in significant negative direct and indirect economic impacts to the agricultural sector. Monitoring agricultural drought typically focuses on examining levels of precipitation, evaporative demand, soil moisture, and surface/groundwater quantity and quality.
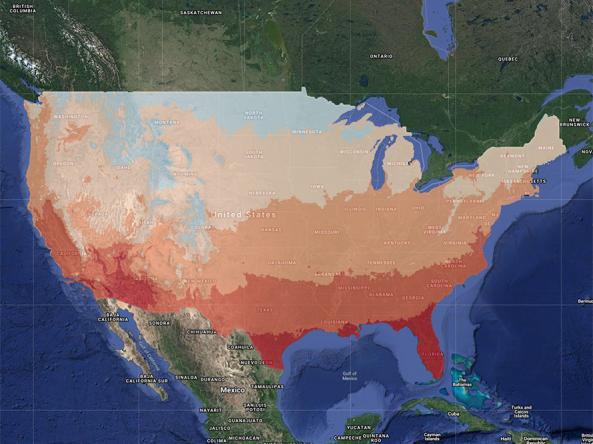
Learn MoreThis map shows the average maximum daily temperature (°F) for the last 7 days. Blue hues indicate cooler temperatures, while red hues indicate warmer temperatures.
This map shows the average maximum daily temperature for the past 7 days compared to the historical average (1991–2020) for the same 7 days. Negative values (blue hues) indicate colder than normal temperatures, and positive values (red hues) indicate warmer than normal temperatures.
This map shows the average maximum daily temperature for the past 30 days compared to the historical average (1991–2020) for the same 30 days. Negative values (blue hues) indicate colder than normal temperatures, and positive values (red hues) indicate warmer than normal temperatures.
This map shows the average maximum daily temperature for the past 60 days compared to the historical average (1991–2020) for the same 60 days. Negative values (blue hues) indicate colder than normal temperatures, and positive values (red hues) indicate warmer than normal temperatures.
Air temperature can have wide-ranging effects on natural processes. Warmer air temperatures increase evapotranspiration—which is the combination of evaporation from the soil and bodies of water and transpiration from plants—and lower soil moisture.
Learn MoreDrought can reduce the water availability and water quality necessary for productive farms, ranches, and grazing lands, resulting in significant negative direct and indirect economic impacts to the agricultural sector. Monitoring agricultural drought typically focuses on examining levels of precipitation, evaporative demand, soil moisture, and surface/groundwater quantity and quality.
Learn MoreAir temperature can have wide-ranging effects on natural processes. Warmer air temperatures increase evapotranspiration—which is the combination of evaporation from the soil and bodies of water and transpiration from plants—and lower soil moisture.
Learn MoreDrought can reduce the water availability and water quality necessary for productive farms, ranches, and grazing lands, resulting in significant negative direct and indirect economic impacts to the agricultural sector. Monitoring agricultural drought typically focuses on examining levels of precipitation, evaporative demand, soil moisture, and surface/groundwater quantity and quality.
Learn MoreMaximum Temperature (°F)
<0°F
The 7-day average daily maximum temperature is below 0°F.
0–10°F
The 7-day average daily maximum temperature is between 0–10°F.
10–20°F
The 7-day average daily maximum temperature is between 10–20°F.
20–30°F
The 7-day average daily maximum temperature is between 20–30°F.
30–40°F
The 7-day average daily maximum temperature is between 30–40°F.
40–60°F
The 7-day average daily maximum temperature is between 40–60°F.
60–70°F
The 7-day average daily maximum temperature is between 60–70°F.
70–80°F
The 7-day average daily maximum temperature is between 70–80°F.
80–90°F
The 7-day average daily maximum temperature is between 80–90°F.
90–100°F
The 7-day average daily maximum temperature is between 90–100°F.
>100°F
The 7-day average daily maximum temperature is between greater than 100°F.
Departure from Normal Max Temperature (°F)
>8°F Below Normal
The average maximum temperature was more than 8°F colder than normal for this location.
6–8°F Below Normal
The average maximum temperature was 6–8°F colder than normal for this location.
4–6°F Below Normal
The average maximum temperature was 4–6°F colder than normal for this location.
3–4°F Below Normal
The average maximum temperature was 3–4°F colder than normal for this location.
1–3°F Below Normal
The average maximum temperature was 1–3°F colder than normal for this location.
0–1°F Below Normal
The average maximum temperature was 0–1°F colder than normal for this location.
0–1°F Above Normal
The average maximum temperature was 0–1°F warmer than normal for this location.
1–3°F Above Normal
The average maximum temperature was 1–3°F warmer than normal for this location.
3–4°F Above Normal
The average maximum temperature was 3–4°F warmer than normal for this location.
4–6°F Above Normal
The average maximum temperature was 4–6°F warmer than normal for this location.
6–8°F Above Normal
The average maximum temperature was 6–8°F warmer than normal for this location.
>8°F Above Normal
The average maximum temperature was more than 8°F warmer than normal for this location.
This map shows the average maximum daily temperature (°F) for the last 7 days. Blue hues indicate cooler temperatures, while red hues indicate warmer temperatures.
This map shows the average maximum daily temperature for the past 7 days compared to the historical average (1991–2020) for the same 7 days. Negative values (blue hues) indicate colder than normal temperatures, and positive values (red hues) indicate warmer than normal temperatures.
This map shows the average maximum daily temperature for the past 30 days compared to the historical average (1991–2020) for the same 30 days. Negative values (blue hues) indicate colder than normal temperatures, and positive values (red hues) indicate warmer than normal temperatures.
This map shows the average maximum daily temperature for the past 60 days compared to the historical average (1991–2020) for the same 60 days. Negative values (blue hues) indicate colder than normal temperatures, and positive values (red hues) indicate warmer than normal temperatures.
Temperature data are updated daily, with a delay of 3 to 4 days to allow for data collection and quality control.
Temperature data are updated daily, with a delay of 3 to 4 days to allow for data collection and quality control.
Temperature data are updated daily, with a delay of 3 to 4 days to allow for data collection and quality control.
Temperature data are updated daily, with a delay of 3 to 4 days to allow for data collection and quality control.
Air temperature can have wide-ranging effects on natural processes. Warmer air temperatures increase evapotranspiration—which is the combination of evaporation from the soil and bodies of water and transpiration from plants—and lower soil moisture.
Learn MoreDrought can reduce the water availability and water quality necessary for productive farms, ranches, and grazing lands, resulting in significant negative direct and indirect economic impacts to the agricultural sector. Monitoring agricultural drought typically focuses on examining levels of precipitation, evaporative demand, soil moisture, and surface/groundwater quantity and quality.
Learn MoreAir temperature can have wide-ranging effects on natural processes. Warmer air temperatures increase evapotranspiration—which is the combination of evaporation from the soil and bodies of water and transpiration from plants—and lower soil moisture.
Learn MoreDrought can reduce the water availability and water quality necessary for productive farms, ranches, and grazing lands, resulting in significant negative direct and indirect economic impacts to the agricultural sector. Monitoring agricultural drought typically focuses on examining levels of precipitation, evaporative demand, soil moisture, and surface/groundwater quantity and quality.
Learn MoreAir temperature can have wide-ranging effects on natural processes. Warmer air temperatures increase evapotranspiration—which is the combination of evaporation from the soil and bodies of water and transpiration from plants—and lower soil moisture.
Learn MoreDrought can reduce the water availability and water quality necessary for productive farms, ranches, and grazing lands, resulting in significant negative direct and indirect economic impacts to the agricultural sector. Monitoring agricultural drought typically focuses on examining levels of precipitation, evaporative demand, soil moisture, and surface/groundwater quantity and quality.
Learn MoreAir temperature can have wide-ranging effects on natural processes. Warmer air temperatures increase evapotranspiration—which is the combination of evaporation from the soil and bodies of water and transpiration from plants—and lower soil moisture.
Learn MoreDrought can reduce the water availability and water quality necessary for productive farms, ranches, and grazing lands, resulting in significant negative direct and indirect economic impacts to the agricultural sector. Monitoring agricultural drought typically focuses on examining levels of precipitation, evaporative demand, soil moisture, and surface/groundwater quantity and quality.
Learn MoreAccess
GridMET Website: Download gridMET current and historical data and documentation
Climate Engine: Access gridMET datasets and create derived products using Climate Engine
Google Earth Engine Catalog: gridMET dataset catalogue entry for Google Earth Engine
Derived drought indices
The Drought.gov team uses the Climate Engine tool to produce several derived products and indices to monitor current drought conditions.
Precipitation, Percent of Normal Precipitation , SPI, SPEI, EDDI
Documentation
Abatzoglou, J. T. (2013), Development of gridded surface meteorological data for ecological applications and modelling. Int. J. Climatol., 33: 121–131.