Despite Short-Term Improvement for the Southern Plains, Drought Likely to Persist This Summer
Key Points
- Exceptional Drought (D4) persists along the Rio Grande and the Texas Hill Country.
- Northern Texas and central Oklahoma saw a 3-class drought improvement since April 15, according to the U.S. Drought Monitor.
- April was the third wettest April on record for Oklahoma, according to the NOAA National Centers for Environmental Information.
- Seasonal outlooks favor drought persistence and expansion, and high summer temperatures may mean recent improvements are short-lived
This update is based on data available as of Thursday, May 22, 2025 at 9 a.m. CT. We acknowledge that conditions are evolving.
This U.S. Drought Monitor change map shows where drought has improved, remained the same, or worsened in the Southern Plains from April 15–May 20, 2025. Yellow/orange hues show areas where drought worsened, while green hues show drought improvement.
April was exceptionally wet across Oklahoma and northern Texas. A series of storms, especially a deluge with flash flooding from April 29–May 2, 2025, made a big dent in lingering drought conditions. Within that week, most of Oklahoma east of the Panhandle measured over 4 inches of rainfall. The U.S. Drought Monitor showed a 3-category improvement for northern Texas and central Oklahoma from April 15–May 20, 2025.
Drought Degradation
5-Category Degradation
Drought/dryness has worsened by 5 categories, according to the U.S. Drought Monitor.
4-Category Degradation
Drought/dryness has worsened by 4 categories, according to the U.S. Drought Monitor.
3-Category Degradation
Drought/dryness has worsened by 3 categories, according to the U.S. Drought Monitor.
2-Category Degradation
Drought/dryness has worsened by 2 categories, according to the U.S. Drought Monitor.
1-Category Degradation
Drought/dryness has worsened by 1 category, according to the U.S. Drought Monitor.
Drought Improvement
1-Category Improvement
Drought/dryness has improved by 1 category, according to the U.S. Drought Monitor.
2-Category Improvement
Drought/dryness has improved by 2 categories, according to the U.S. Drought Monitor.
3-Category Improvement
Drought/dryness has improved by 3 categories, according to the U.S. Drought Monitor.
4-Category Improvement
Drought/dryness has improved by 4 categories, according to the U.S. Drought Monitor.
5-Category Improvement
Drought/dryness has improved by 5 categories, according to the U.S. Drought Monitor.
This U.S. Drought Monitor change map shows where drought has improved, remained the same, or worsened in the Southern Plains from April 15–May 20, 2025. Yellow/orange hues show areas where drought worsened, while green hues show drought improvement.
April was exceptionally wet across Oklahoma and northern Texas. A series of storms, especially a deluge with flash flooding from April 29–May 2, 2025, made a big dent in lingering drought conditions. Within that week, most of Oklahoma east of the Panhandle measured over 4 inches of rainfall. The U.S. Drought Monitor showed a 3-category improvement for northern Texas and central Oklahoma from April 15–May 20, 2025.
The U.S. Drought Monitor (UDSM) and USDM change maps are updated weekly on Thursdays, with data valid through the previous Tuesday at 7 a.m. ET.
Current Conditions and Impacts for the Southern Plains
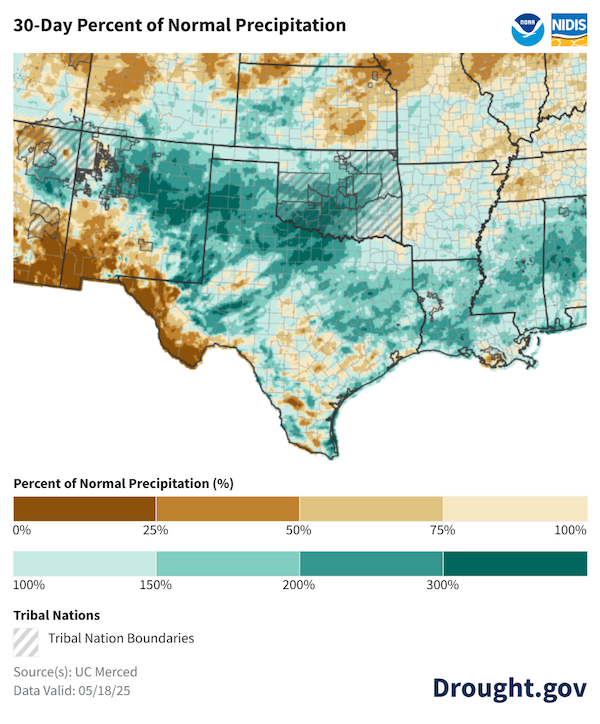
- Spring is typically wet in the High Plains, and this spring has been wetter than normal, with parts of Texas and Oklahoma exceeding 200% of normal precipitation.
- Exceptional Drought (D4) expanded to a larger area over the Texas Hill Country and the Big Bend region, according to the U.S. Drought Monitor.
- Parts of the Texas Hill Country have been in Severe to Exceptional Drought (D2-D4) since January 2022.
- The U.S. cow herd remained the smallest since 1961. Multiple years of drought in Texas, which accounts for more than 14% of beef cattle nationally, factored into that decline.
- The Texas AgriLife rangeland report from May 6, 2025 shows mixed conditions across the state, but most farmers seem optimistic following recent precipitation. North Texas grasslands are recovering from wildfires a year ago.
- Drought continues to impact the Wichita, Kansas water supply:
- Wichita is in Stage 2 drought status due to very low water levels at Cheney Reservoir. Stage 2 includes scheduling select days when people can water their lawn.
- The Kansas Governor expanded drought warning declarations to include 39 counties in addition to the 3 counties with a declared drought emergency.
- Releases from Cedar Bluff Reservoir were required to sustain water supplies for cities such as Hays and Russell, Kansas. More runoff events are needed across the state to sustain water flows.
- In Texas, Barton Springs and Edwards Aquifer are in Stage III Drought.
- Continued drought in the Rio Grande valley renewed scrutiny regarding water resources and Rio Grande treaty agreements.
The Southern Plains Saw Above-Normal Precipitation Over the Past 30 Days
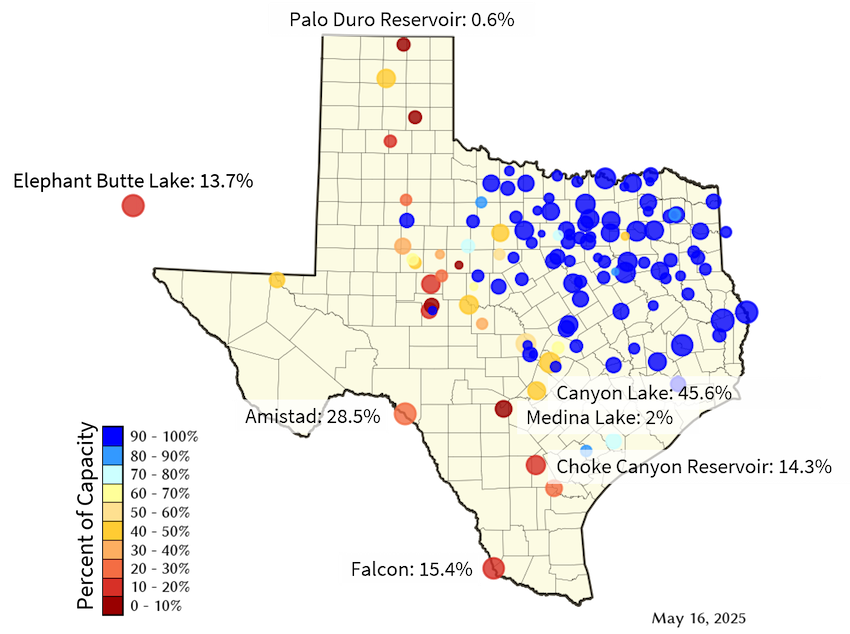
Multi-Year Drought Causes Low Reservoir Levels, Water Restrictions in Southwest Texas
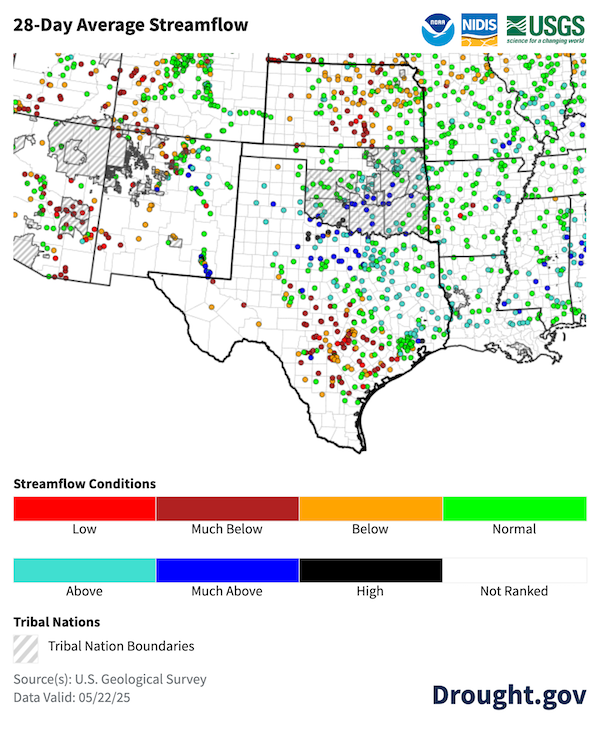
Streamflow Improved Over the Last Month, But Problems Persist in Central Texas and Central Kansas
Outlooks and Potential Impacts in the Southern Plains
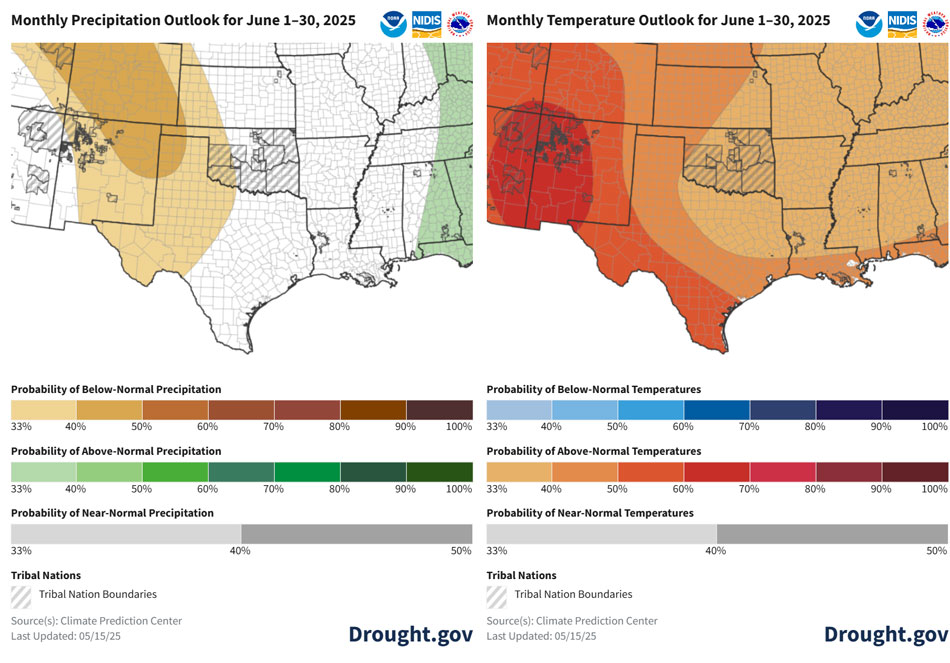
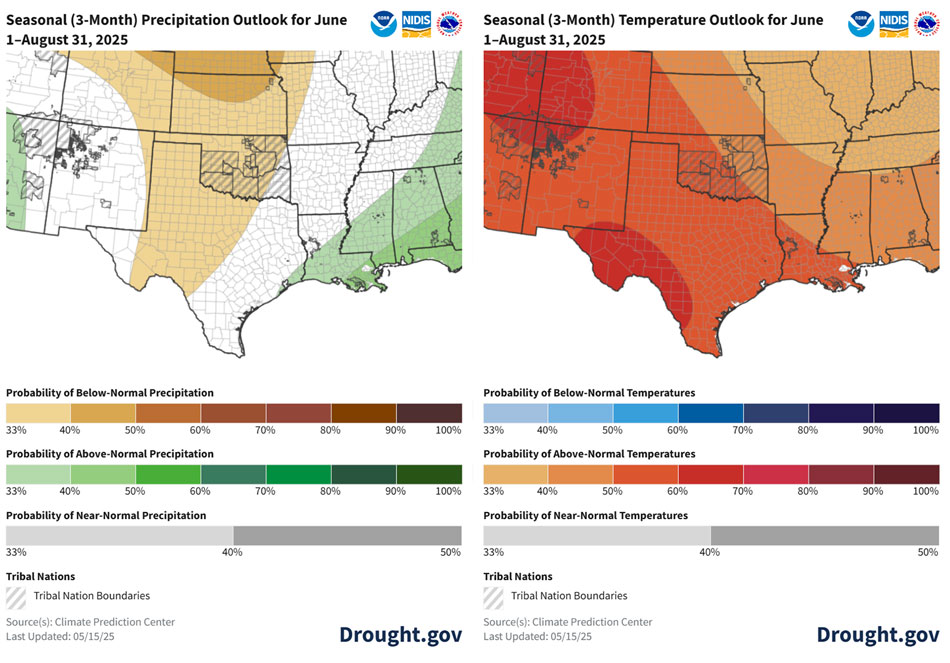
- The Climate Prediction Center’s temperature outlooks show a high likelihood of above-normal temperatures at monthly and seasonal (June–August) scales. Above-average temperatures are forecast through summer.
- Precipitation outlooks show either an equal chance of above-, near-, or below-normal precipitation, or weak odds slightly favoring below-normal precipitation for the month and season ahead.
- Hydrologic drought in central Texas will probably need more than one good season to recover low surface and groundwater storage.
- The El Niño–Southern Oscillation (ENSO) is currently neutral. ENSO-neutral will continue through summer and possibly persist through spring 2026.
- ENSO-neutral means neither El Niño nor La Niña is driving current weather patterns for the Southern Plains, and we lean more heavily on other climate patterns when making seasonal forecasts.
- Forecast models show ENSO-neutral will persist through summer, and is the most likely scenario through winter 2026.
- The Pacific Decadal Oscillation (PDO) has been trending upward, but is still below -1.
- A negative PDO has similar impacts on Southern Plains weather patterns as La Niña. When the two occur together, they amplify each other’s impacts. In the summer months, a negative PDO can shift rainfall eastward and push summer temperatures higher in the Southern Plains.
- The PDO has been negative since January 2020 and reached a new minimum of -3.8 in October 2024, the lowest value in modern history.
Summer Will Likely to Be Another Warm One for Southern Texas
Resources
- Register for the Summer 2025 Drought and Fire Outlook Webinar for the Great Plains on Thursday, June 5, 2025, 12 p.m. CT will address conditions across the Plains from Texas to North Dakota.
- Southern Regional Climate Center
- USDA Southern Plains Climate Hub
- South-Central Climate Adaptation Science Center
- More local information is available from the following resources:
- To report or view local drought impact information:
Prepared By
Joel Lisonbee
Cooperative Institute for Research in Environmental Sciences/University of Colorado, Boulder and NOAA’s National Integrated Drought Information System, Southern Plains Drought Early Warning System
B.J. Baule and John Nielsen-Gammon
Texas State Climate Office, Southern Regional Climate Center, Texas A&M University
Gary McManus
Oklahoma Climatological Survey, State Climatologist
Chip Redmond and Matt Sittel
Kansas Climate Office, Kansas State University
This Drought Status Update is issued in partnership between the National Oceanic and Atmospheric Administration (NOAA) and and partners across the Southern Plains Drought Early Warning System to communicate a potential area of concern for drought expansion and/or development within the Southern Plains region based on recent conditions and the upcoming forecast. NIDIS and its partners will issue future Drought Status Updates as conditions evolve.


