U.S. Drought Monitor Change Map
National Drought Mitigation Center (NDMC), National Oceanic and Atmospheric Administration (NOAA), U.S. Department of Agriculture (USDA)
The U.S. Drought Monitor (USDM) is a map that is updated each Thursday to show the location and intensity of drought across the country using a five-category system, from Abnormally Dry (D0) conditions to Exceptional Drought (D4)..
Along with these weekly maps, the USDM provides weekly Drought Change Map that displays changes in drought class degradation and drought class improvements across the United States. The USDM offers Drought Change Maps at weekly, monthly, and annual timescales.
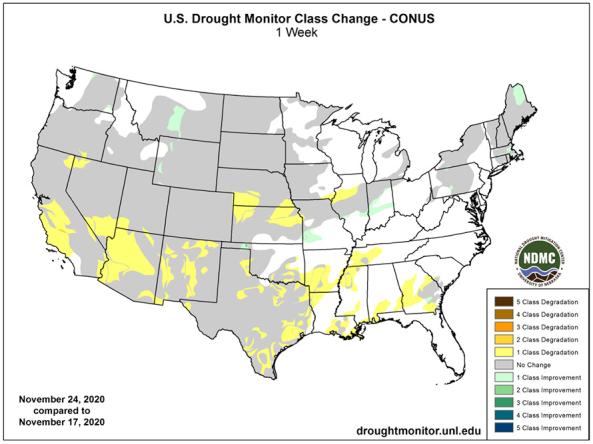
The U.S. Drought Monitor 1-week change map shows where drought has improved, remained the same, or worsened since the previous week's Drought Monitor. Yellow/orange hues show areas where drought worsened, while green hues show drought improvement.
The U.S. Drought Monitor 4-week change map shows where drought has improved, remained the same, or worsened since the previous month's U.S. Drought Monitor.
The U.S. Drought Monitor depicts the location and intensity of drought across the country, using 5 classifications (D0–D4). Green hues show where conditions improved, yellow/orange hues show where conditions worsened, and gray areas show where drought remained the same.
A drought index combines multiple drought indicators (e.g., precipitation, temperature, soil moisture) to depict drought conditions. For some products, like the U.S. Drought Monitor, authors combine their analysis of drought indicators with input from local observers. Other drought indices, like the Standardized Precipitation Index (SPI), use an objective calculation to describe the severity, location, timing, and/or duration of drought.
Learn MorePeriods of drought can lead to inadequate water supply, threatening the health, safety, and welfare of communities. Streamflow, groundwater, reservoir, and snowpack data are key to monitoring and forecasting water supply.
Learn MoreDrought can reduce the water availability and water quality necessary for productive farms, ranches, and grazing lands, resulting in significant negative direct and indirect economic impacts to the agricultural sector. Monitoring agricultural drought typically focuses on examining levels of precipitation, evaporative demand, soil moisture, and surface/groundwater quantity and quality.
Learn MoreA drought index combines multiple drought indicators (e.g., precipitation, temperature, soil moisture) to depict drought conditions. For some products, like the U.S. Drought Monitor, authors combine their analysis of drought indicators with input from local observers. Other drought indices, like the Standardized Precipitation Index (SPI), use an objective calculation to describe the severity, location, timing, and/or duration of drought.
Learn MorePeriods of drought can lead to inadequate water supply, threatening the health, safety, and welfare of communities. Streamflow, groundwater, reservoir, and snowpack data are key to monitoring and forecasting water supply.
Learn MoreDrought can reduce the water availability and water quality necessary for productive farms, ranches, and grazing lands, resulting in significant negative direct and indirect economic impacts to the agricultural sector. Monitoring agricultural drought typically focuses on examining levels of precipitation, evaporative demand, soil moisture, and surface/groundwater quantity and quality.
Learn MoreDrought Change Since Last Week
3-Category Degradation
Drought/dryness has worsened by 3 categories, according to the U.S. Drought Monitor.
2-Category Degradation
Drought/dryness has worsened by 2 categories, according to the U.S. Drought Monitor.
1-Category Degradation
Drought/dryness has worsened by 1 category, according to the U.S. Drought Monitor.
No Change
There has been no change in drought conditions at this location.
1-Category Improvement
Drought/dryness has improved by 1 category, according to the U.S. Drought Monitor.
2-Category Improvement
Drought/dryness has improved by 2 categories, according to the U.S. Drought Monitor.
3-Category Improvement
Drought/dryness has improved by 3 categories, according to the U.S. Drought Monitor.
Drought Degradation
5-Category Degradation
Drought/dryness has worsened by 5 categories, according to the U.S. Drought Monitor.
4-Category Degradation
Drought/dryness has worsened by 4 categories, according to the U.S. Drought Monitor.
3-Category Degradation
Drought/dryness has worsened by 3 categories, according to the U.S. Drought Monitor.
2-Category Degradation
Drought/dryness has worsened by 2 categories, according to the U.S. Drought Monitor.
1-Category Degradation
Drought/dryness has worsened by 1 category, according to the U.S. Drought Monitor.
Drought Improvement
1-Category Improvement
Drought/dryness has improved by 1 category, according to the U.S. Drought Monitor.
2-Category Improvement
Drought/dryness has improved by 2 categories, according to the U.S. Drought Monitor.
3-Category Improvement
Drought/dryness has improved by 3 categories, according to the U.S. Drought Monitor.
4-Category Improvement
Drought/dryness has improved by 4 categories, according to the U.S. Drought Monitor.
5-Category Improvement
Drought/dryness has improved by 5 categories, according to the U.S. Drought Monitor.
The U.S. Drought Monitor 1-week change map shows where drought has improved, remained the same, or worsened since the previous week's Drought Monitor. Yellow/orange hues show areas where drought worsened, while green hues show drought improvement.
The U.S. Drought Monitor 4-week change map shows where drought has improved, remained the same, or worsened since the previous month's U.S. Drought Monitor.
The U.S. Drought Monitor depicts the location and intensity of drought across the country, using 5 classifications (D0–D4). Green hues show where conditions improved, yellow/orange hues show where conditions worsened, and gray areas show where drought remained the same.
U.S. Drought Monitor change maps are released every Thursday morning, with data valid through Tuesday at 7 am Eastern.
U.S. Drought Monitor change maps are released every Thursday morning, with data valid through Tuesday at 7 a.m. EST.
A drought index combines multiple drought indicators (e.g., precipitation, temperature, soil moisture) to depict drought conditions. For some products, like the U.S. Drought Monitor, authors combine their analysis of drought indicators with input from local observers. Other drought indices, like the Standardized Precipitation Index (SPI), use an objective calculation to describe the severity, location, timing, and/or duration of drought.
Learn MorePeriods of drought can lead to inadequate water supply, threatening the health, safety, and welfare of communities. Streamflow, groundwater, reservoir, and snowpack data are key to monitoring and forecasting water supply.
Learn MoreDrought can reduce the water availability and water quality necessary for productive farms, ranches, and grazing lands, resulting in significant negative direct and indirect economic impacts to the agricultural sector. Monitoring agricultural drought typically focuses on examining levels of precipitation, evaporative demand, soil moisture, and surface/groundwater quantity and quality.
Learn MoreA drought index combines multiple drought indicators (e.g., precipitation, temperature, soil moisture) to depict drought conditions. For some products, like the U.S. Drought Monitor, authors combine their analysis of drought indicators with input from local observers. Other drought indices, like the Standardized Precipitation Index (SPI), use an objective calculation to describe the severity, location, timing, and/or duration of drought.
Learn MorePeriods of drought can lead to inadequate water supply, threatening the health, safety, and welfare of communities. Streamflow, groundwater, reservoir, and snowpack data are key to monitoring and forecasting water supply.
Learn MoreDrought can reduce the water availability and water quality necessary for productive farms, ranches, and grazing lands, resulting in significant negative direct and indirect economic impacts to the agricultural sector. Monitoring agricultural drought typically focuses on examining levels of precipitation, evaporative demand, soil moisture, and surface/groundwater quantity and quality.
Learn MoreHow to
How to use this site:
- Use the drop down menus to select a date, scale, and time frame to view a series of change maps for a selected week.
- Change maps are available at the follow scales: 1 week, 4 week (1 month), 8 week (2 month), 12 week (3 month), 24 week (4 month), or 52 week (1 year)
Access
US Drought Monitor Change Maps: view and compare drought change maps at the: 1 week, 4 week (1 month), 8 week (2 month), 12 week (3 month), 24 week (4 month), or 52 week (1 year) timescales.