National Oceanic and Atmospheric Administration (NOAA)


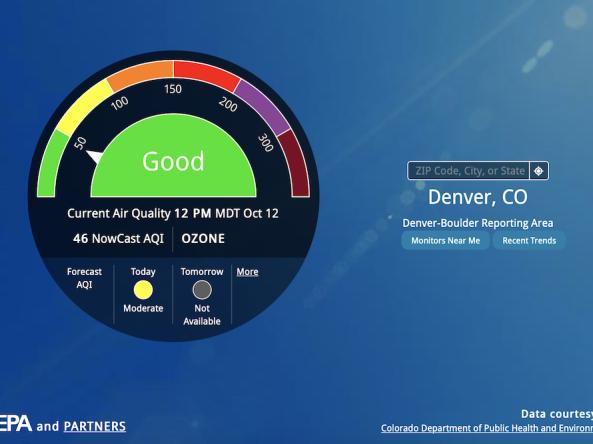
AirNow is a one-stop source for air quality data, including current and forecast air quality maps and data for more than 500 cities across the U.S., as well as Canada and Mexico.
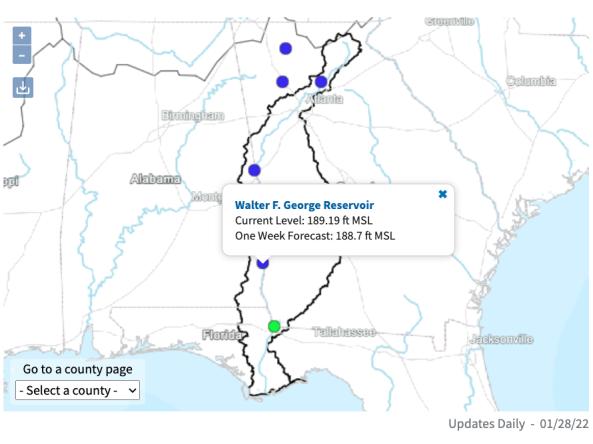
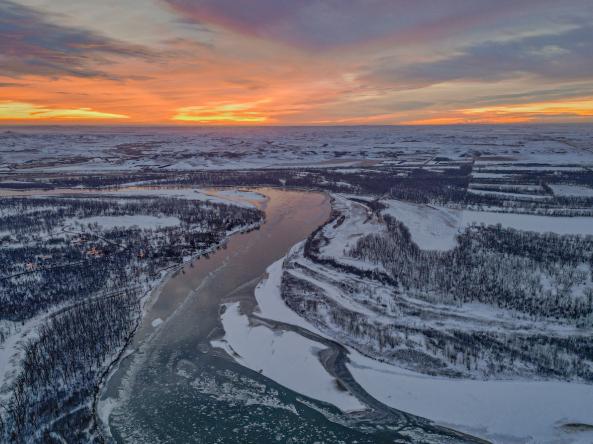
The ACF River Basin Drought and Water Dashboard is a web-based application that allows decision makers to view real-time information on the ACF River Basin all in one place.
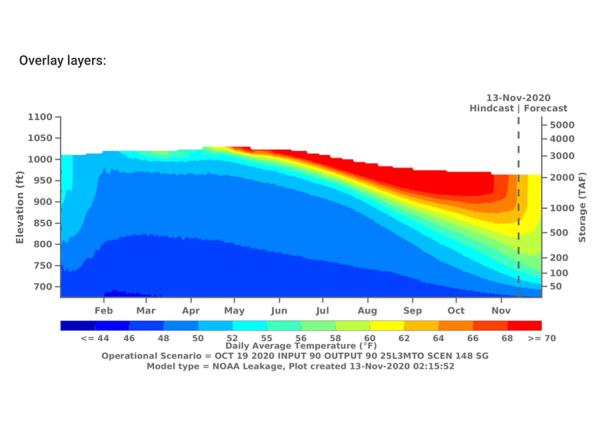
The CVTEMP tool is the public interface for modeled and observed water temperature and flow data for the Sacramento River associated with Shasta Reservoir, Shasta Dam operations, and meteorological
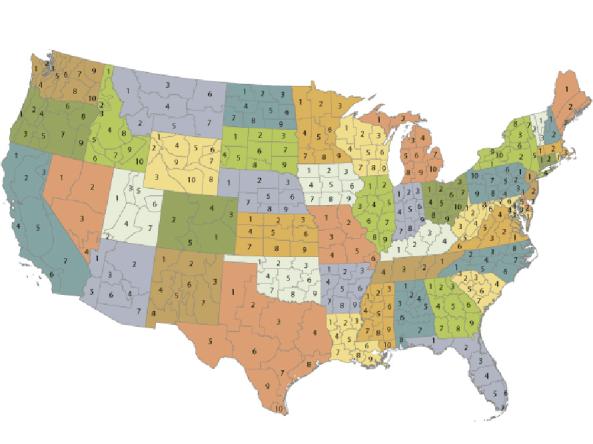
The U.S. Climate Divisional Dataset is a long-term temporally and spatially complete dataset from 1895–present for the contiguous United States.
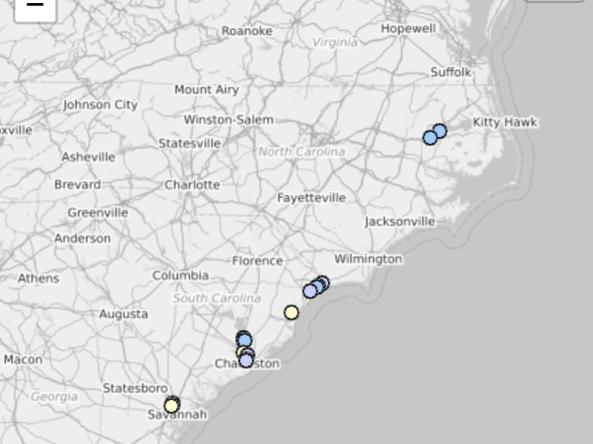
The CSI is a drought index tool that uses salinity data to characterize saline (drought) and freshwater (wet) conditions in coastal surface waters.
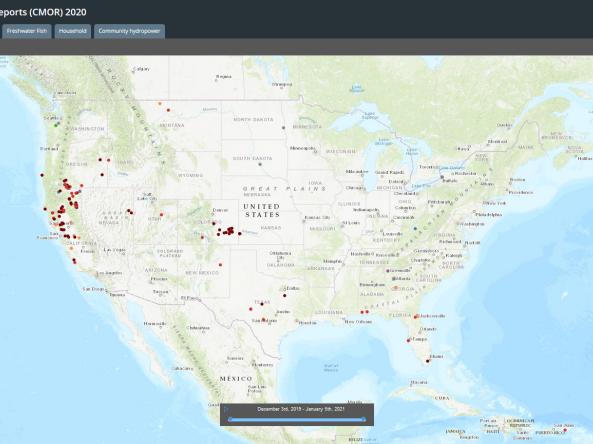
Condition Monitoring Observer Reports on Drought (CMOR-Drought) is a tool that allows citizen scientists to submit obse
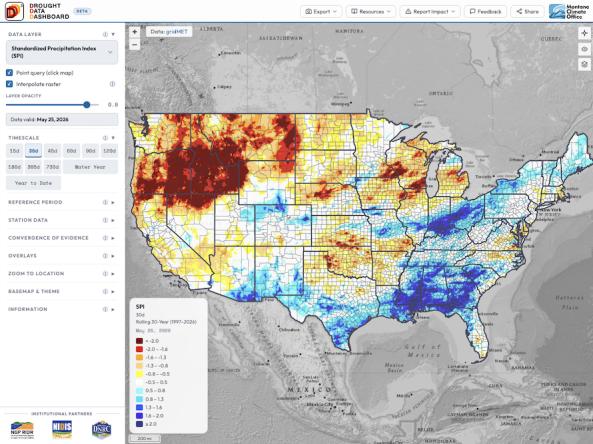
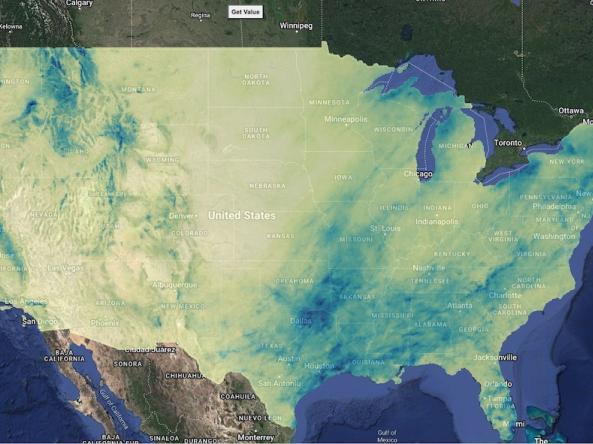
The Drought Data Dashboard, or D³, is an interactive mapping tool that allows users to view, analyze, and customize the display of key drought indices and climate variables across the co
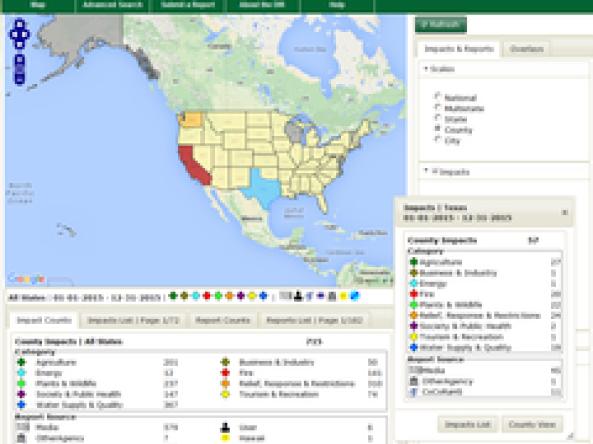
Drought Impacts Reporter (DIR): an interactive database of drought impacts in the U.S., by location, data, type, and cost built from stakeholder, government, media and other reports.
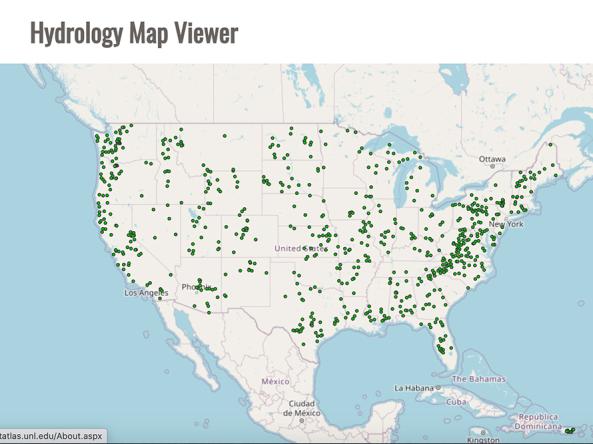
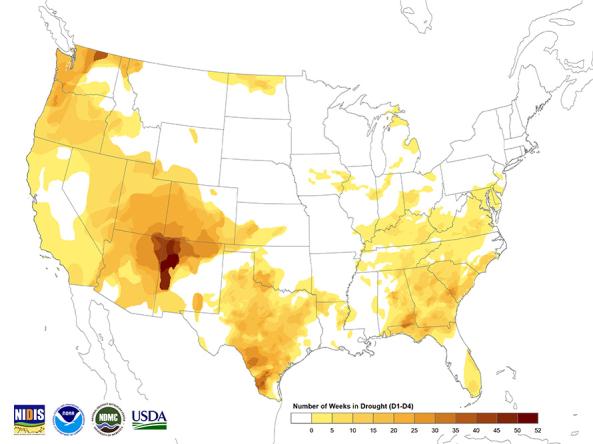
The Drought Risk Atlas provides historic data about drought through 2017 for weather stations across the United States that have at least 40 years of records.
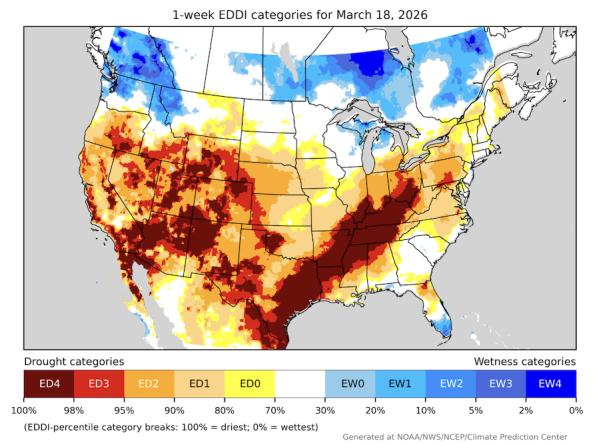
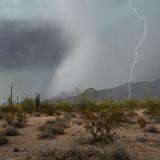
The Evaporative Demand Drought Index (EDDI) is an experimental tool that examines how anomalous the atmospheric evaporative demand (E0; also known as "the thirst of the atmosphere") is for a given
The U.S. Drought Monitor (USDM) is a weekly map, released each Thursday, to show the location and intensity of drought across the country.
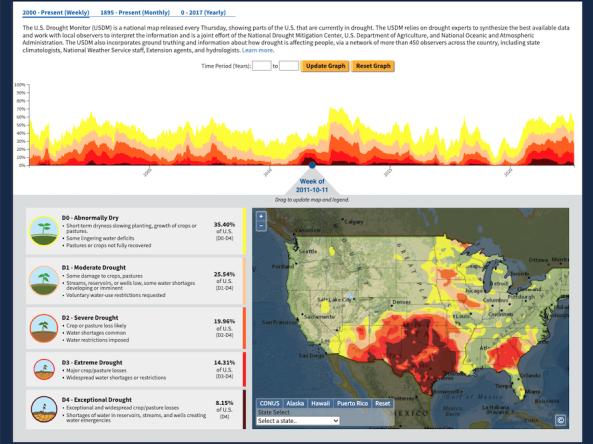
The U.S. Drought Portal's Historical Data & Conditions Tool displays three historical drought datasets side by side on an interactive time series graph and map: U.S.
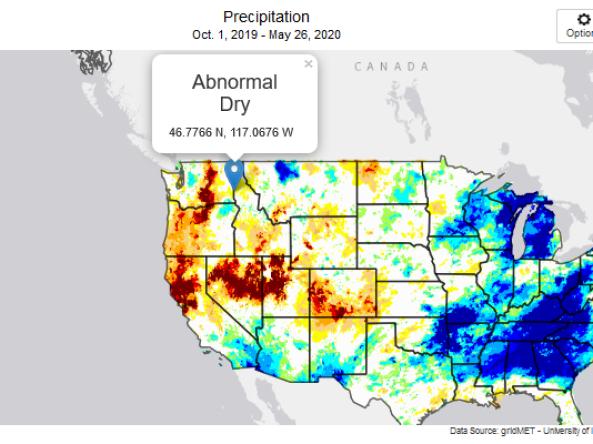
This tool, available as part of The Climate Toolbox, provides maps and summary tables of different drought types, such as agricultural and meteorological drought, for a location in the contiguous U
These experimental drought blends integrate several key drought monitoring products and indices into a single short-term or long-term product, based on the methodology developed at the NOAA Cl
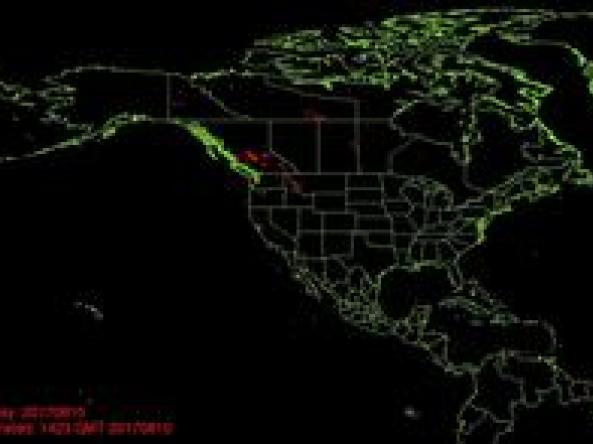
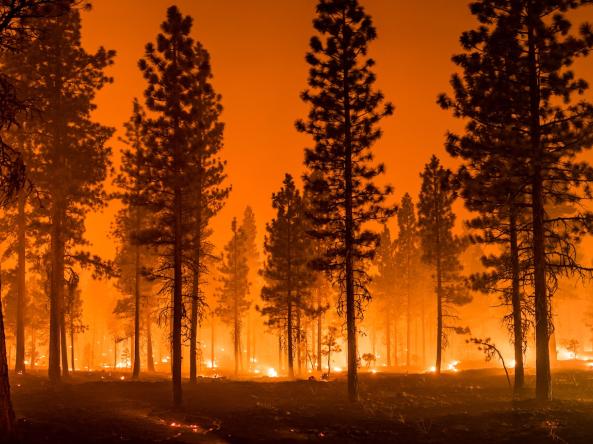
A selection of NOAA fire and smoke products.

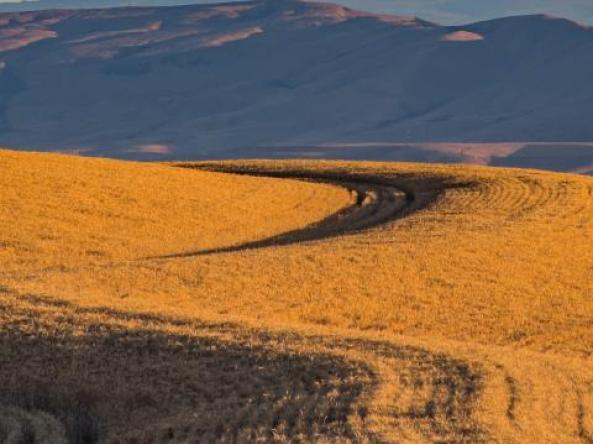
A selection of worldwide maps monitoring different aspects of vegetation health.

NOAA Quarterly Climate Impacts and Outlooks Reports: two-page reports on regional climate impacts with an overview of recent and forecast conditions produced by NOAA.
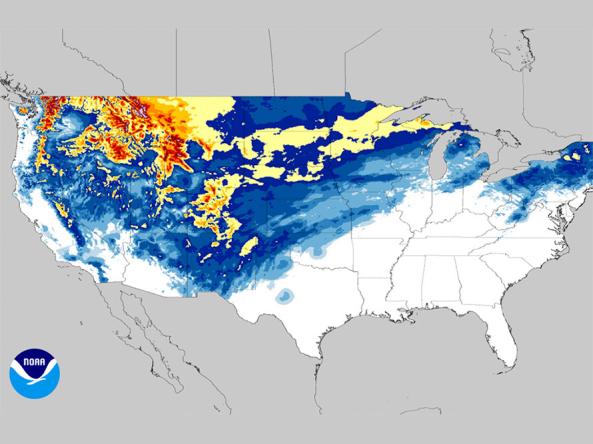
NOHRSC snow products include estimates of snow water equivalent, snow depth, snow pack temperatures, snow sublimation, snow evaporation, blowing snow, modeled and observed snow information, a
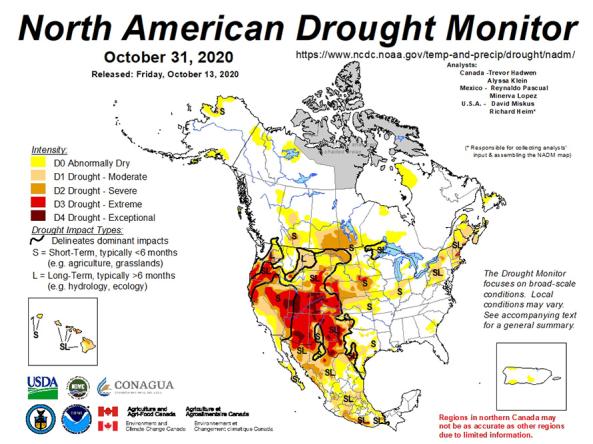
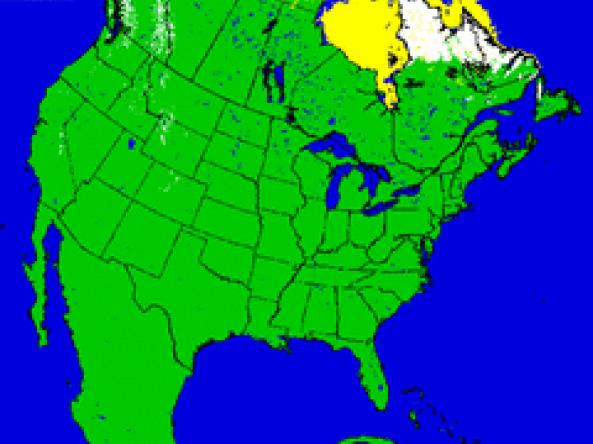
North American Drought Monitor: A collaboration between the U.S., Canada and Mexico to create a monthly continental drought monitor.
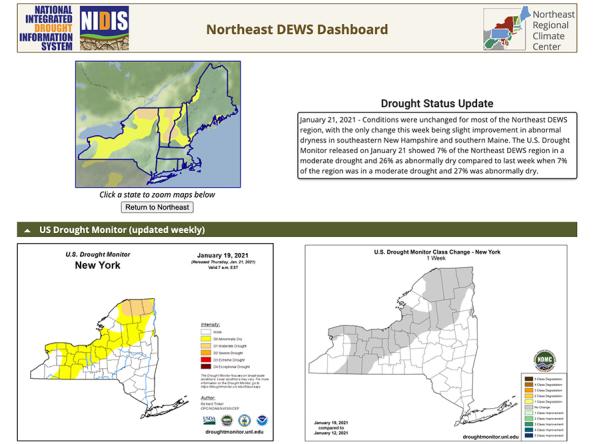
The Northeast Drought Early Warning System (DEWS) Dashboard, hosted by the Northeast Regional Climate Center, displays current drought status, impacts, and future conditions for the North

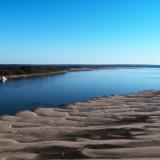
SNODAS provides estimates of snow cover, depth, snow water equivalent (SWE) and associated variables to support hydrologic modelling and analysis.
U.S. NIC provides snow maps produced using the Interactive Multisensor Snow and Ice Mapping System (IMS) depicting the extent of daily snow and ice coverage in the Northern Hemisphere.
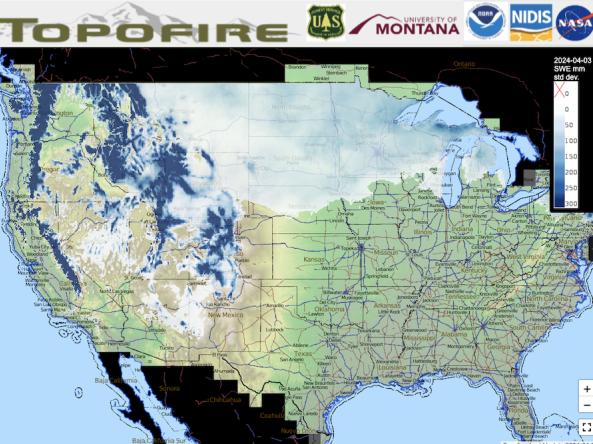
Topofire is a topographically resolved wildfire danger and drought monitoring system for the contiguous U.S.
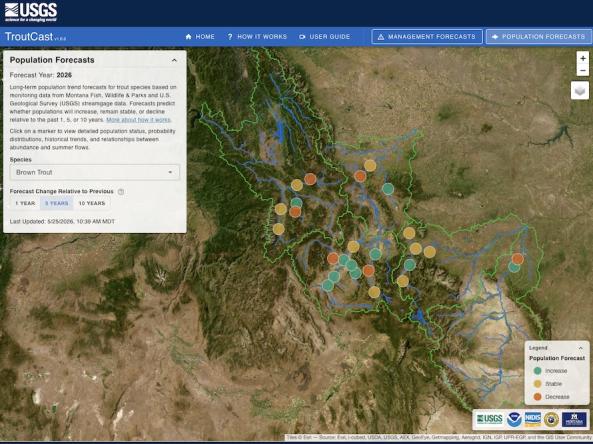
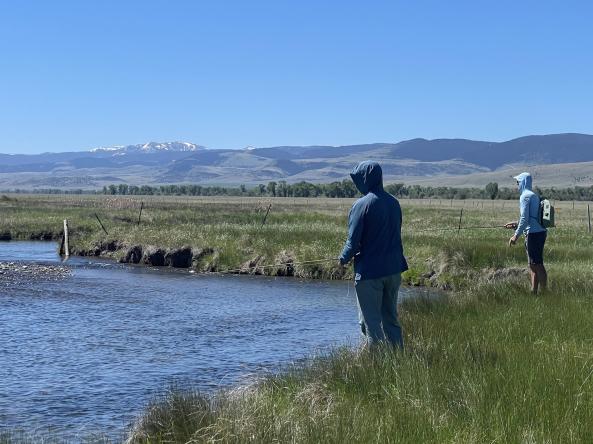
TroutCast is an interactive tool that helps users explore the projected impacts of drought on trout across Montana’s renowned blue-ribbon rivers.
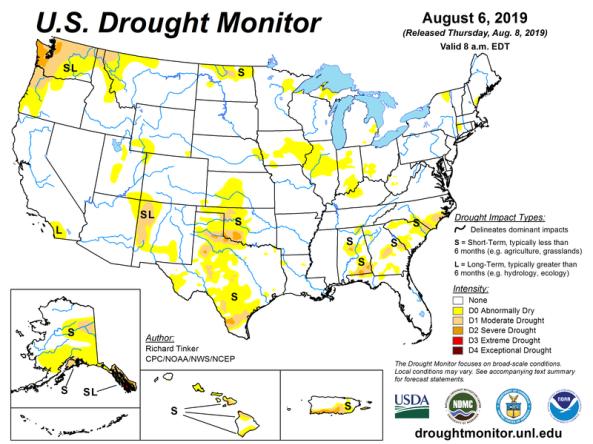
The U.S. Drought Monitor is a map updated each Thursday to show the location and intensity of drought across the country.
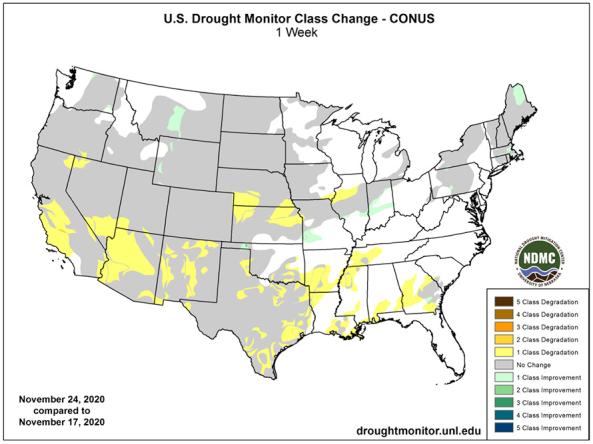
USDM Drought Change Maps display changes in drought class degradation and drought class improvements across the United States.
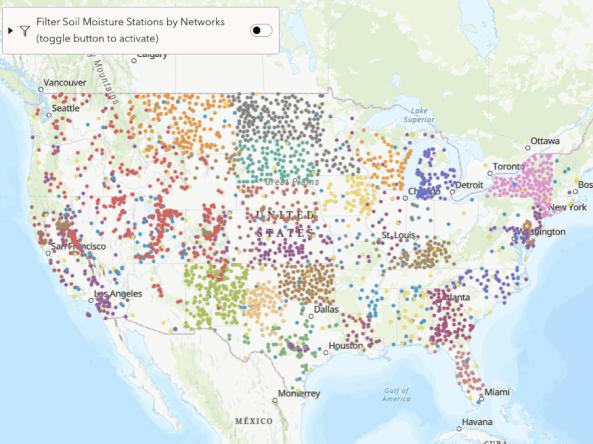
From 2018-2026, the research-based website NationalSoilMoisture.com provided high-resolution gridded soil moisture products derived from in situ soil moisture measurements, Natural Re
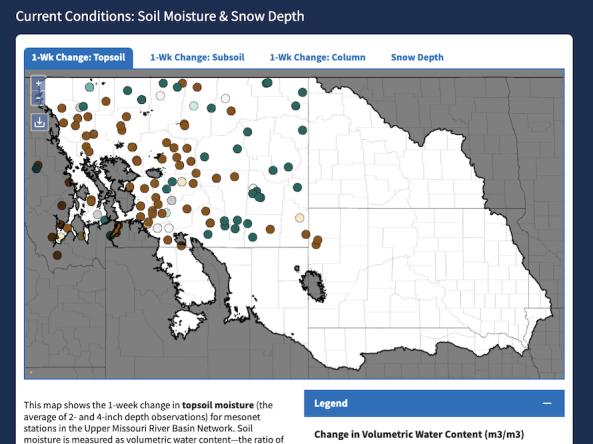
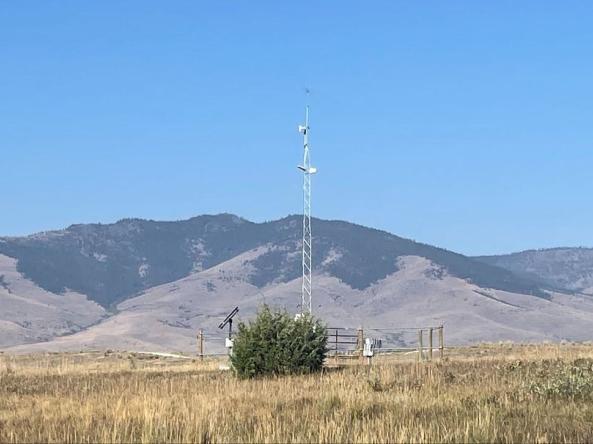
The Upper Missouri River Basin Soil Moisture and Snowpack Dashboard displays interactive maps of station-based soil moisture and snowpack data from the five state mesonets in the Upper Missou