U.S. Soil Moisture Networks Portal
National Oceanic and Atmospheric Administration (NOAA), National Integrated Drought Information System (NIDIS), United States Geological Survey (USGS), United States Department of Agriculture (USDA), The Ohio State University, Texas A&M University
In 2026, to better integrate NationalSoilMoisture.com with other products and resources of the National Coordinated Soil Moisture Monitoring Network, the original website was retired and replaced by a new website, the U.S. Soil Moisture Networks Portal, hosted on drought.gov. Migration of the hybrid soil moisture products previously associated with NationalSoilMoisture.com are in progress.
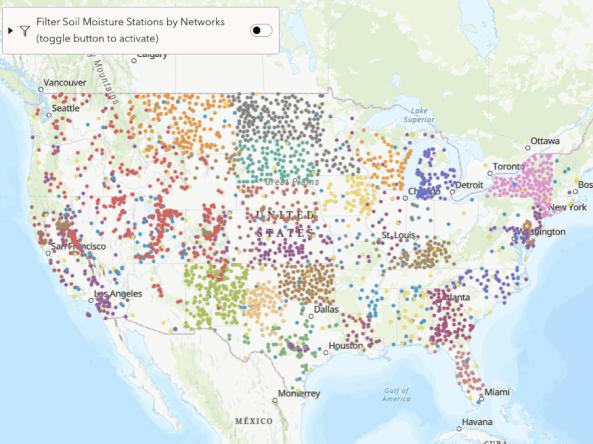
From 2018-2026, the research-based website NationalSoilMoisture.com provided high-resolution gridded soil moisture products derived from in situ soil moisture measurements, Natural Resources Conservation Service Soil Survey Geographic Database (SSURGO) soil characteristics, and PRISM data. The project combined data from multiple federal, regional, and state agencies to create comprehensive data products for the United States, including Alaska, Hawaii, and Puerto Rico. These products included near real-time soil moisture percentiles derived from in situ data, modeled NLDAS data, and NASA’s Soil Moisture Active Passive (SMAP) satellite, as well as a near real-time blended product.
The website provided soil moisture maps for 5 cm, 20 cm and 50 cm depths, updated daily based on current soil moisture conditions, with soil water content reported as a percentile (from 0 to 100). The percentiles are calculated based on the historical record, and they compare the soil water content to the historical distribution of soil water content at that location and in that month.
This project was a joint effort between the National Oceanic and Atmospheric Administration (NOAA), NOAA National Integrated Drought Information System (NIDIS), the United States Geological Survey (USGS) Center for Integrated Data Analytics (CIDA), the United States Department of Agriculture (USDA), The Ohio State University, and Texas A&M University. Led by Steven Quiring and Trent Ford, with assistance from multiple graduate students, it was a key exploratory research project under the National Coordinated Soil Moisture Monitoring Network.
Documentation and Related Publications
Zhang, N., Quiring, S. M., & T. W. Ford. (2021). Blending SMAP, Noah and In Situ Soil Moisture Using Multiple Error Estimation Methods. Journal of Hydrometeorology, 22(7): 1835–1854.
Ford, T. W., S. M. Quiring, C. Zhao, Z. T. Leasor, & C. Landry. (2020). Statistical Evaluation of In Situ Soil Moisture Observations from 1,200+ Stations as part of the U.S. National Soil Moisture Network. Journal of Hydrometeorology, 21(11): 2537–2549.
Zhao, C., S. M. Quiring, S. Yuan, D. B. McRoberts, N. Zhang, & Z. Leasor. (2020). Developing and Evaluating National Soil Moisture Percentile Maps. Soil Science Society of America Journal, 84: 443-460.
Tavakol, A., V. Rahmani, S. M. Quiring, & S. V. Kumar. (2019). Validation analysis of NASA SMAP and SPoRT-LIS soil moisture data in the United States. Remote Sensing of Environment, 229: 234-246.
Ford, T. W., & S. M. Quiring. (2019). Comparison of contemporary in situ, model, and satellite remote sensing soil moisture with a focus on drought monitoring. Water Resources Research, 55: 1565-1582.