California-Nevada Faces Continued Risk of Drought, Heat, and Wildfire Impacts During Remaining Dry Season
Key Points
- Since the start of the water year, the area of California and Nevada in drought increased by ~28% and intensified. New areas of Abnormally Dry (D0) or worse conditions crept northward in the region, according to the U.S. Drought Monitor.
- Risk is elevated for extreme heat over the next week and beyond, while outlooks suggest limited monsoon precipitation in coming weeks.
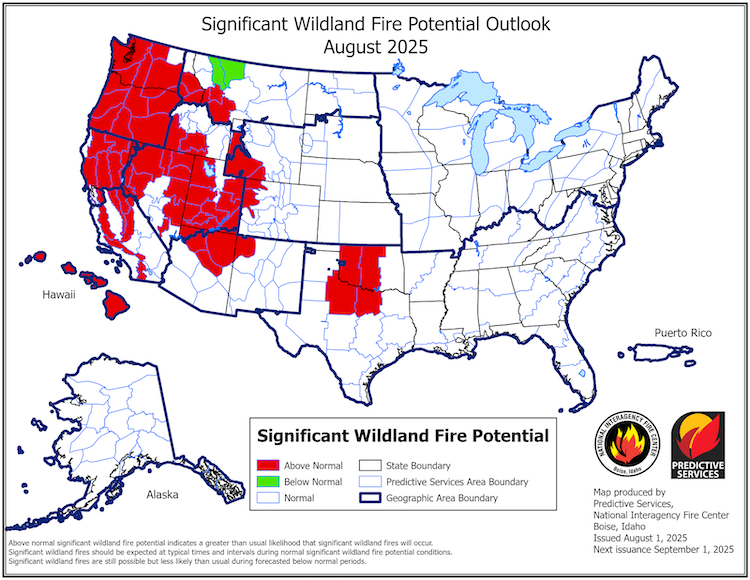
- The National Interagency Fire Center predicts above-normal fire potential in northern California and much of northern and eastern Nevada in August and September due to dry fuel conditions and warm temperatures. The Gifford Fire recently ignited on August 1 in Central California under hot, dry, and windy conditions.
- Dry, warm conditions persist in the southern two-thirds of California and much of Nevada. Drought preparedness is key as we head into the upcoming wet season (October–April).
- NIDIS and partners will continue to provide the latest information on conditions, outlooks, and impacts through the next water year.
This update is based on data available as of Monday, August 4, 2025 at 7:00 a.m. PT. We acknowledge that conditions are evolving.
The U.S. Drought Monitor depicts the location and intensity of drought across the country. The map uses 5 classifications: Abnormally Dry (D0), showing areas that may be going into or are coming out of drought, and four levels of drought (D1–D4).
The U.S. Drought Monitor is a joint effort of the National Oceanic and Atmospheric Administration, U.S. Department of Agriculture, and National Drought Mitigation Center.
This water year to date U.S. Drought Monitor change map shows where drought has improved, degraded, or remained the same from October 1, 2024–July 29, 2025. Yellow shades indicate drought degradation, while green shades indicate drought improvement, according to the U.S. Drought Monitor.
This 13-week (3-month) U.S. Drought Monitor change map shows where drought has improved, degraded, or remained the same from April 29–July 29, 2025. Yellow shades indicate drought degradation, while green shades indicate drought improvement, according to the U.S. Drought Monitor.
A drought index combines multiple drought indicators (e.g., precipitation, temperature, soil moisture) to depict drought conditions. For some products, like the U.S. Drought Monitor, authors combine their analysis of drought indicators with input from local observers. Other drought indices, like the Standardized Precipitation Index (SPI), use an objective calculation to describe the severity, location, timing, and/or duration of drought.
Learn MorePeriods of drought can lead to inadequate water supply, threatening the health, safety, and welfare of communities. Streamflow, groundwater, reservoir, and snowpack data are key to monitoring and forecasting water supply.
Learn MoreDrought can reduce the water availability and water quality necessary for productive farms, ranches, and grazing lands, resulting in significant negative direct and indirect economic impacts to the agricultural sector. Monitoring agricultural drought typically focuses on examining levels of precipitation, evaporative demand, soil moisture, and surface/groundwater quantity and quality.
Learn MoreA drought index combines multiple drought indicators (e.g., precipitation, temperature, soil moisture) to depict drought conditions. For some products, like the U.S. Drought Monitor, authors combine their analysis of drought indicators with input from local observers. Other drought indices, like the Standardized Precipitation Index (SPI), use an objective calculation to describe the severity, location, timing, and/or duration of drought.
Learn MorePeriods of drought can lead to inadequate water supply, threatening the health, safety, and welfare of communities. Streamflow, groundwater, reservoir, and snowpack data are key to monitoring and forecasting water supply.
Learn MoreDrought can reduce the water availability and water quality necessary for productive farms, ranches, and grazing lands, resulting in significant negative direct and indirect economic impacts to the agricultural sector. Monitoring agricultural drought typically focuses on examining levels of precipitation, evaporative demand, soil moisture, and surface/groundwater quantity and quality.
Learn MoreDrought & Dryness Categories
% AreaD0 – Abnormally Dry
Abnormally Dry (D0) indicates a region that is going into or coming out of drought.
D1 – Moderate Drought
Moderate Drought (D1) is the first of four drought categories (D1–D4), according to the U.S. Drought Monitor.
D2 – Severe Drought
Severe Drought (D2) is the second of four drought categories (D1–D4), according to the U.S. Drought Monitor.
D3 – Extreme Drought
Extreme Drought (D3) is the third of four drought categories (D1–D4), according to the U.S. Drought Monitor.
D4 – Exceptional Drought
Exceptional Drought (D4) is the most intense drought category, according to the U.S. Drought Monitor.
Total Area in Drought (D1–D4)
Percent area of the California–Nevada region that is currently in drought (D1–D4), according to the U.S. Drought Monitor.
Drought Degradation
5-Category Degradation
Drought/dryness has worsened by 5 categories, according to the U.S. Drought Monitor.
4-Category Degradation
Drought/dryness has worsened by 4 categories, according to the U.S. Drought Monitor.
3-Category Degradation
Drought/dryness has worsened by 3 categories, according to the U.S. Drought Monitor.
2-Category Degradation
Drought/dryness has worsened by 2 categories, according to the U.S. Drought Monitor.
1-Category Degradation
Drought/dryness has worsened by 1 category, according to the U.S. Drought Monitor.
Drought Improvement
1-Category Improvement
Drought/dryness has improved by 1 category, according to the U.S. Drought Monitor.
2-Category Improvement
Drought/dryness has improved by 2 categories, according to the U.S. Drought Monitor.
3-Category Improvement
Drought/dryness has improved by 3 categories, according to the U.S. Drought Monitor.
4-Category Improvement
Drought/dryness has improved by 4 categories, according to the U.S. Drought Monitor.
5-Category Improvement
Drought/dryness has improved by 5 categories, according to the U.S. Drought Monitor.
The U.S. Drought Monitor depicts the location and intensity of drought across the country. The map uses 5 classifications: Abnormally Dry (D0), showing areas that may be going into or are coming out of drought, and four levels of drought (D1–D4).
The U.S. Drought Monitor is a joint effort of the National Oceanic and Atmospheric Administration, U.S. Department of Agriculture, and National Drought Mitigation Center.
This water year to date U.S. Drought Monitor change map shows where drought has improved, degraded, or remained the same from October 1, 2024–July 29, 2025. Yellow shades indicate drought degradation, while green shades indicate drought improvement, according to the U.S. Drought Monitor.
This 13-week (3-month) U.S. Drought Monitor change map shows where drought has improved, degraded, or remained the same from April 29–July 29, 2025. Yellow shades indicate drought degradation, while green shades indicate drought improvement, according to the U.S. Drought Monitor.
This U.S. Drought Monitor is released every Thursday morning, with data valid through Tuesday at 7 a.m. ET.
This U.S. Drought Monitor (USDM) and USDM change maps are released every Thursday morning, with data valid through Tuesday at 7 a.m. ET.
This U.S. Drought Monitor (USDM) and USDM change maps are released every Thursday morning, with data valid through Tuesday at 7 a.m. ET.
A drought index combines multiple drought indicators (e.g., precipitation, temperature, soil moisture) to depict drought conditions. For some products, like the U.S. Drought Monitor, authors combine their analysis of drought indicators with input from local observers. Other drought indices, like the Standardized Precipitation Index (SPI), use an objective calculation to describe the severity, location, timing, and/or duration of drought.
Learn MorePeriods of drought can lead to inadequate water supply, threatening the health, safety, and welfare of communities. Streamflow, groundwater, reservoir, and snowpack data are key to monitoring and forecasting water supply.
Learn MoreDrought can reduce the water availability and water quality necessary for productive farms, ranches, and grazing lands, resulting in significant negative direct and indirect economic impacts to the agricultural sector. Monitoring agricultural drought typically focuses on examining levels of precipitation, evaporative demand, soil moisture, and surface/groundwater quantity and quality.
Learn MoreA drought index combines multiple drought indicators (e.g., precipitation, temperature, soil moisture) to depict drought conditions. For some products, like the U.S. Drought Monitor, authors combine their analysis of drought indicators with input from local observers. Other drought indices, like the Standardized Precipitation Index (SPI), use an objective calculation to describe the severity, location, timing, and/or duration of drought.
Learn MorePeriods of drought can lead to inadequate water supply, threatening the health, safety, and welfare of communities. Streamflow, groundwater, reservoir, and snowpack data are key to monitoring and forecasting water supply.
Learn MoreDrought can reduce the water availability and water quality necessary for productive farms, ranches, and grazing lands, resulting in significant negative direct and indirect economic impacts to the agricultural sector. Monitoring agricultural drought typically focuses on examining levels of precipitation, evaporative demand, soil moisture, and surface/groundwater quantity and quality.
Learn MoreA drought index combines multiple drought indicators (e.g., precipitation, temperature, soil moisture) to depict drought conditions. For some products, like the U.S. Drought Monitor, authors combine their analysis of drought indicators with input from local observers. Other drought indices, like the Standardized Precipitation Index (SPI), use an objective calculation to describe the severity, location, timing, and/or duration of drought.
Learn MorePeriods of drought can lead to inadequate water supply, threatening the health, safety, and welfare of communities. Streamflow, groundwater, reservoir, and snowpack data are key to monitoring and forecasting water supply.
Learn MoreDrought can reduce the water availability and water quality necessary for productive farms, ranches, and grazing lands, resulting in significant negative direct and indirect economic impacts to the agricultural sector. Monitoring agricultural drought typically focuses on examining levels of precipitation, evaporative demand, soil moisture, and surface/groundwater quantity and quality.
Learn MoreCurrent Drought Conditions for California/Nevada
- A year ago (early August 2024), less than 5% of California-Nevada was in drought, according to the U.S. Drought Monitor. By the start of the 2025 Water Year (October 1, 2024), around 20% of the region (southern Nevada and southeastern California) was in drought, in part due to a lack of summer monsoon activity last year. Drought in the region persisted and intensified over fall and winter, and by the beginning of April 2025, drought covered 44% of the region, with Extreme to Exceptional Drought (D3-D4) in southern Nevada and southeastern California.
- Since April, drought and dryness expanded into the northern part of the region, while drought improved but persisted in southern California and Nevada.
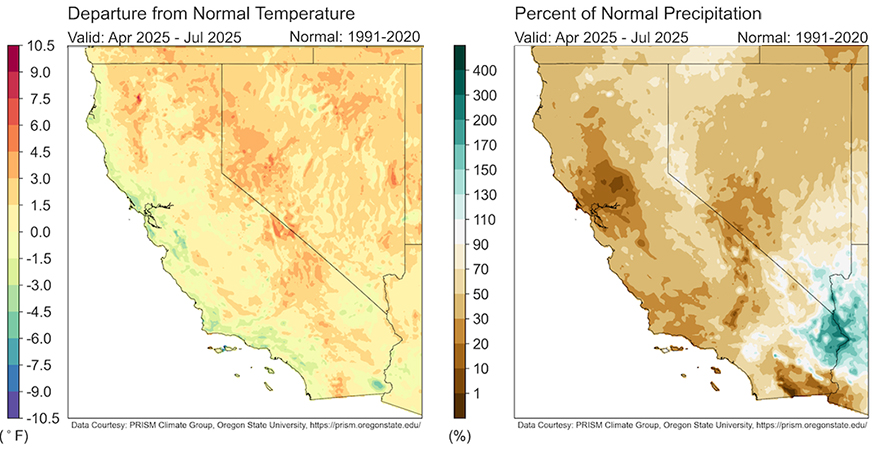
- From April–July, temperatures along the coast (Figure 2) were normal to slightly below normal, with above-normal temperatures increasing to as much as 3-6° Fahrenheit (F) near the California/Nevada border.
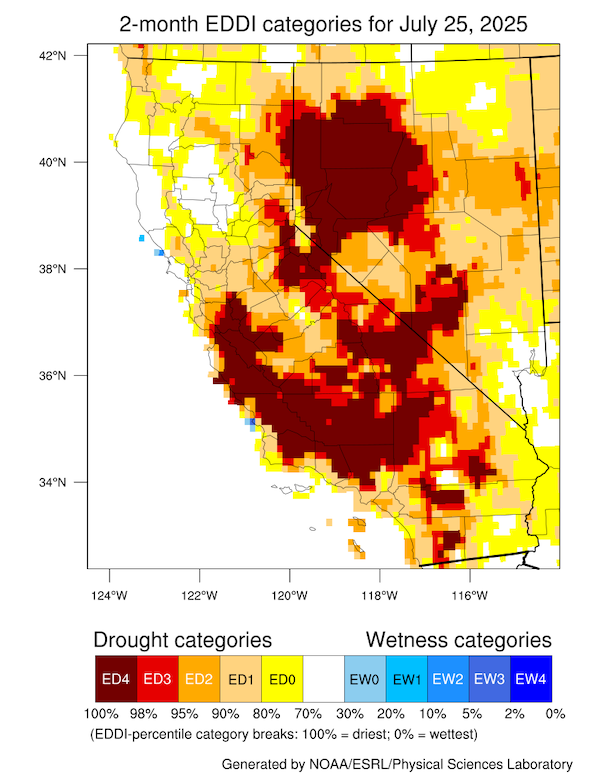
- Over the last two months, evaporative demand (the “thirst of the atmosphere”) has been high in central California and northwestern Nevada (Figure 3). Fuels are also a concern. For example, critically dry fuel conditions are present in northwestern and eastern Nevada.
- California year-to-date wildland fires are slightly above the 5-year normal according to Cal-Fire. Both the Mount Irish and Hot Canyon fires exhibited extreme fire behavior.
- While extended dryness would typically result in increased potential for large fires, precipitation and cooler temperatures in recent weeks mitigated fire risk. But conditions have dried out and warmed up again. The Gifford Fire recently ignited on August 1 in Central California under hot, dry, and windy conditions.
- As of mid-July, the U.S. Department of Agriculture (USDA) 2025 secretarial drought designations encompass much of southern California through southern and eastern Nevada.
- Major California water supply reservoirs remain near or above their historical averages. Reservoirs in all regions of Nevada are below capacity compared to July 2024, with the largest changes in reservoirs in the Carson and Lower Humboldt regions. Both Lake Powell and Lake Mead are near 30% of storage capacity.
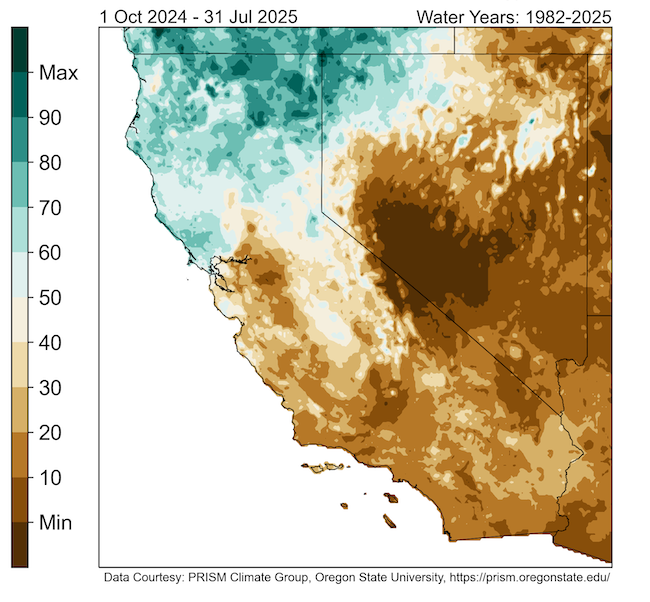
Below-Normal Water Year Precipitation in Central and Southern California-Nevada
Drought Expands in Much of Nevada After a Dry, Warm April-July
High Evaporative Demand Over the Last 2 Months Indicates Higher Fire Risk
Outlooks and Potential Impacts for California-Nevada
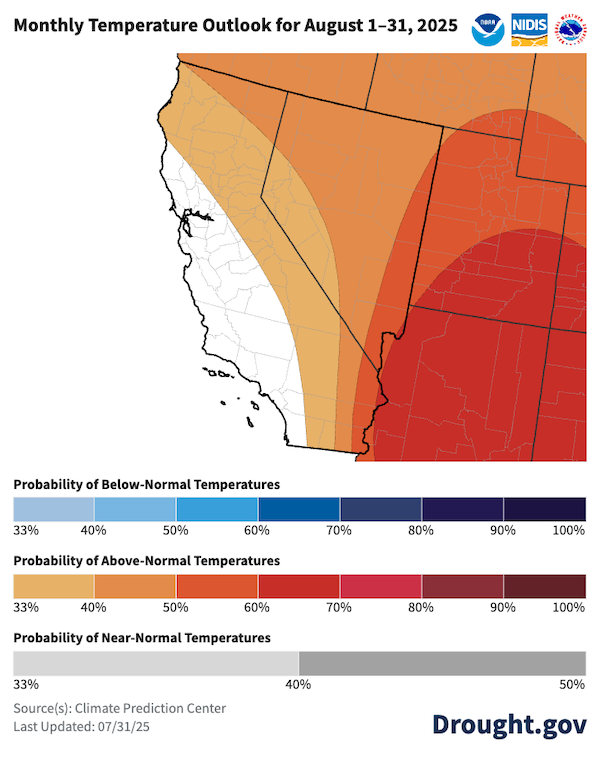
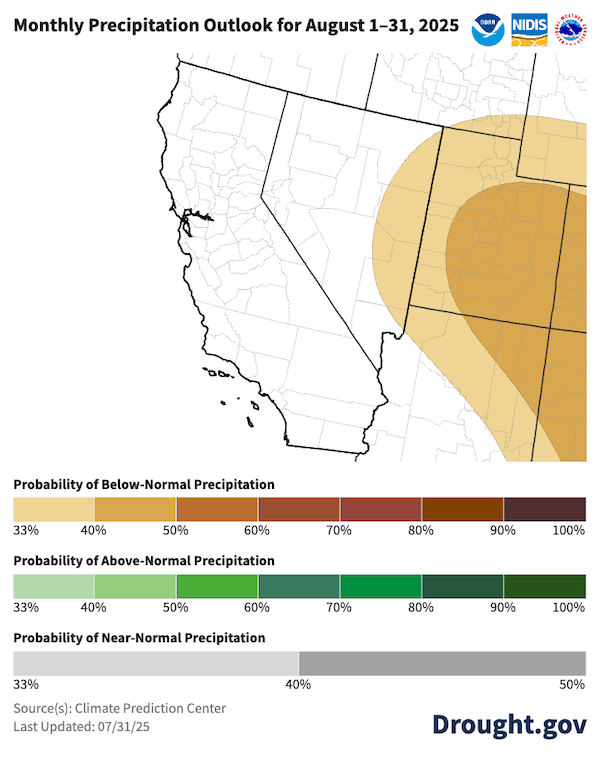
- For most of the region, the National Weather Service Climate Prediction Center’s seasonal outlooks (August–October) show slightly greater chances of warmer-than-normal temperatures, with equal chances of above-, near-, or below-normal precipitation. August outlooks (Figures 4, 5) show similar trends, but with equal chances of above-, below-, or near-normal temperatures along the California coast.
- The National Weather Service warned about increased risk of extreme heat for much of California-Nevada in early August, except over coastal California.
- Next week and the following week, the precipitation outlook leans near normal or slightly below normal for the region, including southern Nevada and southeast California, suggesting limited monsoonal precipitation. Most of the rest of the California-Nevada region is typically dry this time of year.
- Existing drought conditions are forecast to persist over the next one to three months. Drought impacts, such as to vegetation, agriculture, public health, and fire potential, are expected to continue in central and southern parts of California and much of Nevada as we wrap up the warm season.
- The National Interagency Fire Center predicts above-normal fire potential in northern California and much of northern and eastern Nevada in August (Figure 6) and September due to dry fuel conditions and warm temperatures.
- The El Niño–Southern Oscillation (ENSO) is currently neutral and likely to stay that way this fall. As we transition from fall to winter, forecasts favor remaining neutral or La Niña conditions. It remains to be seen what this means for the 2025-2026 wet season and drought relief or intensification.
- NIDIS and partners will continue to provide the latest information on conditions, outlooks, and impacts through the next water year.
August Outlook Favors Warmer Temperatures (Except Along the Coast)
August Precipitation Outlook Favors Equal Chances of Above-, Below-, or Near-Normal Precipitation
Greater Risk of Significant Wildland Fire Potential Widespread Through August–September
Resources
- Explore regional and state drought information:
- NIDIS and partners are piloting a series of Southern California Sector-Specific Drought Early Warning Outlooks in Water Year 2025. Learn more and get involved by contacting Amanda Sheffield (amanda.sheffield@noaa.gov).
Register for the September 22 California-Nevada Drought and Climate Outlook Webinar, which will provide an overview of climate and drought conditions, impacts, and outlooks (including fire).
Given the risk of wildfire and heat, here are some additional resources:
- AirNow: Air Quality Index Monitoring and Forecasts
- Drought.gov Wildfire Data and Maps
- Drought.gov Public Health Data and Maps
- Look for local National Weather Service Weather Forecast Offices aerts and Drought Information Statements
- Heat.gov
- State resources on heat: California (CalHeatScore), Nevada
Prepared By
Amanda Sheffield
California-Nevada DEWS Regional Drought Information Coordinator
Cooperative Institute for Research in Environmental Sciences (CIRES), University of Colorado Boulder
NOAA’s National Integrated Drought Information System
Julie Kalansky
Principal Investigator
California-Nevada Adaptation Program (a NOAA CAP/RISA team)
This Drought Status Update is issued in partnership between the National Oceanic and Atmospheric Administration (NOAA), the California-Nevada Adaptation Program (a NOAA CAP team), and the Western Regional Climate Center at the Desert Research Institute to communicate a potential area of concern for drought expansion and/or development within the California-Nevada DEWS region based on recent conditions and the upcoming forecast. NIDIS and its partners will issue future Drought Status Updates as conditions evolve.
