Coastal Salinity Index (CSI)
U.S. Geological Survey
The Coastal Salinity Index (CSI) is a long-term monitoring tool that characterizes relative changes in coastal salinity regimes for salinity gages with long periods of record. The CSI was developed to characterize coastal drought, monitor changing salinity conditions, and improve our understanding of the effects of changing salinities on fresh and saltwater ecosystems, fish habitat, and freshwater availability, providing economic, human health, and environmental benefits.
The CSI uses an approach similar to the Standardized Precipitation Index (SPI) to show the probability of recording a given salinity value in a particular month A value of zero indicates historical mean salinity, and positive and negative values represent increasingly fresh and saline conditions, respectively. The CSI uses the same classification scheme as the U.S. Drought Monitor for high saline (or drought) conditions and the inverse for wet conditions.
The CSI can be computed for multiple time intervals from 1 to 24 months to characterize short- and long-term conditions. The CSI does not depict hourly to daily salinity fluctuations, but the response to monthly (and longer) precipitation and streamflow conditions.
The Coastal Salinity Index project has been supported by the National Integrated Drought Information System (NIDIS), the National Oceanic and Atmospheric Administration (NOAA), the Carolinas Integrated Sciences and Assessments program, and the U.S. Geological Survey.
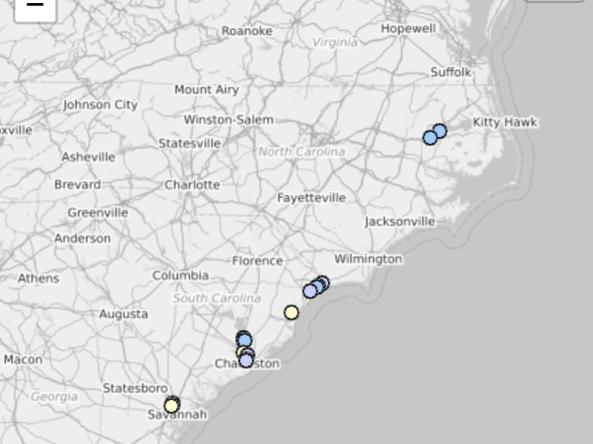
Coastal drought can impact the salinity dynamics of creeks, rivers, and estuaries. The Coastal Salinity Index (CSI) is a long-term monitoring tool that measures relative changes in salinity for gauges along the East and Gulf Coasts.
This map shows salinity conditions over the past month compared to the historical mean. Red and orange hues indicate high saline (coastal drought, or CD) conditions, and blue hues indicate freshwater (coastal wet, or CW) conditions.
The Coastal Salinity Index (CSI) is a long-term monitoring tool that measures relative changes in coastal salinity for gages along the East and Gulf Coasts. It was developed to characterize coastal drought, monitor changing salinity conditions, and improve understanding of the effects of changing salinities on fresh and saltwater ecosystems.
This map shows salinity classifications over the past 3 months. Red and orange hues indicate high saline (drought) conditions, and blue hues indicate freshwater conditions.
Saline Conditions
CD4: Exceptional Salinity Conditions (CSI of -2.0 or less)
Exceptional Salinity Conditions (CD4) means that this gauge has a Coastal Salinity Index (CSI) value of -2 or less. A CSI of of zero indicates historical mean salinity, and negative values indicate increasingly saline conditions. Learn more about how this index is calculated.
CD3: Extreme Salinity Conditions (CSI of -1.99 to -1.60)
Extreme Salinity Conditions (CD3) means that this gauge has a Coastal Salinity Index (CSI) value of -1.99 to -1.6. A CSI of of zero indicates historical mean salinity, and negative values indicate increasingly saline conditions. Learn more about how this index is calculated.
CD2: Severe Salinity Conditions (CSI of -1.59 to -1.30)
Severe Salinity Conditions (CD2) means that this gauge has a Coastal Salinity Index (CSI) value of -1.59 to -1.30. A CSI of of zero indicates historical mean salinity, and negative values indicate increasingly saline conditions. Learn more about how this index is calculated.
CD1: Moderate Salinity Conditions (CSI of -1.29 to -0.80)
Moderate Salinity Conditions (CD1) means that this gauge has a Coastal Salinity Index (CSI) value of -1.29 to -0.8. A CSI of of zero indicates historical mean salinity, and negative values indicate increasingly saline conditions. Learn more about how this index is calculated.
CD0: Abnormal Salinity Conditions (CSI of -0.79 to -0.50)
Abnormal Salinity Conditions (CD0) means that this gauge has a Coastal Salinity Index (CSI) value of -0.79 to -0.5. A CSI of of zero indicates historical mean salinity, and negative values indicate increasingly saline conditions. Learn more about how this index is calculated.
Normal Salinity Conditions (CSI of -0.49 to 0.50)
This gauge has a Coastal Salinity Index value between -0.49 to 0.50, which means it has near-normal saline conditions compared to the historical mean. A CSI of of zero indicates historical mean salinity, and positive values indicate increasingly freshwater conditions. Learn more about how this index is calculated.
Freshwater Conditions
CW0: Abnormal Freshwater Conditions (CSI of 0.51 to 0.80)
Abnormal Freshwater Conditions (CW0) means that this gauge has a Coastal Salinity Index (CSI) value of 0.5 to 0.8. A CSI of of zero indicates historical mean salinity, and positive values indicate increasingly freshwater conditions. Learn more about how this index is calculated.
CW1: Moderate Freshwater Conditions (CSI of 0.81 to 1.30)
Moderate Freshwater Conditions (CW1) means that this gauge has a Coastal Salinity Index (CSI) value of 0.81 to 1.3. A CSI of of zero indicates historical mean salinity, and positive values indicate increasingly freshwater conditions. Learn more about how this index is calculated.
CW2: Severe Freshwater Conditions (CSI of 1.31 to 1.60)
Severe Freshwater Conditions (CW2) means that this gauge has a Coastal Salinity Index (CSI) value of 1.31 to 1.6. A CSI of of zero indicates historical mean salinity, and positive values indicate increasingly freshwater conditions. Learn more about how this index is calculated.
CW3: Extreme Freshwater Conditions (CSI of 1.61 to 2.00)
Extreme Freshwater Conditions (CW3) means that this gauge has a Coastal Salinity Index (CSI) value of 1.61 to 2.0. A CSI of of zero indicates historical mean salinity, and positive values indicate increasingly freshwater conditions. Learn more about how this index is calculated.
CW4: Exceptional Freshwater Conditions (CSI of 2.01 or more)
Exceptional Freshwater Conditions (CW4) means that this gauge has a Coastal Salinity Index (CSI) value of more than 2.0. A CSI of of zero indicates historical mean salinity, and positive values indicate increasingly freshwater conditions. Learn more about how this index is calculated.
No Data
Coastal Salinity Index data are unavailable for this gauge.
Coastal drought can impact the salinity dynamics of creeks, rivers, and estuaries. The Coastal Salinity Index (CSI) is a long-term monitoring tool that measures relative changes in salinity for gauges along the East and Gulf Coasts.
This map shows salinity conditions over the past month compared to the historical mean. Red and orange hues indicate high saline (coastal drought, or CD) conditions, and blue hues indicate freshwater (coastal wet, or CW) conditions.
The Coastal Salinity Index (CSI) is a long-term monitoring tool that measures relative changes in coastal salinity for gages along the East and Gulf Coasts. It was developed to characterize coastal drought, monitor changing salinity conditions, and improve understanding of the effects of changing salinities on fresh and saltwater ecosystems.
This map shows salinity classifications over the past 3 months. Red and orange hues indicate high saline (drought) conditions, and blue hues indicate freshwater conditions.
Coastal Salinity Index data are updated daily.
Coastal Salinity Index data are updated daily.
How To
Click on any station icon on the map to access the following information:
- The station identification number, station name, and a link to the National Water Information System station current conditions page data.
- The current CSI 12-month interval value.
- The CSI stacked graph that allows the user to evaluate short- (1-month) to long-term (24-month) conditions in one graph. Learn how to read the stacked graph.
- A link to all the CSI graphs for that particular gauge.
You can also download CSV files with data for specific stations or all stations.
Access
Coastal Salinity Index Tool: View the Coastal Salinity Index (CSI) value for gages at 1-month to 24-month timescales n the U.S. Geological Survey website.
Additional Real-Time Data: View real-time trends in salinity, water temperature, and gage height at the CSI sites.
Resources: Access CSI real-time data, R package, user guide, and related publications.
Documentation
About the CSI: Learn about the motivations and methodology behind this tool
Coastal Salinity Index: User Guide
Publications:
- Petkewich, M.D., Lackstrom, K., McCloskey, B.J., Rouen, L.F., and Conrads, P.A., 2019. Coastal Salinity Index along the southeastern Atlantic coast and the Gulf of Mexico, 1983 to 2018. U.S. Geological Survey Open-File Report 2019–1090.
- Conrads, P.A., K.D. Rodgers, D.L. Passeri, S.T. Prinos, C. Smith, C.M. Swarzenski, B.A. Middleton. 2018. Coastal estuaries and lagoons: The delicate balance at the edge of the sea. USGS Fact Sheet 2018-3022.
- Conrads, P.A. and L.S. Darby, 2017. Development of a Coastal Drought Index Using Salinity Data. Bulletin of the American Meteorological Society 98, 753–766.
- Nolan, C. B., D.L. Tufford, and D.R. Chalcraft. 2016. Needs Assessment of Coastal Land Managers for Drought Onset Indicators in the Southeastern United States, Journal of Coastal Research 32 (5), 1016-1024.
Download Data
Download Coastal Salinity Index data and input data: Click the links on the table of stations to download.
Coastal Salinity Index R Package
Download Coastal Salinity Index data from Drought.gov via the NOAA/NCEI Directory or our Google Cloud Storage. Both are publicly accessible, but the latter requires logging in with a Google account. JSON, GeoJSON, and CSV files are available, labeled "usgs-csi" followed by the timescale in months (e.g., usgs-csi1 for 1-month CSI).