Gridded U.S. Drought Monitor (USDM)
National Oceanic and Atmospheric Administration (NOAA), NOAA National Centers for Environmental Information (NCEI), NOAA National Integrated Drought Information System (NIDIS), National Drought Mitigation Center, U.S. Department of Agriculture, National Aeronautics and Space Administration
The U.S. Drought Monitor (USDM) is a weekly map, released each Thursday, to show the location and intensity of drought across the country. The USDM uses a five-category system, labeled Abnormally Dry or D0, (a precursor to drought, not actually drought), and Moderate (D1), Severe (D2), Extreme (D3) and Exceptional (D4) Drought.
Using a 5km grid, USDM data was extracted weekly to produce weekly and annual maps. Below is a list of dynamic and static products that are available.
Change and Summary Counts– data updates weekly with the release of the USDM (every Thursday):
- Weekly USDM Drought Change – displays the categorical change between the current week to the previous week.
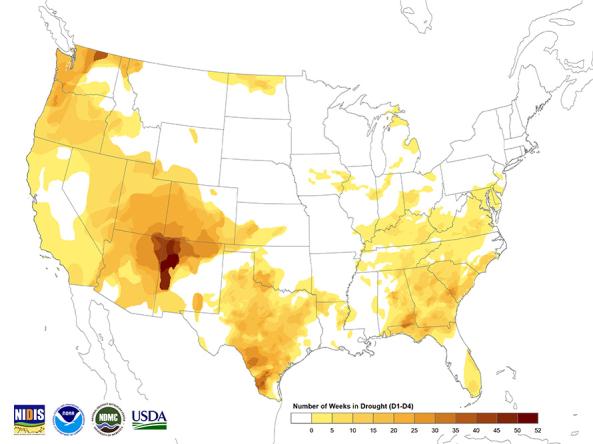
- 52-week Count of USDM Drought – displays the number of weeks, over the past 52-weeks, a location experienced drought, defined as USDM category “D1 – Moderate Drought” or greater, across the United States.
Annual Summaries – annual maps were generated to provide a snapshot of U.S. drought from 2000 – 2019, from slightly different perspectives:
- Annual Maximum USDM Drought – displays the most intense weekly USDM classification for locations across the United States, regardless of when the designation occurred.
- Annual Weekly Count of USDM D0-D4 Drought – displays the number of weeks, throughout the year, a location experienced drought, defined as USDM category “D0 – Abnormally Dry” or greater, across the United States.
- Annual Weekly Count of USDM D1-D4 Drought – displays the number of weeks, throughout the year, a location experienced drought, defined as USDM category “D1 – Moderate Drought” or greater, across the United States.
- Annual Weekly Count of USDM D2-D4 Drought – displays the number of weeks, throughout the year, a location experienced drought, defined as USDM category “D2 – Severe Drought” or greater, across the United States.
- Annual Cumulative Drought Index – combines the intensity and duration of drought, tabulated over the course of the year. It is calculated by multiplying the USDM category (D0=0, D1=1, D2=2, D3=3, & D4=4) by the number of weeks designated in that category. For example, a location in D2 drought for 20 weeks and D1 drought for 5 weeks equals a cumulative intensity of 45 (20x2 plus 5x1). The maximum value possible is 208 (52x4).
Gridded USDM Data – a gridded version of the US Drought Monitor (USDM), updated each Thursday in GeoTIFF format.
The USDM is jointly produced by the National Oceanic and Atmospheric Administration (NOAA), the United States Department of Agriculture (USDA), the National Aeronautics and Space Administration, and the National Drought Mitigation Center (NDMC). The weekly maps are based on measurements of climatic, hydrologic and soil conditions as well as reported impacts and observations from more than 350 contributors around the U.S.
This map shows the number of weeks locations across the U.S. spent in drought (D1–D4), according to the U.S. Drought Monitor over the past 52 weeks, on a rolling basis.
Number of weeks in drought
0 Weeks in Drought
Over the past 52 weeks, this location has spent 0 weeks in drought (D1–D4), according to the U.S. Drought Monitor.
1–10 Weeks in Drought
Over the past 52 weeks, this location has spent 1–10 weeks in drought (D1–D4), according to the U.S. Drought Monitor.
11–20 Weeks in Drought
Over the past 52 weeks, this location has spent 11–20 weeks in drought (D1–D4), according to the U.S. Drought Monitor.
21–30 Weeks in Drought
Over the past 52 weeks, this location has spent 21–30 weeks in drought (D1–D4), according to the U.S. Drought Monitor.
31–40 Weeks in Drought
Over the past 52 weeks, this location has spent 31–40 weeks in drought (D1–D4), according to the U.S. Drought Monitor.
41–50 Weeks in Drought
Over the past 52 weeks, this location has spent 41–50 weeks in drought (D1–D4), according to the U.S. Drought Monitor.
Over the past 52 weeks, this location has spent 51–52 weeks in drought (D1–D4), according to the U.S. Drought Monitor.
This map shows the number of weeks locations across the U.S. spent in drought (D1–D4), according to the U.S. Drought Monitor over the past 52 weeks, on a rolling basis.
How to
How to use this site:
- Change and summary count data updates weekly
- Download weekly data – available in in GeoJSON or TopoJSON
- Weekly change data
- 52-week accumulation data
- Download weekly data – available in in GeoJSON or TopoJSON
- Annual summaries are organized by year from 2000 – 2019
- To view maps, select a year of interest and view the available USDM annual maps
- Maps are available at the contiguous and entire United States
- To download data, select a year of interest and download the ZIP folder (“USDMYYY_gridannual.zip” where “YYYY” represents the year of interest)
- ZIP folder contains raster files in TIFF format for the United States
- To view maps, select a year of interest and view the available USDM annual maps
Access
Change and summary counts of USDM data: directory of products
- Weekly USDM Change data: displays the USDM categorical drought change between the current and previous weeks. File updates weekly (Thursdays) after the release of the USDM. (Files - GeoJSON and TopoJSON).
- 52-week USDM (D1-D4) Count data: a moving 52-week window displaying the number of weeks a location was in drought. File updates weekly (Thursdays) after the release of the USDM. (Files - GeoJSON and TopoJSON).
Annual summaries of USDM maps and data: includes a series of annual maps and raster data from 2000 – 2019. Images are available in PNG format and data for these maps are available in TIFF format. TIFF files have been packaged into ZIP folders by year. Nomenclature for the filenames are as follows:
- Annual maximum drought maps – filenames are listed as “USDMYYYY_max.png” where “YYYY” represents the four-digit year.
- Number of weeks in D0-D4 drought maps – filenames are listed as “USDMYYYY_d0d4weeks.png” where “YYYY” represents the four-digit year.
- Number of weeks in D1-D4 drought maps – filenames are listed as “USDMYYYY_d1d4weeks.png” where “YYYY” represents the four-digit year.
- Number of weeks in D2-D4 drought maps – filenames are listed as “USDMYYYY_d2d4weeks.png” where “YYYY” represents the four-digit year.
- Cumulative Drought Index (CDI) maps – filenames are listed as “USDMYYYY_CDI.png” where “YYYY” represents the four-digit year.
Note – ZIP folders filenames follow this nomenclature: “USDMYYYY_gridannual.zip” where “YYYY” represents the year of interest. Each ZIP folder contains five TIFF files that were used to generate the PNG maps. TIFF files are named to match the above nomenclature for the maps above.
Gridded USDM data: a gridded version of the USDM, with a resolution of 0.025 degrees, updated each Thursday.