Historical Drought Data & Conditions Tool: U.S. Drought Portal
National Oceanic and Atmospheric Administration (NOAA), NOAA's National Centers for Environmental Information (NCEI), U.S. Department of Agriculture (USDA), National Drought Mitigation Center (NDMC)
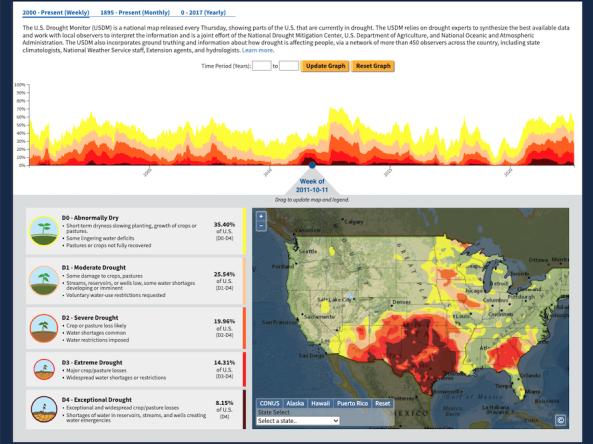
By looking back at historical data, communities can get a better understanding of the drought and extreme weather threats to be prepared for. The U.S. Drought Portal's Historical Data & Conditions Tool displays three historical drought datasets side by side on an interactive time series graph and map: U.S. Drought Monitor (2000 - Present), Standardized Precipitation Index (1895 - Present), and Palmer Modified Drought Index (0 BCE - 2017). These data are available for download in CSV, XML, and JSON format.
Users can view national data or select a state, county, or combination of states/counties to view a customized map and time series for each of these three historical drought datasets.
In addition to downloading these data as a CSV, XML, or JSON file, users can also download a high-quality image of the map/data panel, save a permalink to a specific dataset and time period, or embed the interactive tool directly on their own website.
Datasets
US Drought Monitor (USDM files) | 2000 - Present
The U.S. Drought Monitor (USDM) is released every Thursday, showing parts of the U.S. that are currently in drought. The USDM relies on drought experts to synthesize the best available data and work with local observers to interpret the information and is a joint effort of the National Drought Mitigation Center, U.S. Department of Agriculture, National Oceanic and Atmospheric Administration, and National Aeronautics and Space Administration.
More information on the U.S. Drought Monitor data
Standardized Precipitation Index (SPI files) | 1895 - Present
The Standardized Precipitation Index (SPI) is an index to characterize meteorological drought on a range of timescales, ranging from 1 to 72 months, for the lower 48 U.S. states. The SPI is the number of standard deviations that observed cumulative precipitation deviates from the climatological average.
More information on the Standardized Precipitation Index data
Palmer Modified Drought Index (PALEO files) | 0 BCE - 2017
Tree rings are used to extend the instrumental record of drought to over 2,000 years. The Living Blended Drought Product (LBDP) is a recalibrated data series of June-July-August Palmer Modified Drought Index (PMDI) values in the lower 48 U.S. states. This dataset blends tree-ring reconstructions and instrumental data to estimate the average summer PMDI values, which extend over 2,000 years in some parts of the U.S.
Formats
Comma-Separated Values (CSV/Excel)
The CSV files provide an option for importing data into a spreadsheet or database. Record values are provided on individual lines with an initial header row.
Extensible Markup Language (XML)
The XML files provide an option for importing data using a web service. Record values are provided within ordered tags.
JavaScript Object Notation (JSON)
The JSON files provide an option for importing data using a web applications and scripts. Records values are provided as properties of objects within an array.
Parameters
The definitions for the following parameters are common to each format, though each parameter may not be found in each format:
Area of Interest (AreaOfInterest) - USDM only
Area of Interest references the regions within the dataset to which the records are relevant. For example, 'conus' would indicate that the record is relevant to the Continental United States and 'total' would indicate that the record is relevant to the total United States.
Date (DATE) - PALEO and SPI only
Date references the year or month to which the records are relevant.
- PALEO files: This field is formatted
year_#, where#is a 1- to 4-digit year. - SPI files: This field is formatted
d_YYYYMMDD, whereYYYYis a 4-digit year,MMis a two-digit month, andDDis a two-digit day (typically 01 to represent the start of the month).
Drought Categories (D0, D1, D2, D3, D4, W0, W1, W2, W3, W4, 0, -9, None)
Drought Categories are typically based on percentile statistics, where the percentile indicates percentage of measurements under the given value. For example, a one month precipitation total in the 5th percentile indicates that only 5% of all available one month precipitation totals are lower than the observed month. Values provided indicate the percent of the given area that falls within the designated category.
- D4 - Exceptional Drought (0-2 percentile)
- D3 - Extreme Drought (2-5 percentile)
- D2 - Severe Drought (5-10 percentile)
- D1 - Moderate Drought (10-20 percentile)
- D0 - Abnormally Dry (20-30 percentile)
- None or 0 - Neither Wet or Dry
- W0 - Abnormally Wet (70-80 percentile)
- W1 - Moderate Wet (80-90 percentile)
- W2 - Severe Wet (90-95 percentile)
- W3 - Extreme Wet (95-98 percentile)
- W4 - Exceptional Wet (98-100 percentile)
- -9 - No Data Available
Note: These categories are inherently cumulative, so an area reporting 25% in D4 must also show 25% or greater in D3.
Map Date (MapDate)
Map Date provides the Valid Start in ISO 8601 format YYYYMMDD, where YYYY is a 4-digit year, MM is a two-digit month, and DD is a two-digit day.
Statistic Format (StatisticFormatID)
Statistic Format indicates whether categorical statistics were used in the data. The standard value is 1 and indicates that cumulative statistics were used. Cumulative statistics show the percent area in a given drought category or worse (for example, D1 shows the percent area in D1–D4; D2 shows the percent area in D2–D4).
Valid Start (ValidStart)
Valid Start references the first day of the period for which the record is valid. This is provided in the format mm/dd/YYYY, where mm is a 1- to 2-digit month, dd is a 1- to 2-digit day, and YYYY is a 4-digit year.
Valid End (ValidEnd)
Valid End references the last day of the period through which the record is valid. This is provided in the format mm/dd/YYYY, where mm is a 1- to 2-digit month, dd is a 1- to 2-digit day, and YYYY is a 4-digit year.
Metadata
View metadata for each of the three historical datasets in this tool:
- U.S. Drought Monitor
- Standardized Precipitation Index from nClimGrid-Monthly
- Palmer Modified Drought Index from the Living Blended Drought Atlas
Download Data
Download data for all three datasets for a region(s) of interest (national, state, county, or a custom region of combined states/counties) through the Historical Data & Conditions tool. Data are available in CSV, XML, and JSON formats.