Living Blended Drought Atlas (LBDA) - Historical Drought Information
National Oceanic and Atmospheric Administration (NOAA) National Centers for Environmental Information (NCEI)
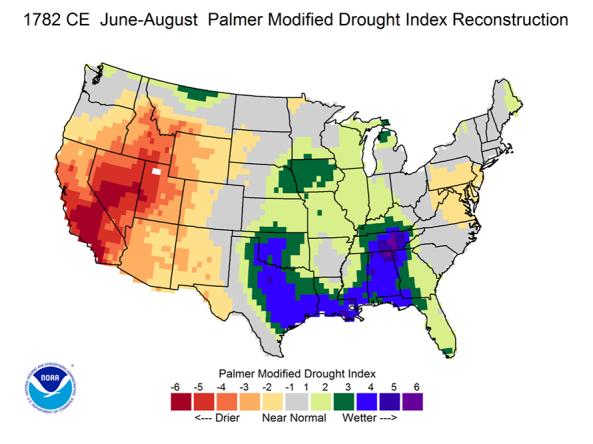
The Living Blended Drought Atlas (LBDA) is a recalibrated data series of June-July-August Palmer Modified Drought Index (PMDI) values on a 0.5 degree latitude/longitude grid, compiled by blending tree-ring reconstructions and instrumental data from the coterminous United States.
The Palmer Modified Drought Index (PMDI) is a hydroclimate index that employs temperature and precipitation information, as an operational version of the Palmer Drought Severity Index, to estimate relative dryness taking into consideration the cumulative nature of long-term drought. The Living Blended Drought Atlas uses tree-ring PMDI reconstructions to extend the instrumental record, yielding a record of drought distribution and intensity covering over 2,000 years. Tree-ring data were used up until 1978 AD, with instrumental data spliced in after that point. The reconstructed tree-ring values were recalibrated to instrumental conditions using a June-July-August PMDI derived from the GHCN 5km nClimGrid dataset. The recalibration was done using the Kernal Density Distribution Method (KDDM) outlined by McGinnis et al. (2015). When looking at PMDI values, increasing drought intensity is represented by increasingly negative numbers.
Where do these data come from?
Pre-instrumental values were taken from the Cook et al. (2010) Living Blended Drought Atlas (LBDA) summer PMDI values reconstructed on a 0.5 grid over North America. This reconstruction used 1,845 annual tree-ring chronologies to reconstruct past conditions. The regression procedures outlined in Cook et al. (1999) were used to develop the summer PMDI values from the tree ring network. The instrumental data are comprised of thousands of quality-controlled station values that go into the GHCN monthly temperature and precipitation data.
Access
- NOAA/NCEI Paleoclimate: Information on this study
- Data Folder: Collection of Annual U.S. PMDI maps
- netCDF File: All PMDI Data in netCDF3 format
- netCDF File: GHCN 5km PMDI used for recalibration and instrumental years
- NOAA Template File: Data in column format - each row contains a PMDI data point (large file)
- NOAA Template File: Study Description and Metadata Only
- Text Data File: Data in column format - each row contains one year of data
- Drought.gov Historical Time Series Tool: View Living Blended Drought Atlas data on an interactive time series and map, compare to other historical drought datasets, and download data as a CSV, JSON, or XML file. Learn more about this tool.
- Collection Metadata (DOI)
Documentation
The half degree gridded Jun-Aug PMDI reconstructions from Cook et al. (2010) were recalibrated using the Global Historical Climatology Network (GHCN) 5km grid PMDI data. The 5km data were first upscaled to match the original half-degree grid. The recalibration was performed using a kernel density distribution mapping (KDDM) technique outlined in McGinnis et al. (2015) using an R-package provided by Seth McGinnis. We used a 50-year recalibration period covering 1929-1978 CE. We also adjusted each grid point's mean PMDI value for the recalibration period to be zero to avoid importing wet or dry bias into the recalibration. The recalibrated data set covers the continental United States just as the GHCN instrumental data does. Since instrumental data was used for 1979–2005 CE in the Cook dataset, recalibration applied only to the years 0–1978 CE. The 1979-2017 instrumental years were filled in using data from NCEI's GHCN 5km instrumental PMDI data.
Additional documentation is available from the NCEI Paleoclimate Study page for the this dataset.