Updated 9/5: Summer 2025 Drought and Wildfire in 10 Maps
This story was updated on Friday, September 5, 2025.
From the destructive Dragon Bravo Fire in the Grand Canyon to smokey skies in the Northeast due to Canadian wildfires, discover how drought and fire are impacting the U.S. this summer.
Drought and wildfire interact in numerous ways. Many of the conditions that cause worsening drought can increase wildfire potential. Temperature, soil moisture, humidity, wind speed, and fuel availability (vegetation) are all factors that interact to influence the frequency of large wildfires. When fire sparks in an area that is in drought, drought can affect the intensity and severity of the fire. For example, rapidly drying abundant fuels in forest understories and grasslands after a wet spring can feed larger fires.
This summer, hot and dry conditions are driving large wildfires in the Western U.S. Check out the 10 maps below to better understand the conditions underlying current large fires and what’s forecast for fire and drought in the coming months.
Current Conditions
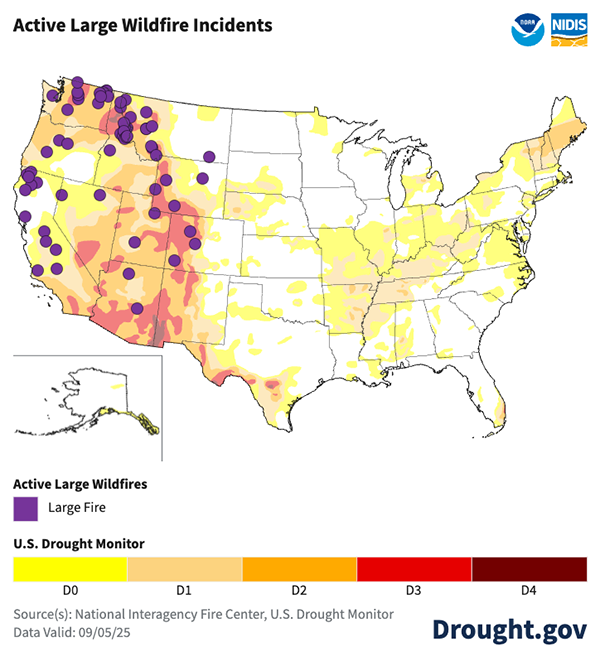
Large Fires Burning in the West
Large wildfires are burning in the Western U.S. Many of these areas are also in drought, according to the U.S. Drought Monitor. The largest partially contained (under 90% containment ) firesare currently the Dragon Bravo Fire (145,504 acres, 80% containment) burning in Grand Canyon National Park in Arizona, the Cottonwood Peak Fire (132,604 acres, 86% containment) in northern Nevada, and the Red Canyon Fire (124,709 acres, 80% containment) in central Wyoming, according to InciWeb.
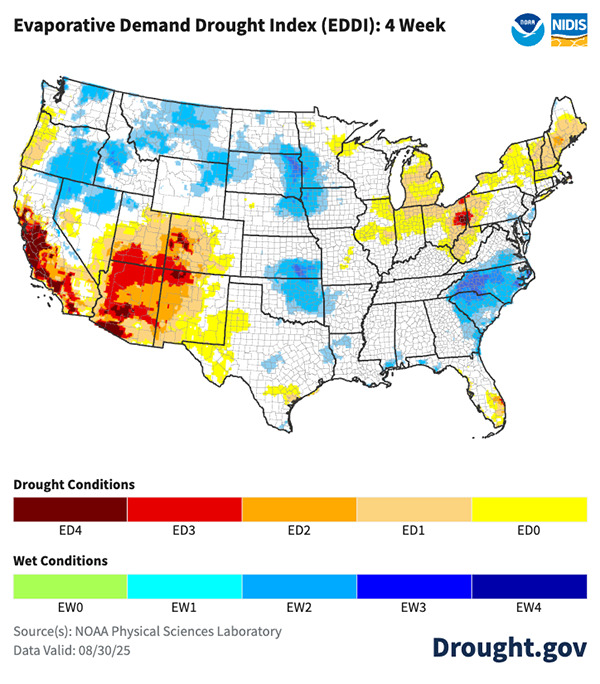
Dry Conditions in Parts of the West, Upper Midwest, and Northeast
Evaporative demand is a measure of the potential loss of water from the land surface due to atmospheric factors. Periods of high evaporative demand are connected to droughts and increased fire danger. Over the last month, the Evaporative Demand Drought Index (EDDI) showed evaporative demand was high along the West Coast, Southwest, Upper Midwest, Northeast, and South Florida.
Above-normal temperatures, clear skies, high wind speeds, and low humidity increase evaporative demand, which leads to quicker drying at the surface. Reduced soil moisture leaves less water available for plants. When extended periods of low precipitation overlap with extended periods of high evaporative demand, vegetation can become critically dry and support rapidly spreading wildfires.
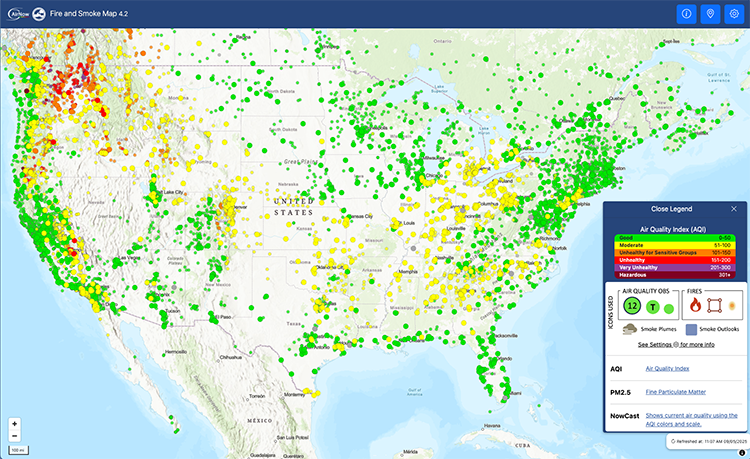
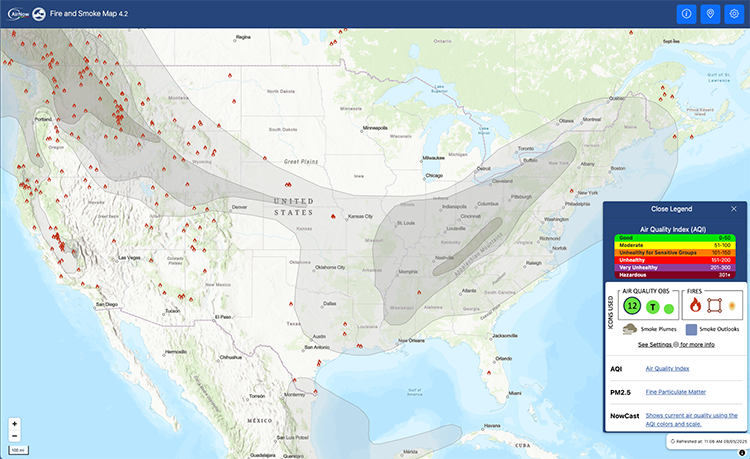
Smoke Reducing Air Quality Across the U.S.
Wildfire smoke can negatively impact air quality and harm human health. A number of large wildfires are burning in the Canadian provinces of Manitoba and Saskatchewan. The Pacific Northwest, portions of the central U.S., and much of the eastern U.S. is currently exposed to wildfire smoke, as smoke from these and wildfires in the West is drifting across the Nation. Air quality poor in the Pacific Northwest and portions of California, and air quality is moderate in most other smokey areas in the Nation.
The U.S. Air Quality Index (AQI) is designed to communicate whether air quality is healthy or unhealthy. When air quality reaches unhealthy levels in your area, the Centers for Disease Control and Prevention recommend keeping outdoor activities light and short and heading indoors to cleaner air if you experience symptoms. Groups sensitive to air pollution should avoid the outdoors all together.
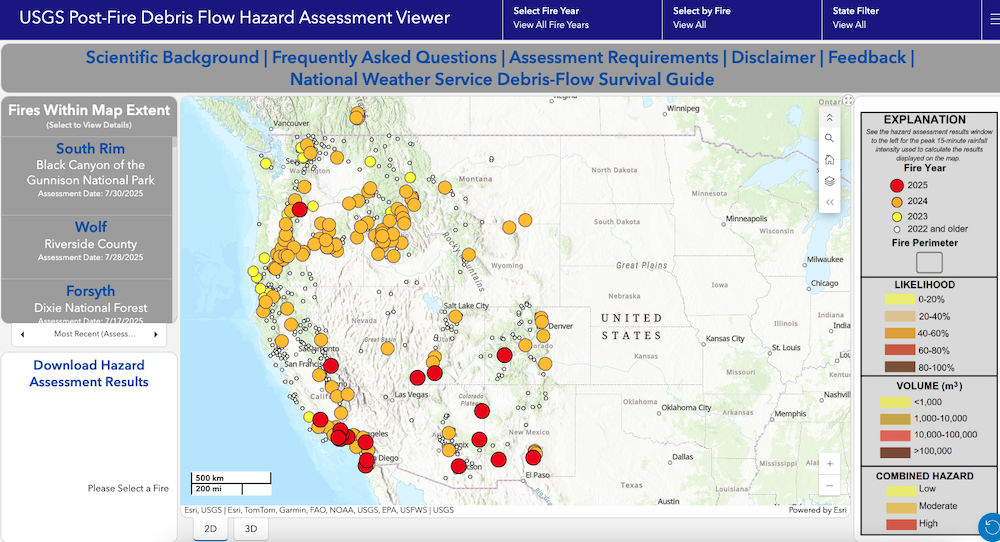
Elevated Risk of Post-Fire Debris Flows in Parts of the West
Fires create danger after the burn, too. After a wildfire, communities and watersheds may face dangerous debris flows. Post-fire debris flows can occur in the years immediately after wildfires in response to high-intensity rainfall events. These debris flows are a danger to human life. They can occur with little warning and can carry enough force to damage structures, strip vegetation, and block drainage ways. Fires also alter watersheds and can reduce available water supplies for communities due to water quality problems in burned areas.
The U.S. Geological Survey (USGS) Post-Fire Debris Flow Hazard Assessment Viewer allows users to view or download post-fire debris flow hazard assessment data. The points on the map show the burn area locations where the USGS conducted hazard assessments from 2025 and prior.
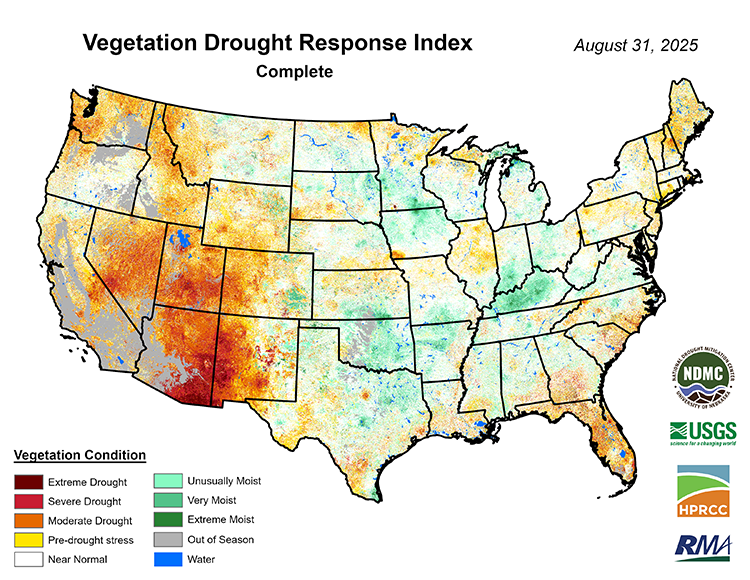
Dry Vegetation in the West, Midwest, and East Coast
Dry vegetation is one factor that influences how large and damaging a wildfire becomes. Currently, the Vegetation Drought Response Index, VegDRI, indicates there is dry plant matter across the Western U.S., in the Southeast, parts of the Midwest, and in the Northeast. This area of dryness in Arizona underlies the Dragon Bravo Fire burning in Grand Canyon National Park and surrounding areas.
Looking Ahead
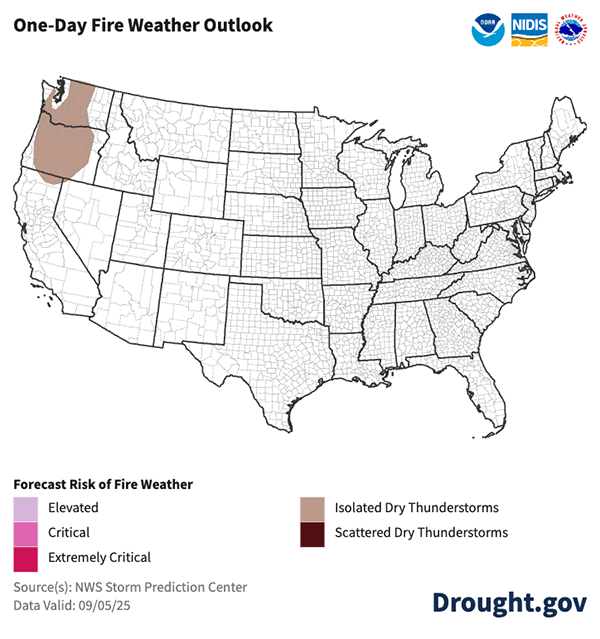
Fire Weather Tomorrow in Parts of the West
Isolated dry thunderstorms are forecast in the Pacific Northwest tomorrow.
The National Weather Service's Storm Prediction Center produces daily fire weather outlooks, which delineate areas of the continental U.S. where pre-existing fuel conditions, combined with forecast weather conditions, will result in a significant threat for the ignition and/or spread of wildfires.
Potential for Large Fires Continues in the West, New England, and Hawaii in September
Above-normal risk of significant wildland fires is forecast in Hawaii, the Pacific Northwest, portions of California and Nevada, and New England this month, according to the National Interagency Fire Center (NIFC). In October, this risk continues in Hawaii and portions of California and Appalachia.
Above-normal significant wildland fire potential indicates a greater than usual likelihood of significant fires, which are fires that require mobilization of resources from outside the fire event area.
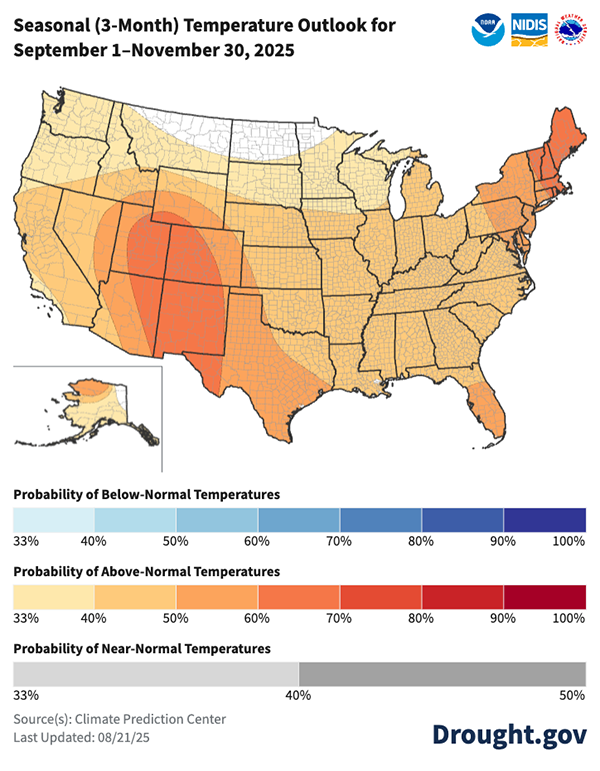
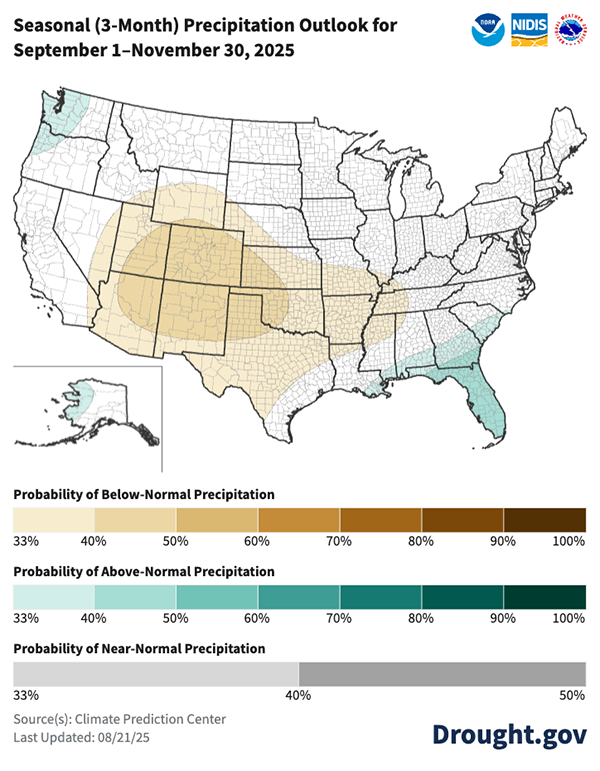
Seasonal Outlooks Favor Warm Conditions Across the Nation
Seasonal outlooks favor conditions conducive for wildfire in the Southwest and Southern Plains. Much of the Lower 48 and Alaska are favored to see above-normal temperatures over the next three months. The Southwest and New England have the greatest odds of above-normal temperatures. Portions of the Southwest, Central Rocky Mountains, and Southern Plains into the Mississippi River Basin lean dry over the next three months.
NOAA’s Next-Generation Fire System
NOAA is applying artificial intelligence to automatically detect fires in its Next-Generation Fire System, which is being integrated into firefighting operations across the Nation.
NOAA is also hosting a webinar series, “NOAA Fire Research: from Conditions to Impacts,” which showcases fire research activities and their impact on science and services to safeguard American lives and property. View upcoming webinars and recordings of past events.
Keep Up With the Latest Conditions and Outlooks
Find maps, publicly accessible data, and recent research about drought and wildfire on drought.gov. You can also subscribe to NIDIS emails for the latest regional drought updates, webinars, and news in our drought early warning system regions. To stay up to date on the latest drought conditions, sign up to receive drought alerts for your city/zip code when the National Weather Service updates their U.S. Drought Outlooks.