An Innovative Approach to Communicate Soil Moisture in the Upper Missouri River Basin
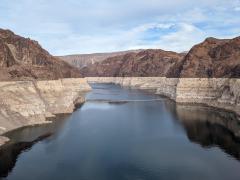
When it comes to managing water, there’s a “Goldilocks problem”: runoff frequently delivers far too much or far too little water to the landscape. In the Upper Missouri River Basin (UMRB), catastrophic floods and droughts between 2011 and 2021 highlighted the need for more and better water information to deliver earlier warnings and respond to extremes from both sides of the water supply spectrum.
To address this data need, the Infrastructure Investment and Jobs Act funded three complementary projects in the UMRB focused on improved monitoring, data acquisition, and data application. This included (1) the buildout of hundreds of new mesonet stations across the basin, led by the U.S. Army Corps of Engineers; (2) a data acquisition and use pilot led by the National Weather Service National Mesonet Program; and (3) the UMRB Data Value Study, led by NOAA’s National Integrated Drought Information System (NIDIS), to evaluate how these data can support improvements to water resource models, drought monitoring capabilities, and other applications. Taken together, these projects are a multi-agency collaboration to fill regional gaps in water monitoring, with an emphasis on soil moisture and snowpack.
Overcoming the Challenge of Short Records
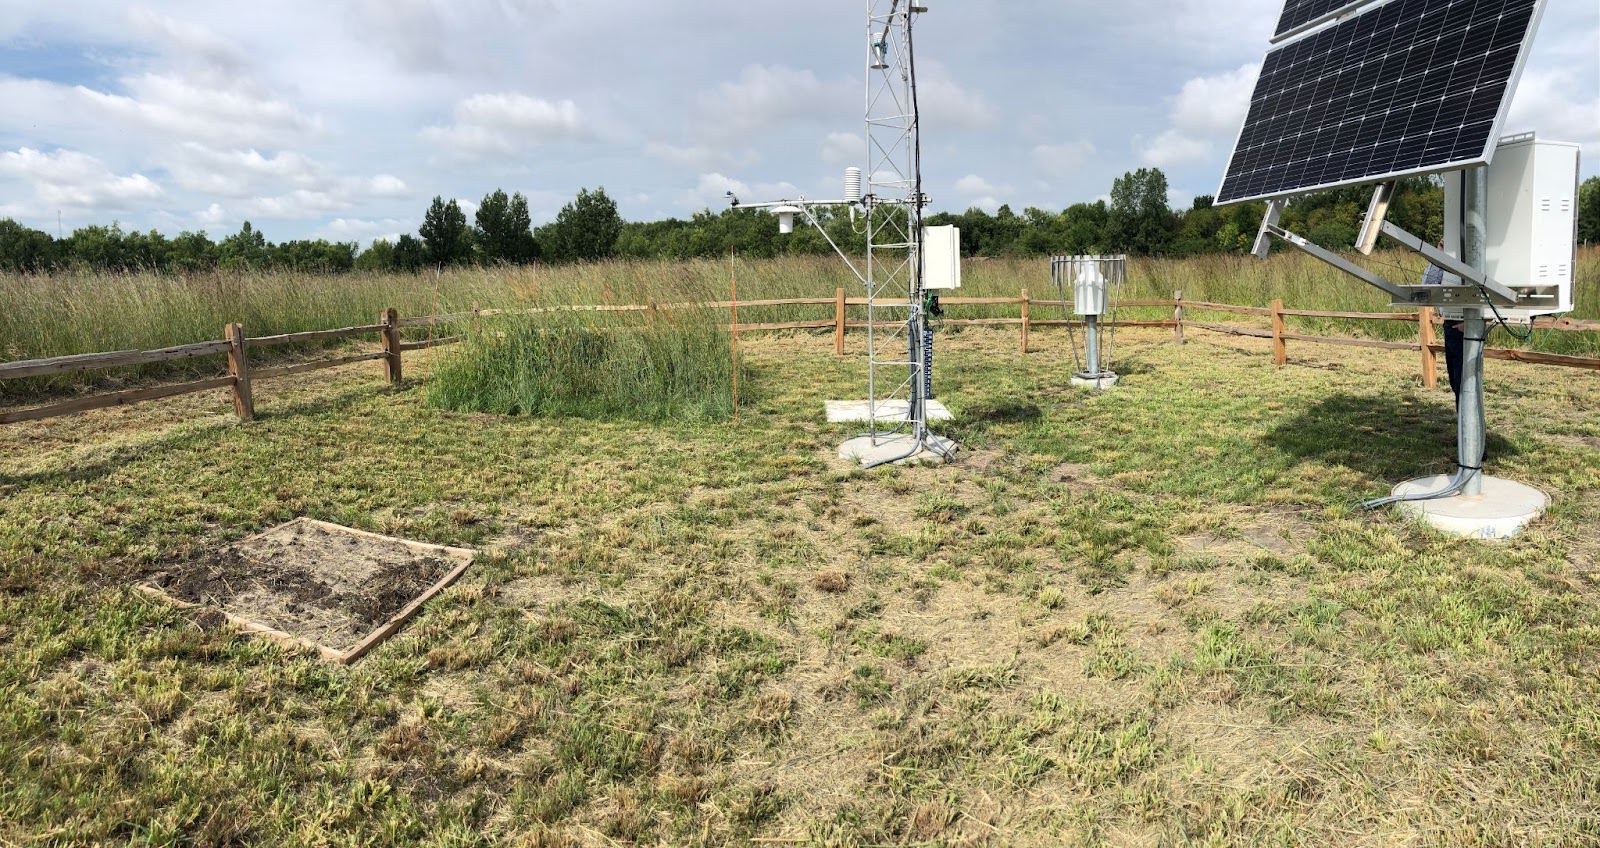
By the start of 2025, the U.S. Army Corps of Engineers had partnered with state mesonets, the U.S. Department of Agriculture’s Natural Resources Conservation Service, and land-owners to establish 259 of 540 planned stations across Montana, Nebraska, North Dakota, South Dakota, Wyoming, and Tribal Nations. Many more installations are in progress this summer. Data acquisition is already underway via the National Weather Service. As stations come online, the next step in realizing the value of the network is turning data into decisions.
But there is a challenge: Monitoring drought typically involves looking at hydrological indicators, such as soil moisture and snowpack, through the lens of historical conditions for a given location. Soil moisture and snowpack data are frequently communicated in percentiles, which compare current conditions to how frequently similar conditions occurred in the past. However, percentiles rely on periods of record of decades or more. The new UMRB stations are only a few years old, and new stations are still being built.
So, how do you translate station data in a relevant context when the period of collection is still so new?
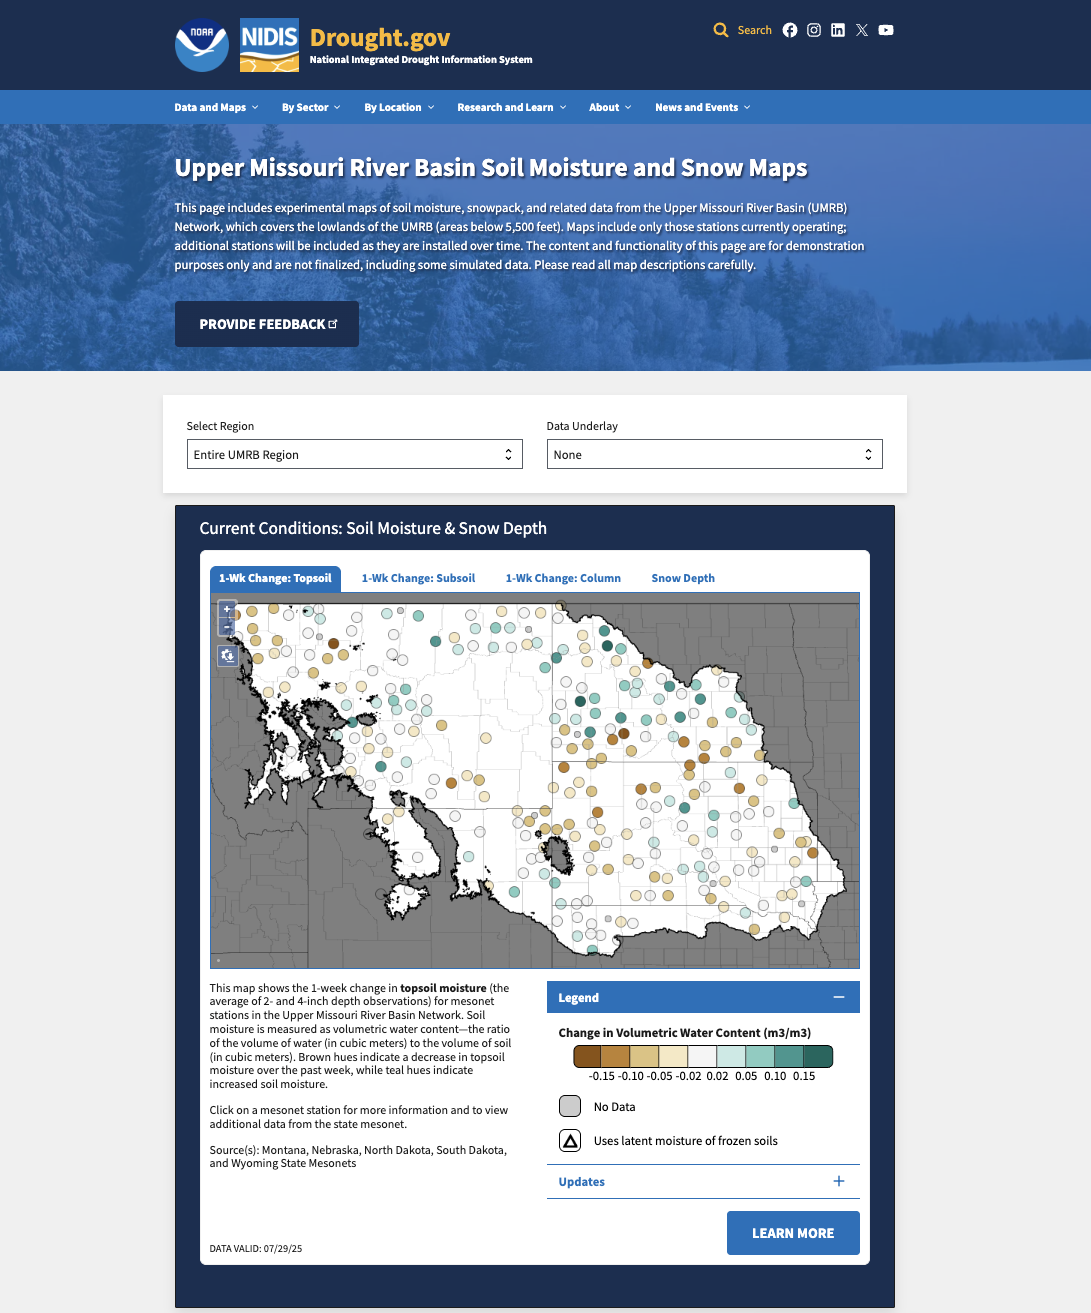
The Upper Missouri River Basin Soil Moisture and Snow Maps dashboard demonstrates an approach for communicating soil moisture and snowpack data when only short periods of record are available. This experimental tool was developed by NOAA’s National Centers for Environmental Information (NCEI), South Dakota State University, the Cooperative Institute for Satellite Earth System Studies (CISESS), and NOAA/NIDIS as part of the NIDIS-led UMRB Data Value Study.
“Our farmers and ranchers in South Dakota were looking for a way to see and use the data that is being collected by the SD Mesonet,” said Laura Edwards, South Dakota State University (SDSU) Extension State Climatologist. “This online mapping project is an easy way to see changes in soil moisture, especially during the growing season when it matters most to these data users.”
The UMRB maps were developed to make near-term data accessible and meaningful to multiple user groups, including the U.S. Drought Monitor authors and the broader drought monitoring community. The goal was to overcome the challenge of shorter periods of record by putting snow and soil conditions into context.
"We want to use soil moisture for agriculture and drought, but we can’t wait thirty years to utilize this data,” explained Ronald Leeper, of the Cooperative Institute for Satellite Earth System Studies and NOAA/NCEI, who led mapping product development. “This tool leverages short-term networks and provides a more direct measure for understanding what’s happening to plants."
To learn more, register for a webinar about these experimental UMRB Soil Moisture and Snowpack Maps on Tuesday, August 12 at 12 p.m. ET. You can also learn about the data and methodology behind the dashboard on Drought.gov.
An Experimental Dashboard for Soil Moisture and Snowpack Monitoring
The research team ingested soil moisture and snowpack station data from state mesonets through Synoptic Data, a data platform and repository. The data were then used to calculate metrics now displayed on interactive maps on Drought.gov, which update weekly on Tuesdays.
To ensure the resource would meet user needs, the team conducted targeted outreach and hosted listening sessions to gather feedback from soil scientists, as well as agricultural extension, water, and drought specialists. The team also had early conversations with U.S. Drought Monitor authors to inform requirements.
In response to this feedback, the project team designed an interactive online dashboard that would allow users to view station data for different geographic regions and dig deeper to access more information. Users can select a region from a dropdown menu, which will zoom all the maps on the page to a particular state, tribal land areas, or the entire UMRB region. Users can display the current U.S. Drought Monitor, gridded snow depth, or gridded snow water equivalent (SWE) data underneath the station data. And clicking on any point on the maps will display a popup with more information. The team also set up an automated process to send a CSV file to the U.S. Drought Monitor authors every Tuesday to make it easier for the authors to integrate these new data into their workflow.
This process was an ambitious lift: it required bringing together data from five different state mesonets, including metadata; generating field capacity and wilting points based on soil types for each station; and translating all of this information into relevant visualizations on a timely basis.
The team addressed the challenge of generating contextually meaningful soil moisture maps by creating three different products to put data in context: soil moisture change over time, fractional available water (FAW), and categorized soil moisture conditions.
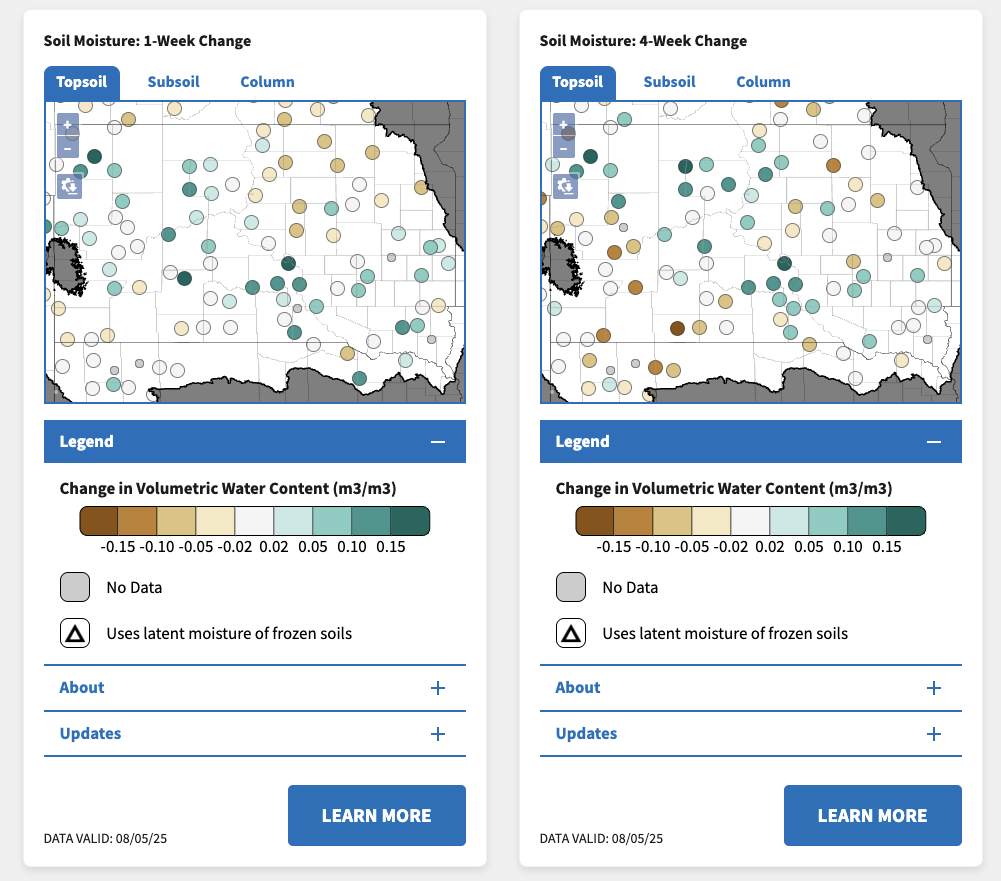
View Trends with Soil Moisture Change Maps
Soil moisture change maps display the change in volumetric water content (i.e., the percent volume of water per volume of soil) over the past 1-, 4-, 8-, and 12-week periods. These maps allow users to see important trends in evolving conditions for three soil layers: topsoil (an average of 2-inch and 4-inch depths), subsoil (8-inch and 20-inch depths), and total column. Although some drying or wetting events are a regular seasonal occurrence, unseasonal or unusually rapid declines in soil moisture can inform drought forecasting. Recent research indicates that soil moisture may be an important indicator of rapid onset drought, or flash drought.
What Does This Soil Moisture Mean for Plant Health? Fractional Available Water and Categorized Soil Moisture Maps
Integrating Soil Type
Another way to put soil moisture values in context is by integrating the soil type. This is important because raw soil moisture values can be misleading without the context of soil composition. Soil moisture is often measured in volumetric water content, but individual soil types hold water differently from one another. For example, plants may have a much harder time extracting water from a clay soil than a loam soil, even if both soils display the same volumetric water content on a reading from a sensor.
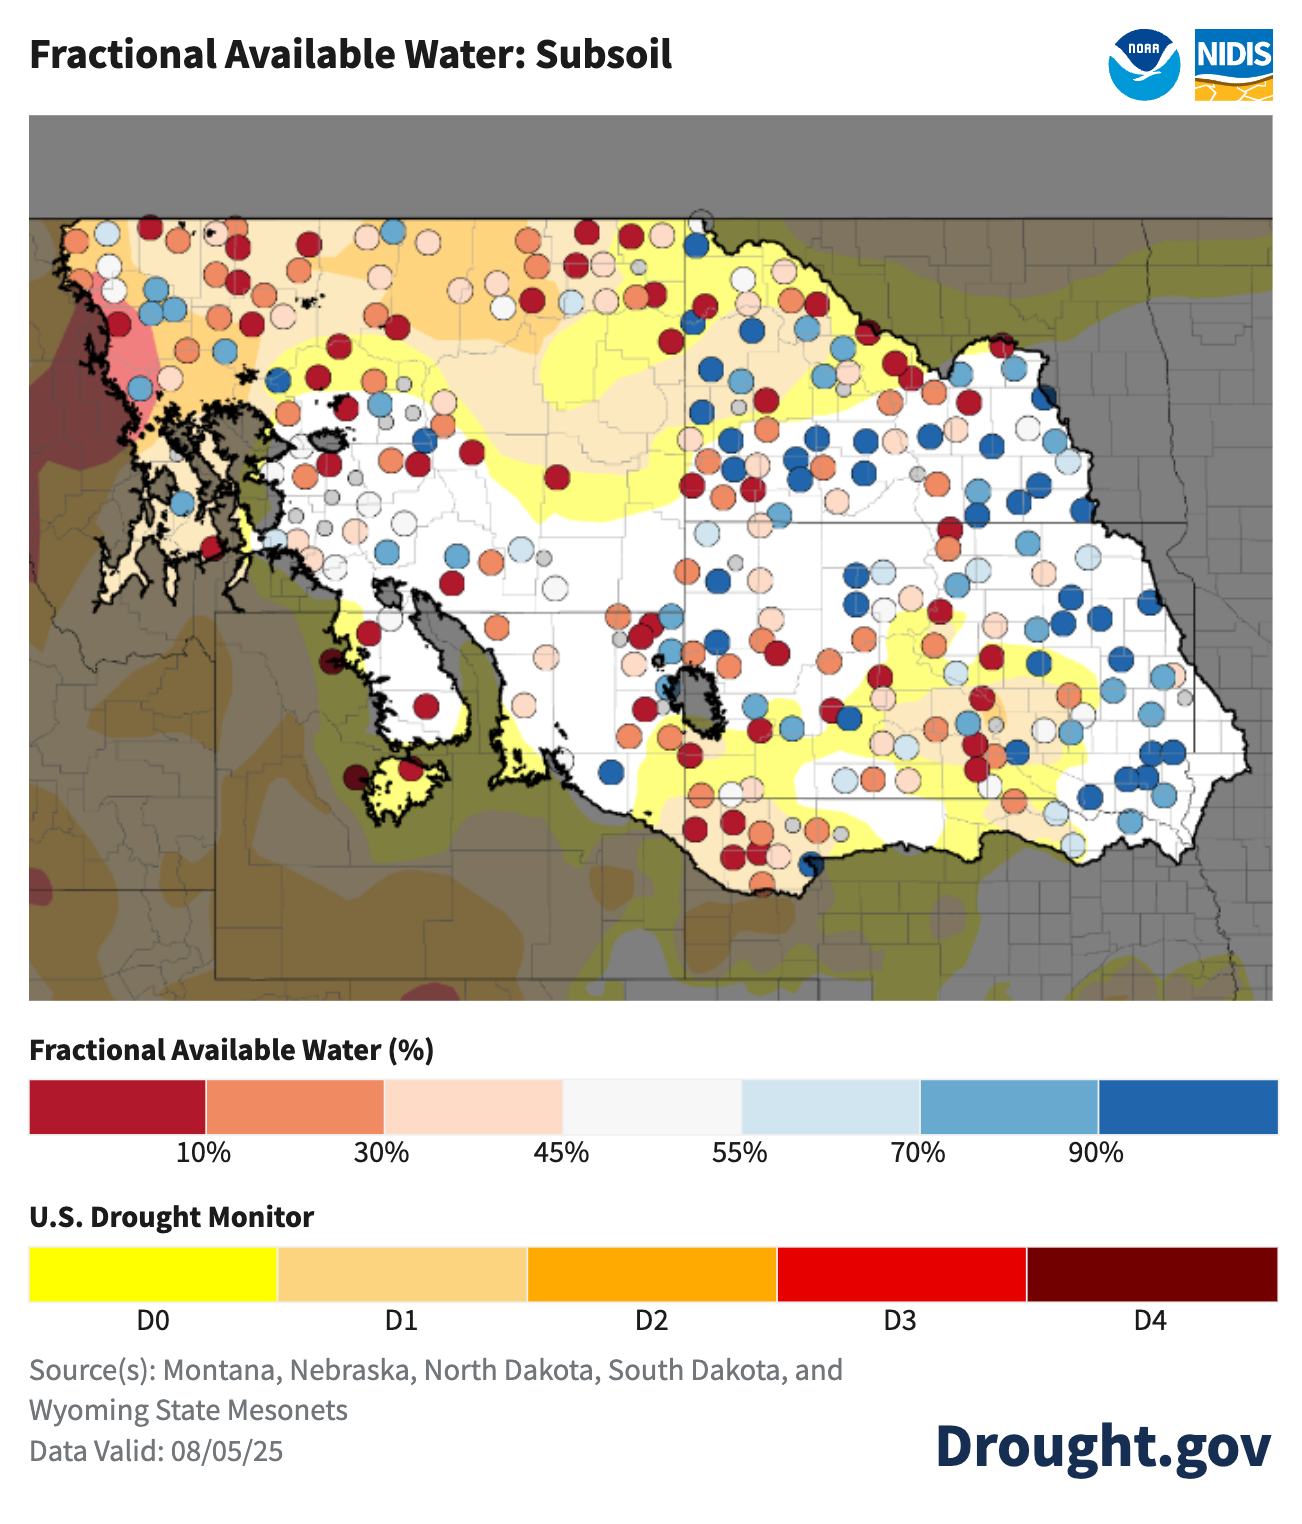
Fractional Available Water
Fractional available water (FAW) is a numeric description of soil moisture directly tied to how easy water is for plants to extract. On the dashboard, FAW is shown on a scale of 0%–100%, where 0% is the soil’s wilting point (the point where many plants struggle to extract water from the soil) and 100% is field capacity (the point where adding further water does not increase water available for plants to use). Because the wilting point and field capacity are determined by soil type, you can compare FAW values across stations—a value of 10% has the same meaning for plant health, no matter what soil type is present at the site.
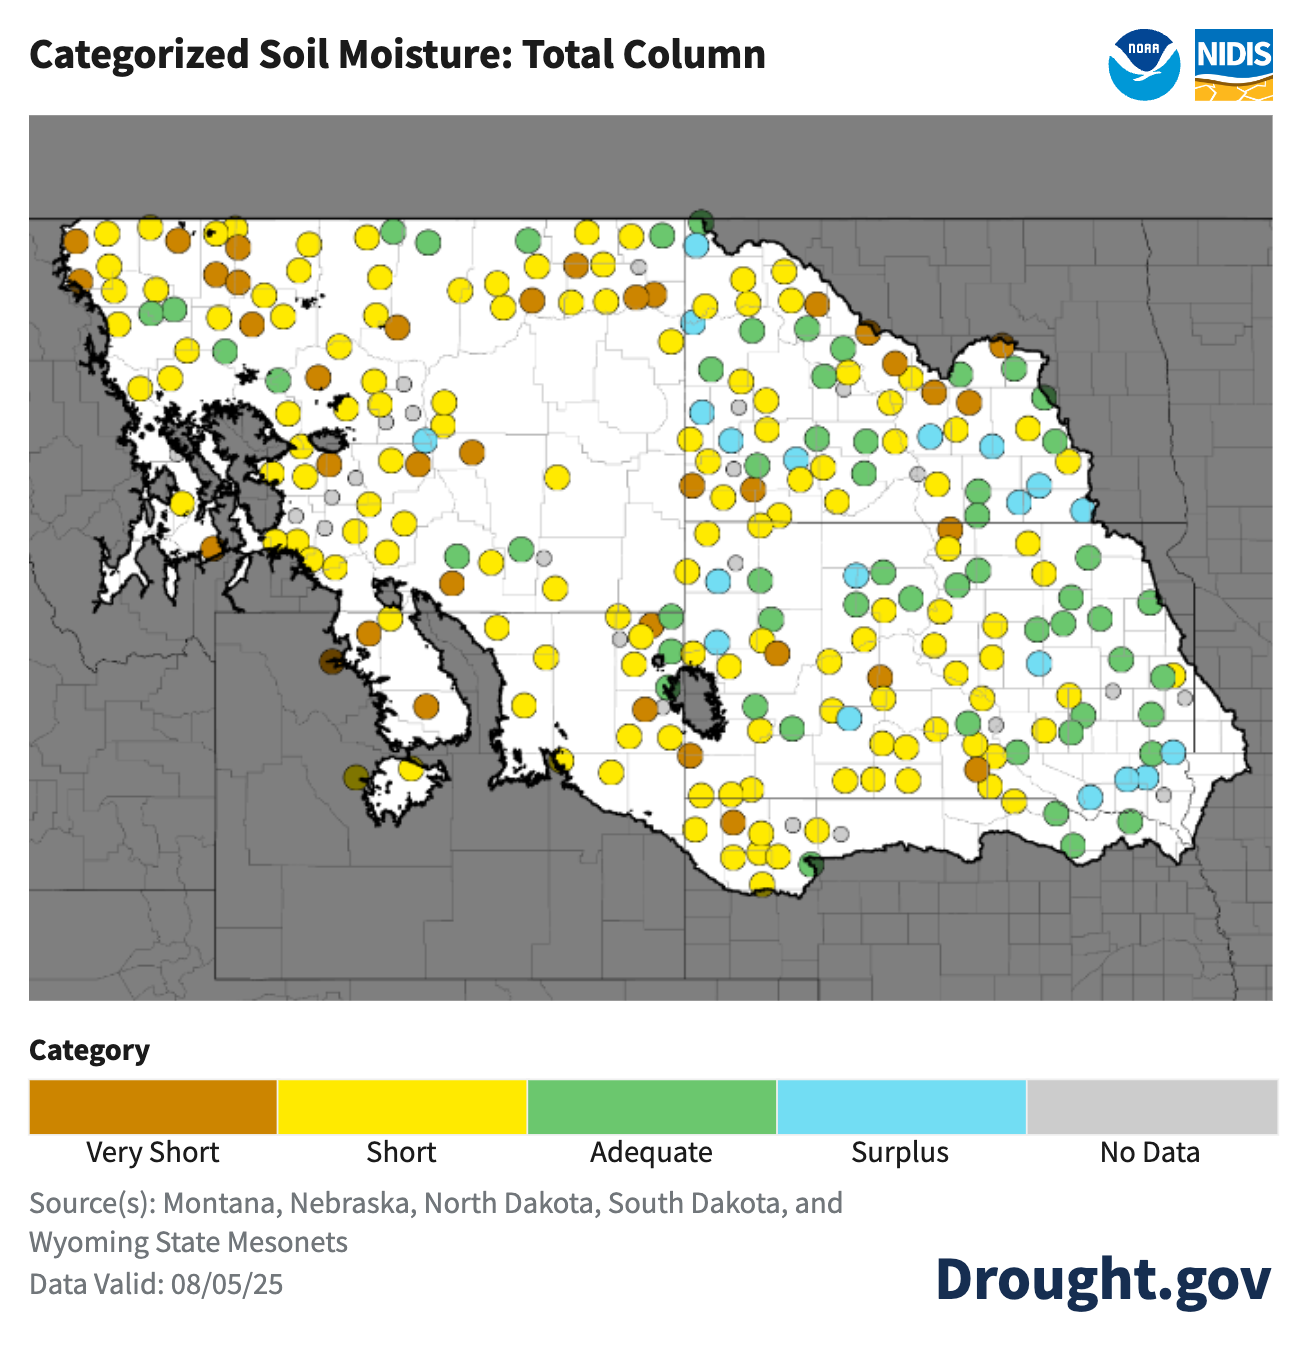
Categorized Soil Moisture
Categorized soil moisture also accounts for soil type. This map groups soil moisture into four categories based on thresholds of water accessibility that are similar to FAW. Categorized soil moisture, however, provides a qualitative measure of soil moisture conditions based on plant needs. “Short” and “very short” conditions indicate plant growth and development are water-limited—if more water were available, more growth or flourishing could take place. “Adequate” or “surplus” conditions indicate adding more water to the system would not increase plant growth—a different factor (like hot temperatures or lack of nutrients) is limiting productivity.
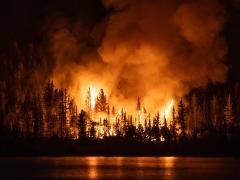
“By tying these metrics directly to plant impacts, this approach helps us see when we have the potential for wildfire fuel build-up over native vegetation or limited yields over agricultural fields,” said Leeper. “Seeing drying over agricultural lands can help us understand potential impacts on yields.”
The Role of Soil Type in Understanding Flooding and Drought
Both FAW and categorized soil moisture inherently account for soil type, so they do not rely on long periods of record to provide background information necessary for interpretation. Because of the metrics’ relationships to plant health, they could be used to help producers or land managers identify agricultural or ecological drought events or conditions during which plants may experience wilting or drying. Additionally, circumstances where FAW is at 100% ( soil is at field capacity for holding water) could be used alongside other variables as a potential indicator of flood risk.
Visualizing Snow Depth and Soil Frost and Thaw Depth
The UMRB Soil Moisture and Snowpack Maps Dashboard also features snowpack station data. An interactive map allows users to compare snow depth measurements with a visual snapshot of conditions. Clicking on a station opens a pop-up with a link to view daily photographs from the mesonet station.
The final component of the dashboard will be soil frost and thaw depth maps. These tools are still in development. The soil frost depth will indicate the greatest measured depth at which the ground is frozen, while the thaw depth map will indicate the greatest depth at which the ground is above freezing. During the spring season, as the soils warm from the top down, there may be times when shallow soils are thawed, but greater depths still have frost. Soil temperatures and frost/thaw maps can be used to support decision-making around construction or to characterize flood risk.
A Regional Tool and a Template for Other Regions
Each map on the dashboard offers a different lens to consider water on the landscape to support local decision-making and planning around droughts, floods, wildfires, and agriculture.
“The amount of data that is being collected by the mesonets in the UMRB is enormous. We needed to create new ways to visualize the data across a multi-state region that hasn’t been done anywhere else before,” said Edwards. “We are breaking new ground with the development of this online mapping platform.”
These new approaches to communicating soil moisture and snowpack conditions benefit the UMRB region by making data from new stations actionable and could provide a template for networks in other regions also seeking to convey soil moisture information from a limited data record.
For more information, visit the dashboard, or contact Elise Osenga (elise.osenga@noaa.gov).