




Logo

Site Section
Partner
Weather Prediction Center
An Agency/Organization of:
Related Data & Maps
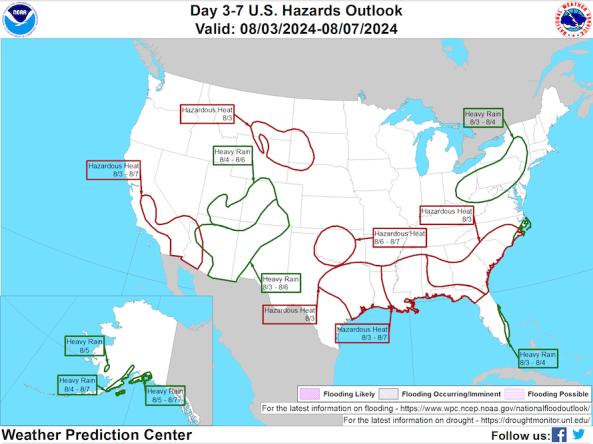
The National Weather Service Weather Prediction Center's Day 3–7 Hazards Outlook shows potential hazardous conditions related to precipitation/flooding, temperature, wildfire/winds, and soils/
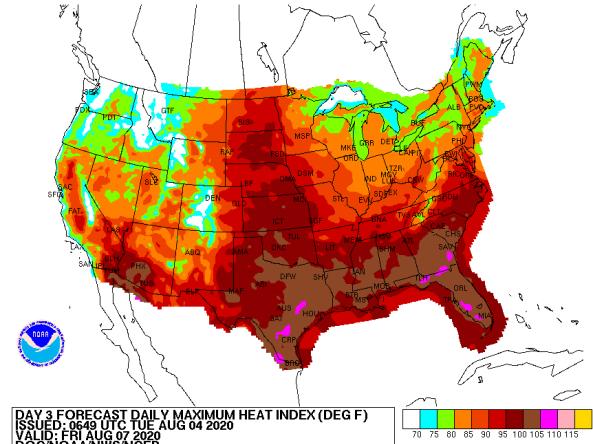
The National Weather Service (NWS) issues heat index forecasts for days 3–7, including daily maximum heat index, daily mean heat index, and daily minimum heat index forecasts.
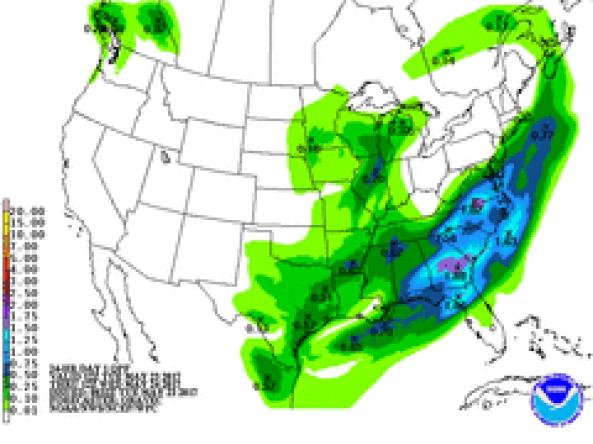
NWS WPC produces Quantitative Precipitation Forecasts (QPFs) that depict the amount of liquid precipitation expected to fall in a defined period of time.
Related News
Site Section
News & Events
From the catastrophic wildfires in Southern California to historic low-water levels on the Mississippi River and record-low streamflow in the Northeast, drought and its impacts touched nearly every corner of the country. The year saw the unusual return of two La Niña events and devastating weather whiplash that brought historic floods to drought-stricken Texas. 2025 showed us that drought is
Site Section
News & Events
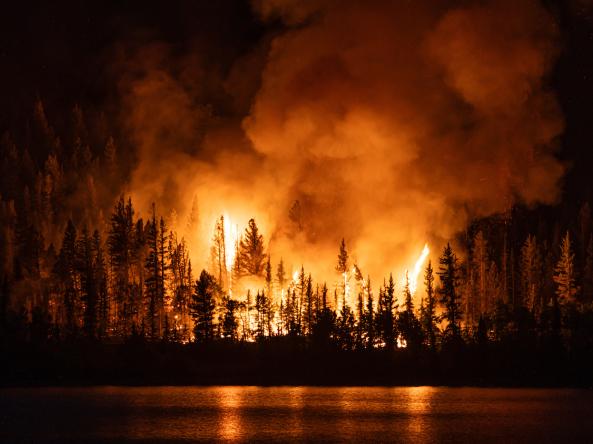
This story was updated on Friday, September 5, 2025. From the destructive Dragon Bravo Fire in the Grand Canyon to smokey skies in the Northeast due to Canadian wildfires, discover how drought and fire are impacting the U.S. this summer.Drought and wildfire interact in numerous ways. Many of the conditions that cause worsening drought can increase wildfire potential. Temperature, soil

Site Section
News & Events
New interactive maps on Drought.gov can help users better prepare for heat and drought in their communities, with data from NOAA’s National Weather Service. Drought.gov now displays customizable maps showing National Weather Service heat advisories, warnings, and watches, as well as 3–7 and 8–14 day heat hazard outlooks. These maps can be overlaid with the U.S. Drought Monitor to monitor areas