U.S. flag

An official website of the United States government

From the catastrophic wildfires in Southern California to historic low-water levels on the Mississippi River and record-low streamflow in the Northeast, drought and its impacts touched nearly every corner of the country. The year saw the unusual return of two La Niña events and devastating weather whiplash that brought historic floods to drought-stricken Texas. 2025 showed us that drought is even more devastating when compounded with other climate hazards, such as wildfire and flood. This list breaks down some significant drought-related events of 2025 that made 2025 a year of water extremes across the United States. 

Our thoughts are with those who lost loved ones, homes, and livelihoods in the Texas flooding and California wildfires. We hope for healing and comfort for those dealing with significant losses from these events.

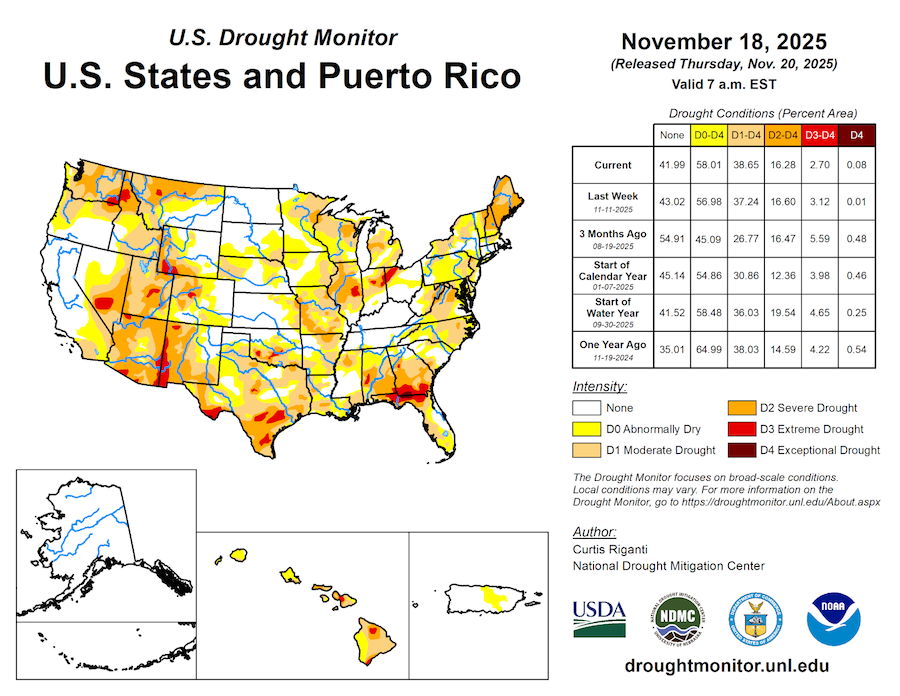
Most of the U.S. Experienced Some Drought Last Year

Much of the West started and ended 2025 in drought, according to the U.S. Drought Monitor. Drought impacted the Upper Missouri River Basin and Northeastern U.S. as winter turned into spring, just as Extreme and Exceptional Drought (D3-D4) emerged in Florida and the Southwest. By late summer, drought largely improved in the East, only to emerge again in force in the Northeast U.S. In fall, drought developed in the Midwest and Southeast, and expanded in the Southern Plains and West. New Year’s Eve found drought covering 35.8% of the Nation. 

An animated map of the United States showing the weekly progression of the U.S. Drought Monitor throughout 2025. Drought intensity, represented by yellow, orange, and red shades, is seen expanding and contracting across various regions, with significant intensity shown in the West, Southern Plains, and Northeast during the second half of the year.
U.S. Drought Monitor (USDM) conditions across the United States throughout 2025. This animation shows the evolution and intensity of drought from January to December 2025. The map uses five classifications: Abnormally Dry (D0), showing areas that may be going into or are coming out of drought, and four levels of drought (D1–D4). Source: National Drought Mitigation Center, NOAA, and USDA.

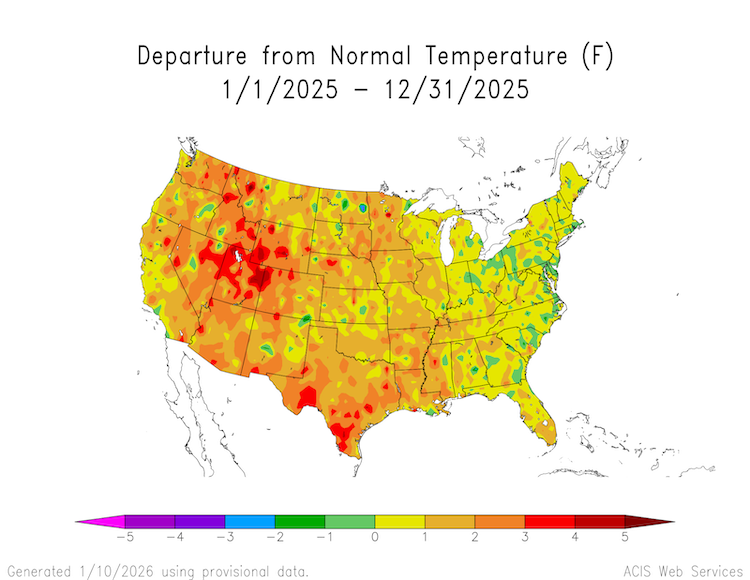
2025: A Warm Year Overall  

Across much of the U.S., 2025 was a warm year, with annual temperature averages of up to 5° Fahrenheit (F) above normal in most areas. The greatest departures were in the Great Basin, Northern Rockies, and along the southern border. A few spotty areas around the Nation were slightly cooler than normal in 2025, particularly east of the Mississippi River. 

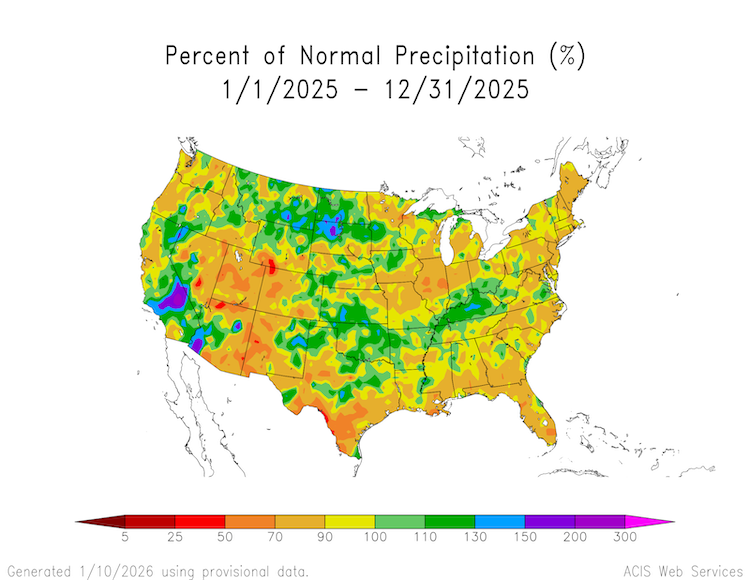
2025 brought a mix of precipitation to the U.S. The Pacific Northwest, Mountain West, Midwest, South, and Northeast were drier than normal. Conditions were particularly poor in the Mountain West and South Texas, where annual precipitation was 50-90% of normal. Southern California, the Dakotas, and southeastern Arizona were wetter than normal. 

A map of the United States showing annual temperature departures for 2025. Most of the country is shaded in orange and light red, indicating temperatures 2 to 5 degrees Fahrenheit above normal. The darkest red areas are concentrated in the Mountain West and along the U.S.-Mexico border, while scattered green patches in the East show areas with near- or slightly below-average temperatures.
Annual average temperature departure from normal across the U.S. in 2025. The map displays temperature averages compared to normal, with orange and red colors indicating above-normal temperatures. Cooler than normal areas are represented by shades of green. Data Source: High Plains Regional Climate Center
A map of the United States showing annual precipitation for 2025 as a percentage of normal. Much of the Pacific Northwest, Mountain West, Midwest, and Northeast are shaded in tan and brown, indicating precipitation levels between 50% and 90% of average. Southern California, the Northern Plains, and the Southwest received above-normal precipitation for the year.
This map displays annual precipitation totals compared to the 1991–2020 normal. Shades of orange and red indicate drier-than-normal conditions (0%–90% of normal). Areas in blue and green hues represent wetter-than-normal conditions. Source: High Plains Regional Climate Center.

2025 Roared in With L.A. Wildfires 

By early January 2025, vegetation in Southern California was already extremely dry due to lack of precipitation. The area had experienced its driest start to the water year (beginning October 1, 2024) in the 44-year record. These dry conditions allowed vegetation to cure into more flammable fuel. During the first two weeks of January, a strong Santa Ana wind event created critical fire weather conditions, spreading the deadly and destructive Palisades and Eaton fires, which consumed more than 38,000 acres and destroyed more than 16,000 structures in the Los Angeles metropolitan area. 

GIF of images showing the wildfire (using wild fire temperature) that developed in the Los Angeles area on January 8, 2025.
January 8, 2025 Los Angeles area GOES-WEST geocolor and fire temperature satellite imagery. Source: Cooperative Institute for Research in the Atmosphere (CIRA).

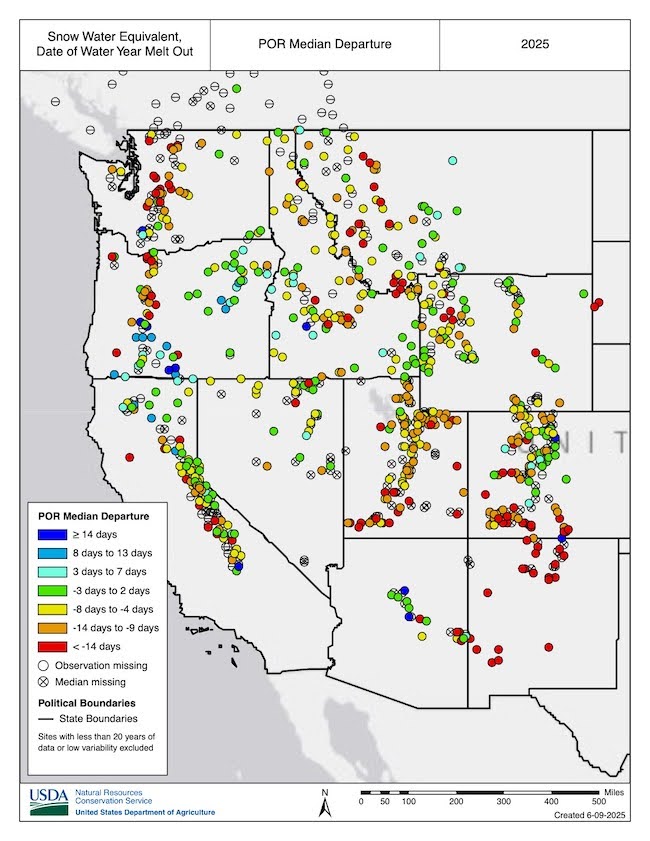
Heatwave Leads to Early Snowmelt, Runoff in Western U.S. 

In the West, about 70% of the water supply comes from snow stored in the mountains. Across the West, snow water equivalent on April 1, 2025 was near-normal in most northern watersheds and below normal in watersheds south of the Central Rockies. But April and May brought heatwaves to the mountains, melting snow out much earlier than normal. Rapid melt out occurred across Utah, Colorado, and New Mexico, pushing some basins from above-average snowpack to snow drought conditions in under a month, with snow disappearing 1-4 weeks early. 
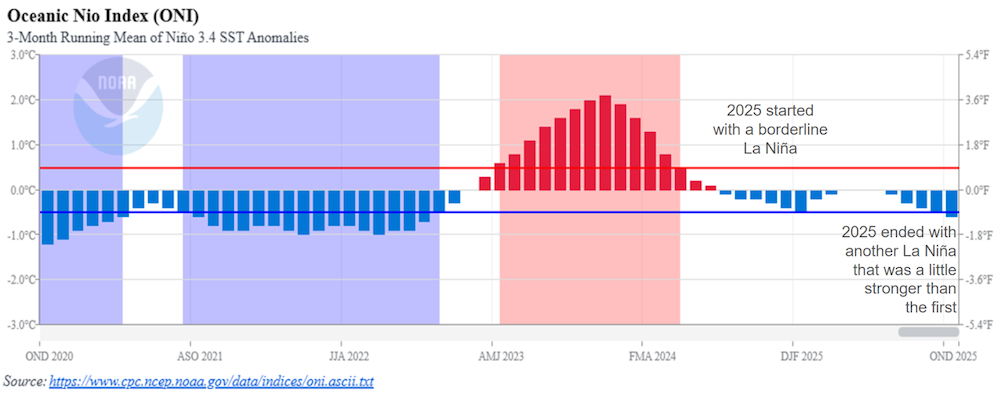
 Earlier than normal water year snowmelt occurred across the Western U.S.
Snow Telemetry (SNOTEL) snow water equivalent date of water year melt out for Water Year 2025 to date (October 1, 2024–present). Red dots show snow melt out 28 or more days earlier than median and blue dots show snow melt out 28 or more days later than median. Only stations with at least 20 years of data are used. Source: USDA Natural Resources Conservation Service (NRCS).For an interactive version of this map, please visit NRCS.

La Niña Double Dips 

2025 was shaped by two La Niña events. La Niña is one of two phases of the El Niño-Southern Oscillation. La Niña typically brings cool, wet winter conditions to the Northwest U.S., and warm, dry winter conditions to the Southern U.S. The first La Niña was a borderline event, which peaked around January 2025, and then waned by the end of spring. The second was a little stronger, but still considered weak compared to most historical La Niña events. It began developing around August and continues through winter 2025-26.

 A line graph depicting the Oceanic Niño Index (ONI) throughout 2025. The blue-shaded areas below the 0.5°C threshold indicate two separate La Niña events. The first dip is shown at the beginning of the year, followed by a brief return to neutral conditions in early summer, and a second, deeper dip beginning in late summer and continuing through the end of December, illustrating the "double dip" pattern mentioned in the text.
This graphic illustrates the fluctuations in the Oceanic Niño Index (ONI), an index used to monitor the El Niño-Southern Oscillation. Blue shades indicate La Niña, the cooler phase, while red shades indicate El Niño, the warmer phase. Source: NOAA Climate Prediction Center.

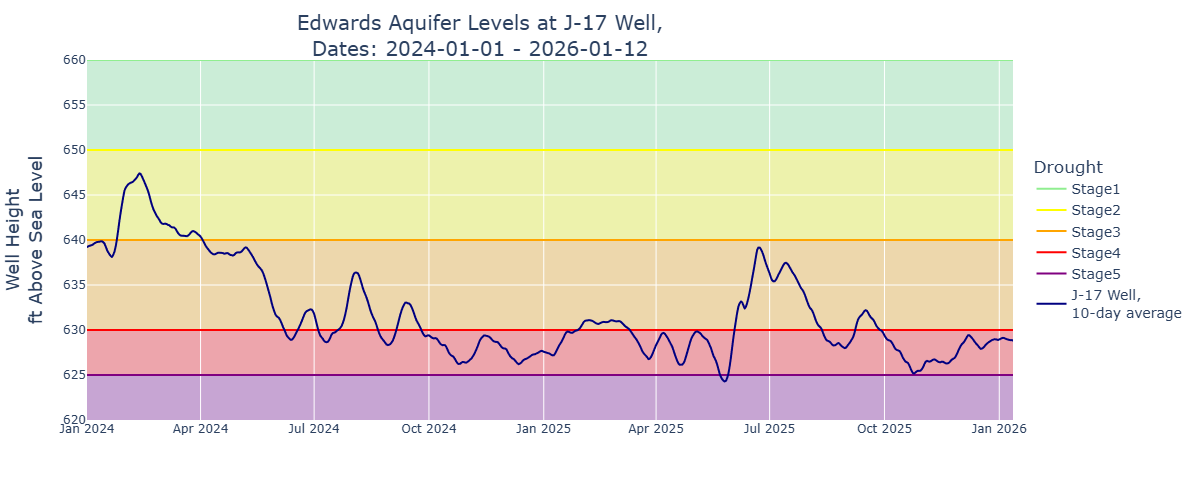
Texas’s Edwards Aquifer Also Double Dips 

In another double dip, the Edwards Aquifer, a critical groundwater supply for about 2.5 million people in Texas, twice fell to historic lows in 2025. The first dip occurred in May 2025, when a key monitoring well (J-17) fell below the threshold that triggers stage 5 water restrictions. This occurred as springs recharging the aquifer fell to a 10-day average of 53 cubic feet per second, 250 cubic feet per second below the historic average. After conditions improved in the summer, the aquifer again fell to near-record low conditions when dry conditions returned in November.

A line graph showing the daily groundwater elevation of the J-17 index well throughout 2025. The Y-axis measures feet above mean sea level, ranging from approximately 620 to 670 feet. The plotted line shows a steady decline through the summer months, remaining well below the various color-coded drought stage trigger lines (Stages 1–4) for the majority of the year, illustrating a deep and persistent groundwater deficit.
Groundwater levels at the Bexar County J-17 Index Well in 2025. This hydrograph tracks the water level of the J-17 well, which serves as an indicator well for the San Antonio Pool of the Edwards Aquifer. Throughout 2025, the aquifer level remained significantly below the historical average and frequently dropped below the 630-foot threshold, triggering Stage 4 critical period management. These sustained low levels reflect the severe lack of recharge in the Edwards Plateau during the 2025 drought. Source: Edwards Aquifer Authority.

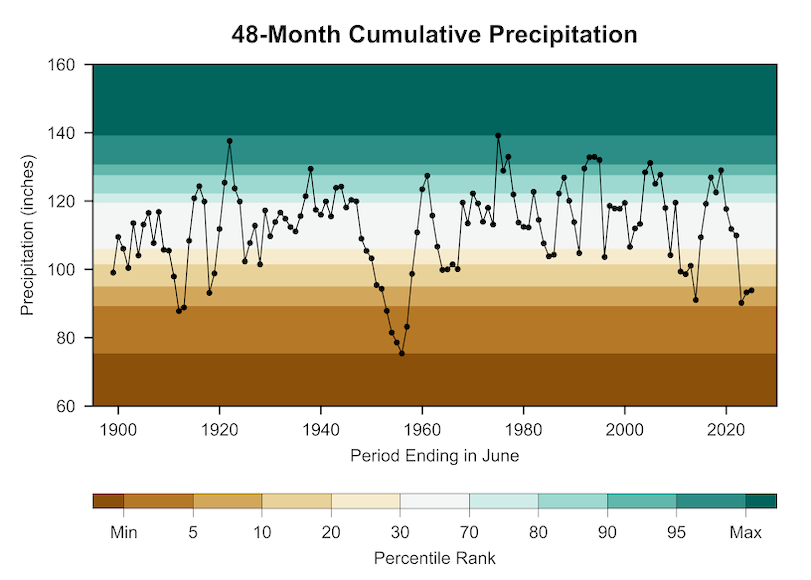
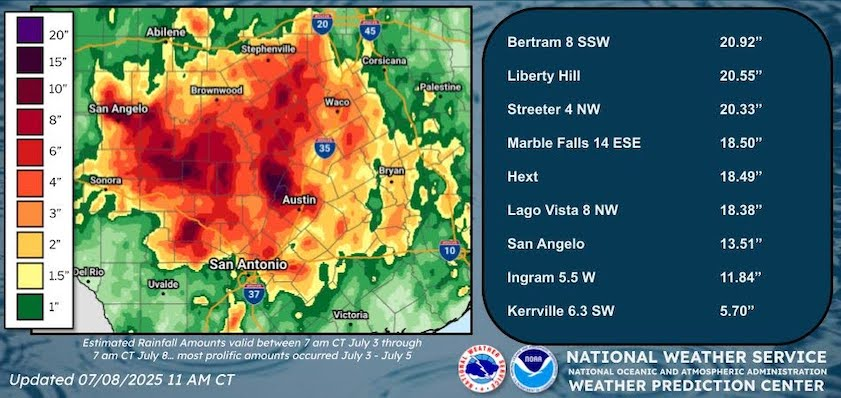
From Dust to Deluge: Weather Whiplash Devastates Texas

Texas experienced a significant weather whiplash event in June and July 2025. The Edwards Plateau region had been in long-term drought since late 2021. By the end of May 2025, long-term drought indicators, including reservoir and groundwater levels, were showing exceptionally poor conditions. Then, in June and July, the region experienced historic and devastating floods.

Drought and floods are the extreme ends of a shared spectrum. When too much of a region's annual precipitation comes too fast, flash flooding is possible. Subsequently, if too little precipitation falls, the onset of drought can occur.  Better understanding of how long-term drought conditions impact communities’ vulnerability to devastating flash floods can help provide early warning of the sequential, compounding, and cascading effects of hydrological extremes.

Time series of 48-month cumulative precipitation (inches) averaged over the 20 counties highlighted in the caption of the previous figure. June 2022 marks the minimum in the most recent drought period and is the third lowest 48-month precipitation on record behind 1917 (second lowest) and 1957 (lowest by a large margin).
48-month cumulative precipitation (inches) averaged over the 20 counties that were included in Texas’ disaster declaration: Bandera, Bexar, Burnet, Caldwell, Coke, Comal, Concho,  Gillespie, Guadalupe, Kerr,  Kendall, Kimble, Llano, Mason, McCulloch, Menard, San Saba, Tom Green, Travis, and Williamson Counties. Each data point represents the 48-month period ending in June of that year, compared to all previous 48-month periods ending in June since 1895. Data Source: NOAA National Centers for Environmental Information nClimGrid.
Estimated rainfall amounts (inches) between 7 a.m. CT July 3 to 7 a.m. CT July 8 over central Texas. Before this rainfall event, most of the region was in drought. Torrential estimated rainfall totals were seen from San Angelo to San Antonio, Austin, Waco, and up to Stephenville. The highest rainfall estimate is from Bertram 8 SSW, where 20.92 inches of rain were estimated.
Radar estimates of rainfall (inches) over central Texas from 7 a.m. CT on July 3 through 7 a.m. CT on July 8. The panel on the right displays actual gauge totals. Source: NOAA National Weather Service.

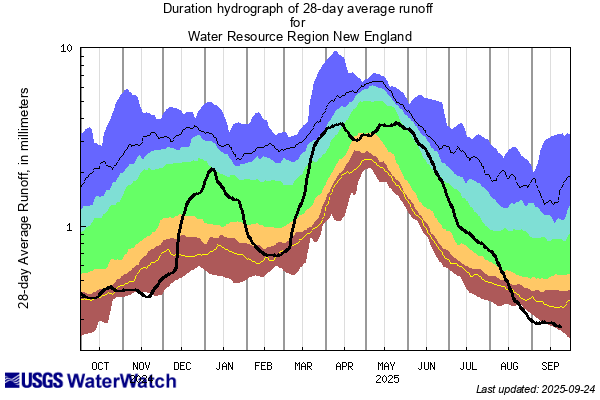
Runoff Hits Historic Lows in New England

In late summer, drought expanded and intensified in New England. Much of the region received less than 50% of normal precipitation from July to September. By the end of September, roughly one-third of the Northeast was in Severe or Extreme Drought (D2-D3). Vermont experienced its worst drought conditions since the U.S. Drought Monitor began in 2000. Record-low streamflows and groundwater levels were reported across the Northeast. Numerous wells ran dry across Vermont and New Hampshire. 

28-day average streamflow runoff for New England reached historic lows in late August and early September and is currently below the 5th percentile.
28-day average streamflow runoff for New England compared to historical conditions. Orange and brown colors indicate below-normal streamflow runoff, green indicates normal streamflow runoff, and blue colors indicate above-normal streamflow runoff. Data valid September 24, 2025. Source: U.S. Geological Survey WaterWatch

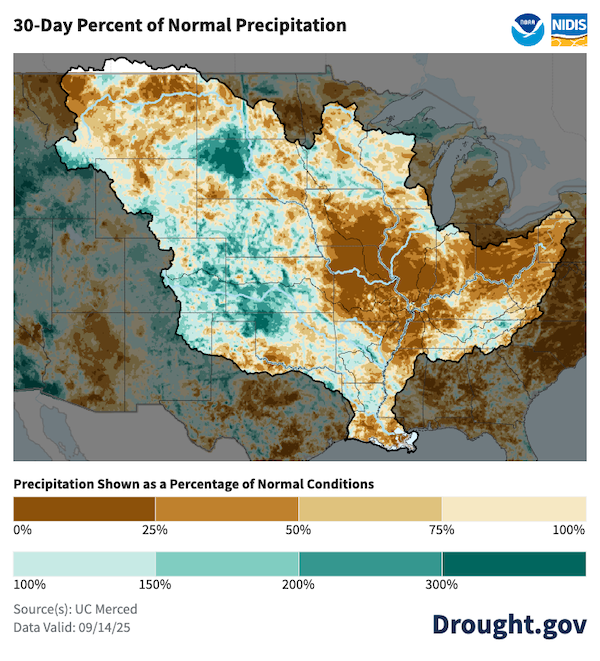
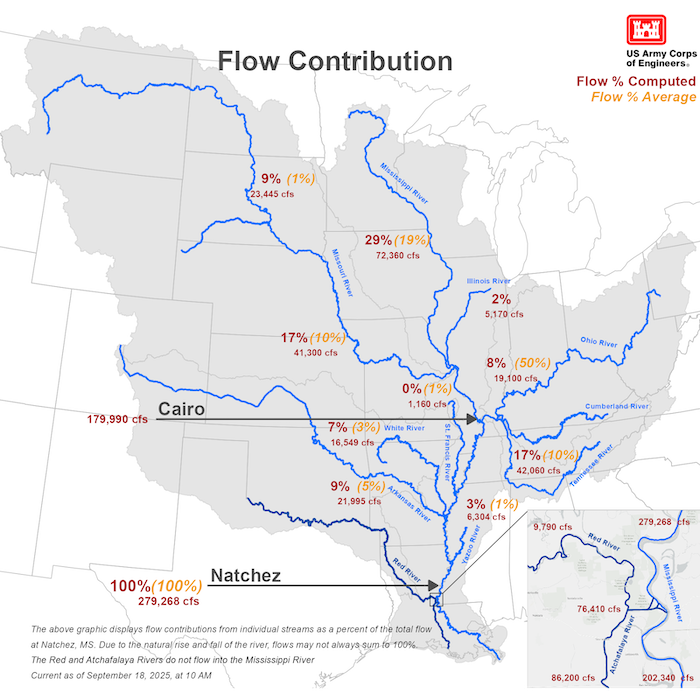
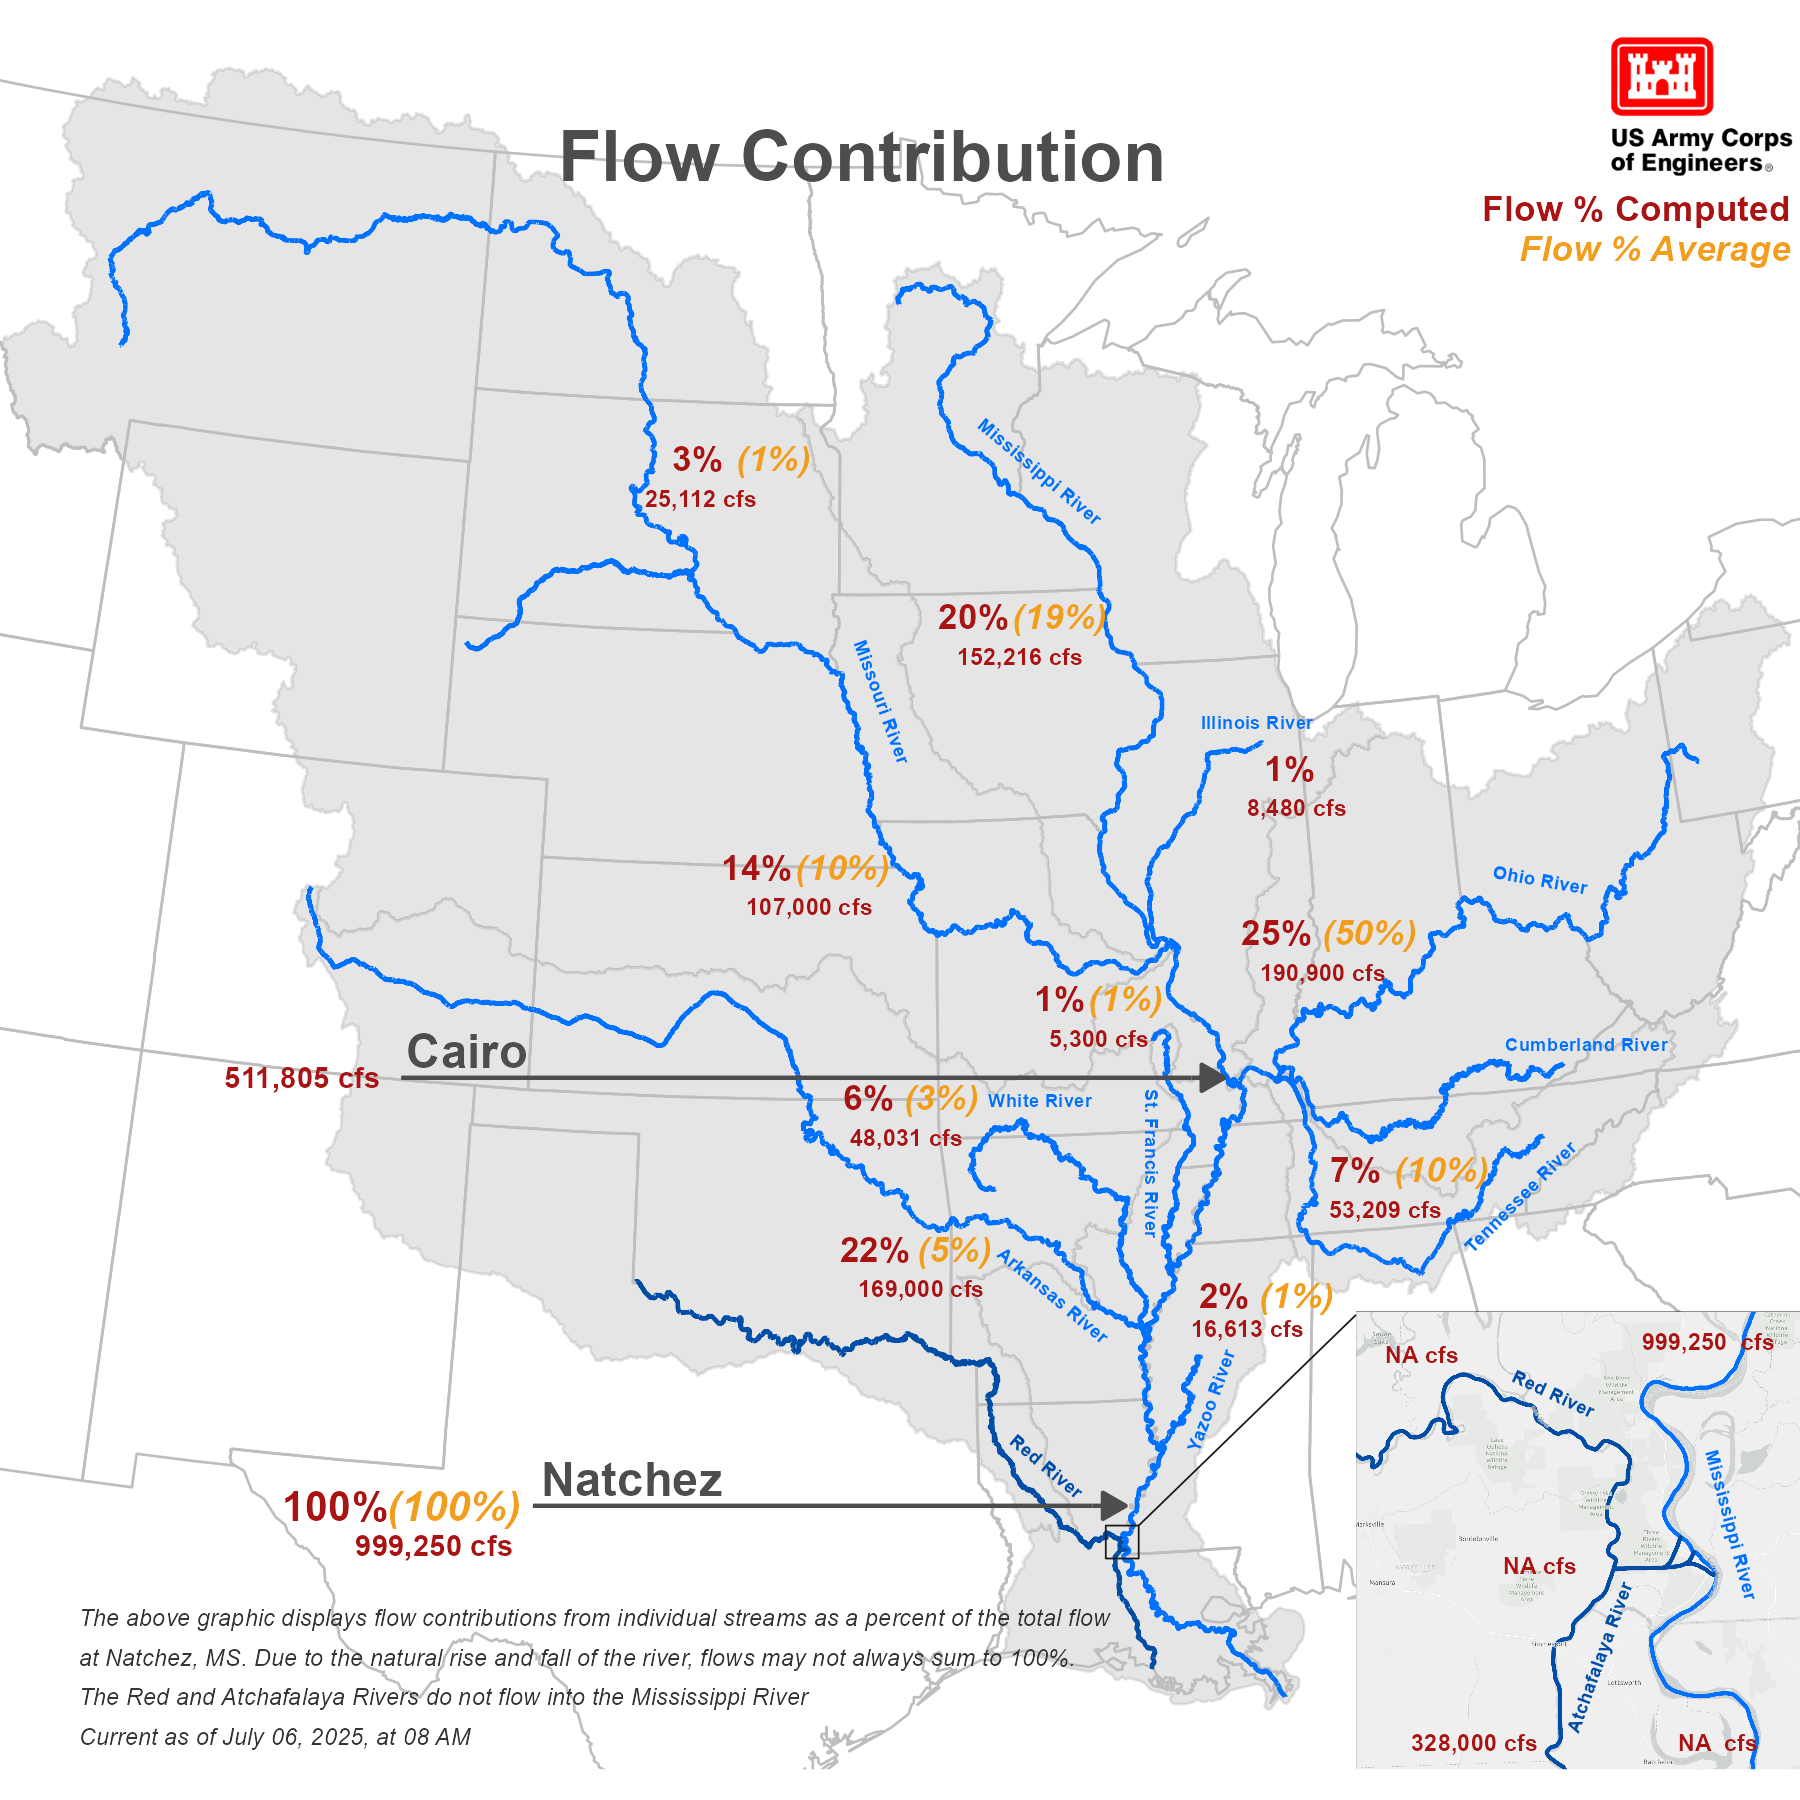
Low Water Levels on the Mighty Mississippi

Extremely dry conditions across the Ohio River Basin and southern portions of the Midwest in August and September led to the rapid expansion of drought and decreased flows on the Ohio River and portions of the Lower Mississippi River. In Mid-September, the Ohio River was contributing only 8% of the overall water flow in the Lower Mississippi River, compared to its typical 50% contribution. The Ohio River at Cairo, Illinois (where the Ohio meets the Mississippi River) fell below 10 feet. 

A significant portion of the Ohio River Basin and Lower Midwest states received only 0-25% of normal precipitation between mid August and mid September.
A significant portion of the Ohio River Basin and Lower Midwest states received only 0-25% of normal precipitation from August 14-September 14, 2025. These extremely dry conditions led to the expansion of drought and decreased flows from rivers across the Basin. This map shows precipitation over the past 30 days as a percentage of the historical average (1991–2020) for the same time period. Green/blue shades indicate above-normal precipitation, while brown shades indicate below-normal precipitation. Source: UC Merced, GridMET. Map from Drought.gov Mississippi River Basin Drought and Water Dashboard.
On September 8, the Ohio River was contributing only 8% of the overall flow of the Lower Mississippi River Basin, as compared to its typical 50% contribution. The Upper Mississippi and Missouri Rivers were contributing around 57% of the flow to the Lower Mississippi River compared to the typical 30%.
On September 8 2025, the Ohio River was only contributing 8% of the overall flow of the Lower Mississippi River, as compared to its typical 50% contribution. Meanwhile, the Upper Mississippi and Missouri Rivers were contributing around 57% of the flow to the Lower Mississippi River compared to the typical 30%. Sub-basins within the broader Mississippi Basin contribute different flow amounts to the normal water levels that are recorded at Natchez, Louisiana in the Lower Mississippi River Basin. In the image above, normal flow contribution is provided in orange, while the current flow contribution is provided in red. Source: U.S. Army Corps of Engineers.

Drought Peaked in November at 36%

In late November, the 2025 drought reached its national peak, with 36.65% of the U.S. in drought (D1-D4) according to the U.S. Drought Monitor. November 2025 temperatures were above to much above average throughout most of the Western and Central U.S. Idaho, Nevada, Oregon, Texas, and Utah set new statewide records for November average temperatures. Portions of the northern Great Basin, Northwest, and Rockies and much of the country east of the Mississippi River saw below-average precipitation.

A U.S. Drought Monitor map of the contiguous United States from November 25, 2025, depicting the year's peak drought coverage. Dark red and maroon polygons (Extreme and Exceptional Drought) are concentrated in the Intermountain West, Southern Plains, Southeast, and Midwest.
On November 25, 2025, the spatial extent of drought in the United States reached its annual peak, with 36.65% of the country experiencing Moderate Drought (D1) or worse. This map highlights the significant intensification of Extreme (D3) and Exceptional (D4) drought across the Mountain West, South, Midwest, Northeast, and Hawaii. Source: National Drought Mitigation Center, NOAA, and USDA.

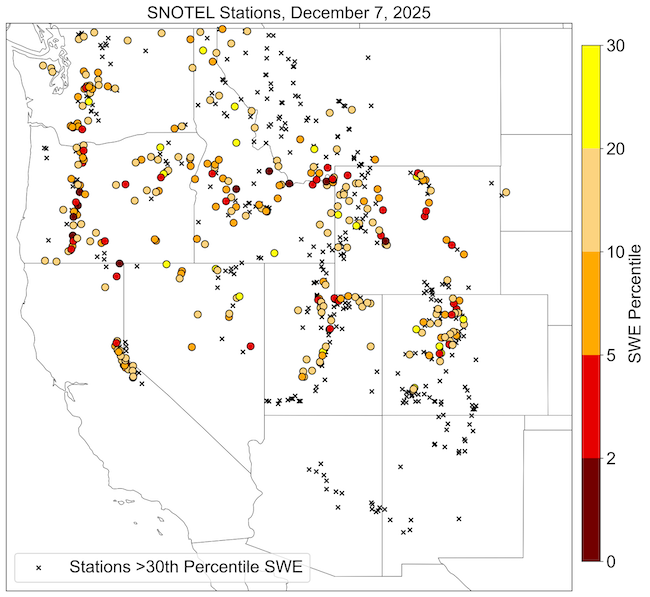
Winter Brings Rain Instead of Snow to the West

Winter 2025-2026 kicked off with warm weather and rain instead of snow. Nearly every major river basin in the West experienced a November among the top 5 warmest on record. On December 7, 2025, snow cover across the West was the lowest amount for that date in the MODIS satellite record (since 2001), at 90,646 square miles. Water Year 2026 (October 1, 2025–September 30, 2026) precipitation to date was near or above median for many parts of the West in late December. However, much warmer-than-normal temperatures caused precipitation to fall as rain instead of snow in many basins, leading to snow drought despite wetter-than-normal conditions across most of the West. At the end of 2025, snow drought was most severe across much of the Sierra Nevada in California, the Cascade Range in Washington and Oregon, the Blue Mountains of Oregon, and the Great Basin in Nevada.

On December 7, 2025, sSnow water equivalent below the 30th percentile wasis reported at many SNOTEL stations across the West. Some stations in Oregon, Idaho, and Wyoming, record low snow water equivalent.
Snow water equivalent (SWE) percentiles for locations in the western U.S. at or below the 30th percentile as of December 7, 2025. The colored dots show stations with SWE below the 2nd percentile (dark red), 2nd–5th percentile (bright red), 5th–10th percentile (orange), 10th–20th percentile (tan), and 20th–30th percentile (yellow). Stations with SWE above the 30th percentile are shown with a black “x.” We define snow drought as SWE below the 20th percentile. Only SNOTEL stations with at least 20 years of data were used. Stations where the median SWE value for the date is zero are not shown.  Data source: USDA Natural Resources Conservation Service

Keep Up With the Latest Conditions and Outlooks 

Find maps, publicly accessible data, and recent research about drought and wildfire on drought.gov. You can also subscribe to NIDIS emails for the latest regional drought updates, webinars, and news in our drought early warning system regions. To stay up to date on the latest drought conditions, sign up to receive drought alerts for your city/zip code when the National Weather Service updates their U.S. Drought Outlooks.