Winter Begins With Rain Instead of Snow; Snow Drought Takes Hold Across the West
Key Points
- Snow cover across the West was the lowest December 7 snow cover amount in the MODIS satellite record (since 2001), at 90,646 square miles.
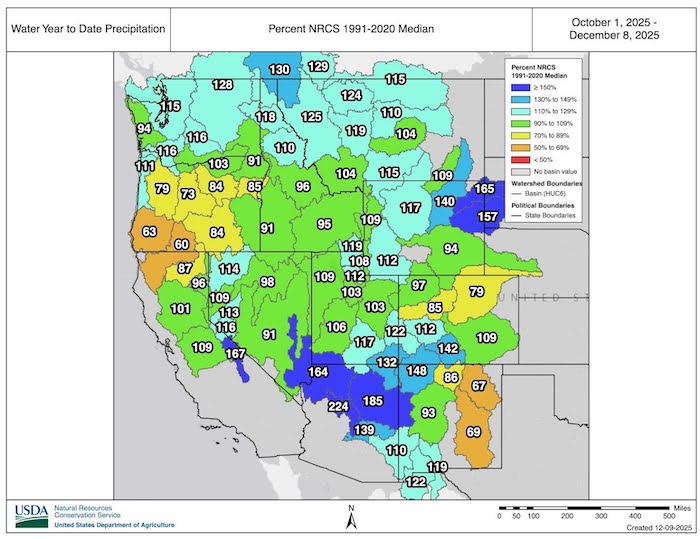
- Water Year 2026 (October 1, 2025–September 30, 2026) precipitation to date is near or above median for many parts of the West. However, much warmer-than-normal temperatures caused precipitation to fall as rain instead of snow across many basins, leading to snow drought despite wetter-than-normal conditions across most of the West.
- Nearly every major river basin in the West experienced a November among the top 5 warmest on record.
- Snow drought is most severe across much of the Sierra Nevada in California, the Cascade Range in Washington and Oregon, the Blue Mountains of Oregon, and the Great Basin in Nevada, with snow water equivalent (SWE) in most of these basins at less than 50% of median.
- Rain across the West increased soil moisture and reservoir levels. However, the continued above-normal temperatures forecast across the West may worsen snow drought conditions.
- Winter just began, and snowpack can change dramatically with a single storm this early in the season. Cold, wet weather is needed to improve snowpack conditions.
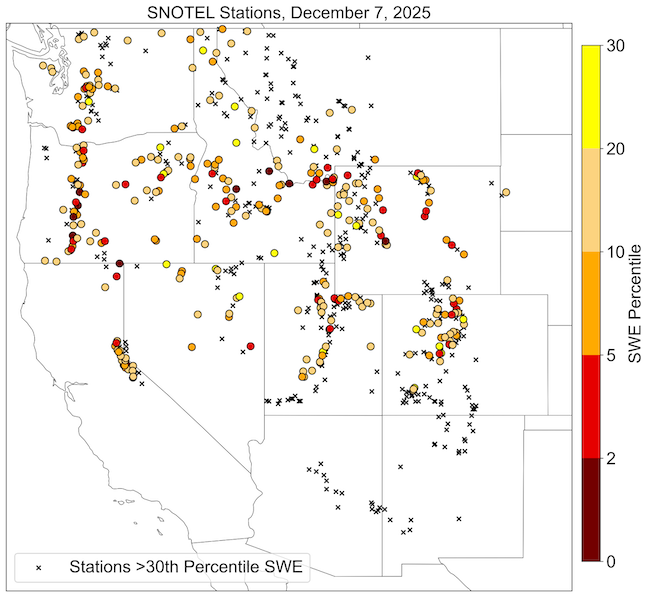
Snow Telemetry (SNOTEL) snow water equivalent (SWE) values for watersheds in the western U.S. as a percentage of the 1991–2020 median. Only stations with at least 20 years of data are included in the station medians. This map is valid through the end of the day December 7, 2025.
For an interactive version of this map, please visit NRCS.
Snow Telemetry (SNOTEL) snow water equivalent (SWE) values for watersheds in Alaska as a percentage of the 1991–2020 median. Only stations with at least 20 years of data are included in the station median. Significantly high percentages can occur mathematically when the median is zero or near zero and are typical during early and late snow season. This map is valid through the end of the day December 7, 2025.
For an interactive version of this map, please visit NRCS.
Drought is defined as the lack of precipitation over an extended period of time, usually for a season or more, that results in a water shortage. Changes in precipitation can substantially disrupt crops and livestock, influence the frequency and intensity of severe weather events, and affect the quality and quantity of water available for municipal and industrial use.
Learn MoreSnow drought is a period of abnormally low snowpack for the time of year. Snowpack typically acts as a natural reservoir, providing water throughout the drier summer months. Lack of snowpack storage, or a shift in timing of snowmelt, can be a challenge for drought planning.
Learn MorePeriods of drought can lead to inadequate water supply, threatening the health, safety, and welfare of communities. Streamflow, groundwater, reservoir, and snowpack data are key to monitoring and forecasting water supply.
Learn MoreIn a drought, lower water levels or snowpack can affect the availability of recreational activities and associated tourism, and a resulting loss of revenue can severely impact supply chains and the economy. Drought—as well as negative perceptions of drought, fire bans, or wildfires—may also result in decreased visitations, cancellations in hotel stays, a reduction in booked holidays, or reduced merchandise sales.
Learn MoreDrought is defined as the lack of precipitation over an extended period of time, usually for a season or more, that results in a water shortage. Changes in precipitation can substantially disrupt crops and livestock, influence the frequency and intensity of severe weather events, and affect the quality and quantity of water available for municipal and industrial use.
Learn MoreSnow drought is a period of abnormally low snowpack for the time of year. Snowpack typically acts as a natural reservoir, providing water throughout the drier summer months. Lack of snowpack storage, or a shift in timing of snowmelt, can be a challenge for drought planning.
Learn MorePeriods of drought can lead to inadequate water supply, threatening the health, safety, and welfare of communities. Streamflow, groundwater, reservoir, and snowpack data are key to monitoring and forecasting water supply.
Learn MoreIn a drought, lower water levels or snowpack can affect the availability of recreational activities and associated tourism, and a resulting loss of revenue can severely impact supply chains and the economy. Drought—as well as negative perceptions of drought, fire bans, or wildfires—may also result in decreased visitations, cancellations in hotel stays, a reduction in booked holidays, or reduced merchandise sales.
Learn MorePercent of Median Snow Water Equivalent
< 50% of Median
Current snow water equivalent (SWE) is less than 50% of the median SWE value for this day of the year, compared to historical conditions from 1991–2020.
50%–70% of Median
Current snow water equivalent (SWE) is between 50%–70% of the median SWE value for this day of the year, compared to historical conditions from 1991–2020.
70%–90% of Median
Current snow water equivalent (SWE) is between 70%–90% of the median SWE value for this day of the year, compared to historical conditions from 1991–2020.
90%–110% of Median
Current snow water equivalent (SWE) is between 90%–110% of the median SWE value for this day of the year, compared to historical conditions from 1991–2020.
110%–130% of Median
Current snow water equivalent (SWE) is between 110%–130% of the median SWE value for this day of the year, compared to historical conditions from 1991–2020.
130%–150% of Median
Current snow water equivalent (SWE) is between 130%–150% of the median SWE value for this day of the year, compared to historical conditions from 1991–2020.
>150% of Median
Current snow water equivalent (SWE) is greater than 150% of the median SWE value for this day of the year, compared to historical conditions from 1991–2020.
Percent of Median Snow Water Equivalent
< 50% of Median
Current snow water equivalent (SWE) is less than 50% of the median SWE value for this day of the year, compared to historical conditions from 1991–2020.
50%–70% of Median
Current snow water equivalent (SWE) is between 50%–70% of the median SWE value for this day of the year, compared to historical conditions from 1991–2020.
70%–90% of Median
Current snow water equivalent (SWE) is between 70%–90% of the median SWE value for this day of the year, compared to historical conditions from 1991–2020.
90%–110% of Median
Current snow water equivalent (SWE) is between 90%–110% of the median SWE value for this day of the year, compared to historical conditions from 1991–2020.
110%–130% of Median
Current snow water equivalent (SWE) is between 110%–130% of the median SWE value for this day of the year, compared to historical conditions from 1991–2020.
130%–150% of Median
Current snow water equivalent (SWE) is between 130%–150% of the median SWE value for this day of the year, compared to historical conditions from 1991–2020.
>150% of Median
Current snow water equivalent (SWE) is greater than 150% of the median SWE value for this day of the year, compared to historical conditions from 1991–2020.
Snow Telemetry (SNOTEL) snow water equivalent (SWE) values for watersheds in the western U.S. as a percentage of the 1991–2020 median. Only stations with at least 20 years of data are included in the station medians. This map is valid through the end of the day December 7, 2025.
For an interactive version of this map, please visit NRCS.
Snow Telemetry (SNOTEL) snow water equivalent (SWE) values for watersheds in Alaska as a percentage of the 1991–2020 median. Only stations with at least 20 years of data are included in the station median. Significantly high percentages can occur mathematically when the median is zero or near zero and are typical during early and late snow season. This map is valid through the end of the day December 7, 2025.
For an interactive version of this map, please visit NRCS.
View an updated, interactive version of this map from the USDA's Natural Resources Conservation Service. You can also view SWE data on Drought.gov.
View an updated, interactive version of this map from the USDA's Natural Resources Conservation Service. You can also view SWE data on Drought.gov.
Drought is defined as the lack of precipitation over an extended period of time, usually for a season or more, that results in a water shortage. Changes in precipitation can substantially disrupt crops and livestock, influence the frequency and intensity of severe weather events, and affect the quality and quantity of water available for municipal and industrial use.
Learn MoreSnow drought is a period of abnormally low snowpack for the time of year. Snowpack typically acts as a natural reservoir, providing water throughout the drier summer months. Lack of snowpack storage, or a shift in timing of snowmelt, can be a challenge for drought planning.
Learn MorePeriods of drought can lead to inadequate water supply, threatening the health, safety, and welfare of communities. Streamflow, groundwater, reservoir, and snowpack data are key to monitoring and forecasting water supply.
Learn MoreIn a drought, lower water levels or snowpack can affect the availability of recreational activities and associated tourism, and a resulting loss of revenue can severely impact supply chains and the economy. Drought—as well as negative perceptions of drought, fire bans, or wildfires—may also result in decreased visitations, cancellations in hotel stays, a reduction in booked holidays, or reduced merchandise sales.
Learn MoreDrought is defined as the lack of precipitation over an extended period of time, usually for a season or more, that results in a water shortage. Changes in precipitation can substantially disrupt crops and livestock, influence the frequency and intensity of severe weather events, and affect the quality and quantity of water available for municipal and industrial use.
Learn MoreSnow drought is a period of abnormally low snowpack for the time of year. Snowpack typically acts as a natural reservoir, providing water throughout the drier summer months. Lack of snowpack storage, or a shift in timing of snowmelt, can be a challenge for drought planning.
Learn MorePeriods of drought can lead to inadequate water supply, threatening the health, safety, and welfare of communities. Streamflow, groundwater, reservoir, and snowpack data are key to monitoring and forecasting water supply.
Learn MoreIn a drought, lower water levels or snowpack can affect the availability of recreational activities and associated tourism, and a resulting loss of revenue can severely impact supply chains and the economy. Drought—as well as negative perceptions of drought, fire bans, or wildfires—may also result in decreased visitations, cancellations in hotel stays, a reduction in booked holidays, or reduced merchandise sales.
Learn MoreSnow Drought Conditions Summary
This update is based on data available as of Monday, December 8, 2025 at 12:00 a.m. PT. We acknowledge that conditions are evolving.
Quantifying snow drought values is an ongoing research effort. Here, we define snow drought as snow water equivalent (SWE) at or below the 20th percentile, which is a baseline guided by partner expertise and research. Note that reporting of SWE by Snow Telemetry (SNOTEL) stations may be unavailable or delayed due to technical, weather or other issues, which may affect snow drought depiction in this update.
Current Conditions
Nearly every major basin in the West experienced a near-record or record warm November. It was the warmest November on record in the Upper Colorado River, Rio Grande, and Great Basin watersheds. The Columbia River Basin experienced its 2nd warmest November, and the Lower Colorado River basin experienced its third warmest. The California River Basin experienced its 4th warmest; in the Missouri River Basin, it was the 9th warmest.
Jump to conditions for your region:
- Colorado, Idaho, Montana, Utah, Wyoming (Rocky Mountains) Snow Conditions
- Arizona and New Mexico Snow Conditions
- Oregon and Washington Snow Conditions
- California and Nevada Snow Conditions
- Alaska Snow Conditions
A Rainy Start to the Water Year Across the West
Low Snow Water Equivalent at Many Stations Across the West
Rocky Mountain Snow Conditions (Colorado, Idaho, Montana, Utah, Wyoming)
Northern Rockies
Snow conditions vary across the northern Rocky Mountains. The season started dry and very warm. Storm activity increased over the last two weeks, and snow accumulated in the mountains. Most of western Montana (except the southwestern corner of the state) has snow water equivalent (SWE) near to above median, with more widespread below-median SWE in Idaho and Wyoming. The locations with the lowest SWE are in southern Idaho, southwestern Montana, and northern Wyoming. SWE in several basins in this area is less than 70% of median, and SWE at many individual stations is less than 50% of median. In Idaho and Wyoming, the area covered by snow since the start of the water year is at record low, based on satellite data collected since 2001.
Central Rockies
Snowpack is generally below median in the central Rocky Mountains, with the worst conditions in central and northern Utah and Colorado. The water year began with very warm conditions, and precipitation fell as rain instead of snow. SWE in many basins is less than 70% of median. These basins include the Colorado Headwaters Basin (62% of median SWE) and Jordan Basin (65%), both of which are key for regional water supplies. SWE is slightly higher in southwestern Colorado, but still below median across the region. SWE in the Rio Grande Headwaters Basin is 80% of median.
Arizona and New Mexico Snow Conditions
Early season snow conditions are variable throughout Arizona and New Mexico. Arizona had its 9th wettest fall on record (September–November), with a major storm cycle in early November bringing snow to higher mountain elevations. Conditions dried out over the past two weeks, but snowpack remains above median. However, snow melted in some areas at lower elevations with shallow snowpacks. Statewide, the Arizona snowpack is currently at 90% of median. The Salt, Verde, and Little Colorado Basins are at 56%, 82%, and 104% of median SWE, respectively. Across most of New Mexico, the water year has been much drier than in Arizona, leading to widespread below-normal snowpack. Statewide, New Mexico is at 75% of median SWE. The Upper Canadian, Upper Rio Grande, and Rio Grande-Elephant Butte Basins are at 60%, 69%, and 78% of median SWE.
Oregon and Washington Snow Conditions
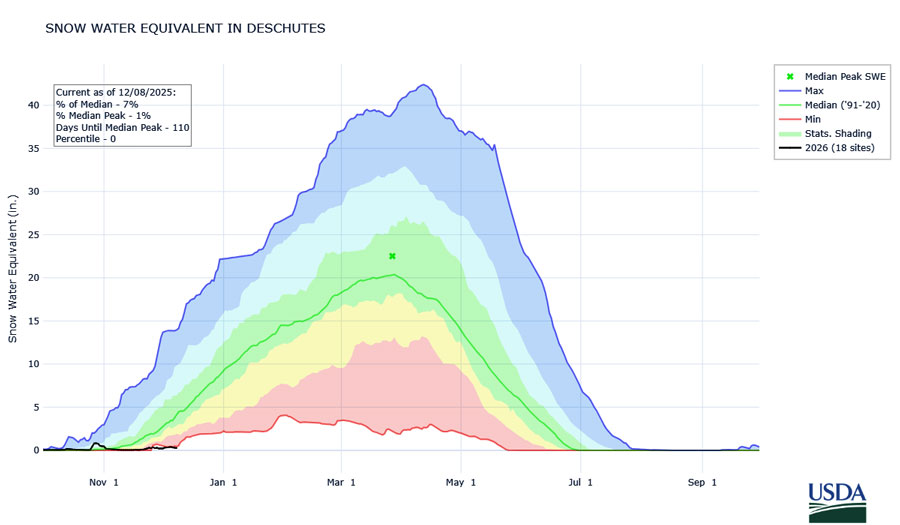
Snowpack is well below median across much of Oregon and Washington. Very little snow has accumulated so far in the Oregon Cascade Range below about 3,000-6,000 feet. Snow water equivalent (SWE) in the Willamette, Deschutes, Klamath, and South Oregon Coastal Basins is currently near 8% of median. For the Upper Deschutes Basin, 2025 is the slowest start to the snow accumulation season on record (1981 to present).
November 2025 was the region’s warmest November on record. Above-normal temperatures and high freezing levels (i.e., the elevation where the temperature is freezing) allowed more precipitation to fall as rain, driving the onset of warm snow drought in some areas. In central and eastern Oregon, SWE is generally below 50% of median. Southern and central Oregon have been quite dry, with below-median water year precipitation. In contrast, water year precipitation is near normal in the Cascade Range, Coast Range, and parts of the Blue Mountain Range in northern Oregon.
Early season warm snow drought is occurring throughout Washington, where most SNOTEL stations are currently below 50% of median SWE, despite near-to-above median water year precipitation. SWE is below median in the Upper Columbia (80% of median SWE), Yakima (50%), and Puget Sound (51%) Basins. Warm snow drought is less severe in north-central and northeastern Washington. Storm tracks so far this season were more favorable to Washington than Oregon, but warm storms over the last week brought rain and melted snow from earlier in the month. In the Northern Cascade Range, higher elevation SNOTEL sites are above median as a sharp elevational gradient for snow develops.
Low Snow Water Equivalent in the Deschutes Basin
California and Nevada Snow Conditions
Snow water equivalent (SWE) across California is much below normal. According to the California Department of Water Resources snow pillows, SWE in the Northern (7% of median), Central (23%), and Southern (63%) regions of California is below median. Water year precipitation was near to above normal in the northern and central Sierra Nevada, and above normal in the southern Sierra Nevada. However, warm temperatures and a high elevation rain/snow dividing line accompanied November storms. Most precipitation in the mid to low elevations of the mountains fell as rain.
Conditions were dry, sunny, and warm in the mountains, with no storm activity over the past two weeks. As a result, snow deficits became more pronounced. Most major reservoirs remain at or above normal but could be increasingly at risk with continued warm or dry conditions.
Snowpack in the eastern Sierra Nevada and most of northern Nevada is below median. The Humboldt Basin in northeastern Nevada, which includes the Ruby Mountains, is currently at 47% of median SWE. Several SNOTEL stations in far northeastern Nevada, which drain into the Snake River, have near- to above-median SWE. October and November storms led to above-median SWE in the Carson Range early in the season. However, SWE has since fallen well below the median, with no precipitation and above-normal temperatures since November 20. Soil moisture in the eastern Sierra and Nevada is 118% of the median due to above-normal rainfall percolating into soils in warm temperatures. The same storm system that brought heavy precipitation to much of the Southwest in mid-November brought heavy snowfall to the Spring Mountains in southern Nevada. Spring Mountain SWE is currently 158% of median, despite dry conditions over the past three weeks.
Alaska Snow Conditions
Across Alaska, data from a limited number of SNOTEL stations indicate early December snowpack is variable. In South-central Alaska, the Susitna River Basin is reporting the least snowpack, at 24% of median snow water equivalent (SWE), based on data from two SNOTEL stations. SWE in the coastal mountains in South-central Alaska is higher, including the Knik Arm (73% of median), Prince William Sound (75%), and Kenai Peninsula (94%) Basins. In the Tanana River Basin, which includes the Fairbanks region, SWE is currently 104% of median, though quite variable among individual stations, with values ranging from 50% of median to 150% of median.
Looking Ahead
A major atmospheric river system is impacting the Pacific Northwest. However, the ample precipitation may do little to improve snow drought conditions, with above-normal temperatures causing some precipitation to fall as rain instead of snow. During the event, a sharp elevational gradient of snow to no snow may develop, with lower elevation snow accumulation unlikely. However, high elevation SNOTEL sites may see a substantial increase in SWE.
Above-median precipitation across much of the West improved soil moisture. Wetter soils may contribute to a larger portion of runoff reaching streams and rivers during rainfall or spring snow melt. The relationship between soil moisture, snowpack, and runoff is an area of growing research. However, snow water equivalent stored in snowpack likely remains the most significant determinant of spring runoff. Saturated soils may lead to more spring flooding during the snow melt season.
The National Weather Service’s extended range forecasts over the next two weeks indicate above-normal precipitation in the Northwest, Northern Rockies, and Northern California and Nevada. Warmer-than-normal temperatures are likely across all of the Western United States. Warmer temperatures will continue to generate rain rather than snow, keeping the freezing levels (i.e., the elevation where the temperature is freezing) at higher elevations and limiting the development of snowpack.
For More Information, Contact:
Dan McEvoy
Desert Research Institute, Western Regional Climate Center
daniel.mcevoy@dri.edu
Jason Gerlich
University of Colorado Boulder Cooperative Institute for Research in Environmental Sciences / NOAA’s National Integrated Drought Information System
jason.gerlich@noaa.gov
Amanda Sheffield
University of Colorado Boulder Cooperative Institute for Research in Environmental Sciences / NOAA’s National Integrated Drought Information System
amanda.sheffield@noaa.gov
NIDIS and its partners launched this snow drought effort in 2018 to provide data, maps, and tools for monitoring snow drought and its impacts as well as communicating the status of snow drought across the United States, including Alaska. NIDIS is an interagency program within the Climate Program Office, which is part of NOAA's Office of Oceanic and Atmospheric Research.
Thank you to our partners for your continued support of this effort and review of these updates. If you would like to report snow drought impacts, please use the link below. Information collected will be shared with the states affected to help us better understand the short term, long term, and cumulative impacts of snow drought to the citizens and the economy of the regions reliant on snowpack.
Report Your Snow Drought Impacts
Data and Maps | Snow Drought
Research and Learn | Snow Drought