Evaporative Demand Drought Index (EDDI)
NOAA’s Office of Oceanic and Atmospheric Research Physical Sciences Laboratory and National Weather Service Climate Prediction Center
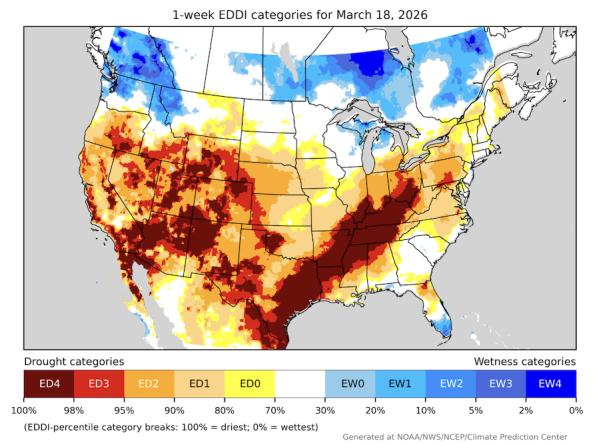
The Evaporative Demand Drought Index (EDDI) is an experimental tool that examines how anomalous the atmospheric evaporative demand (E0; also known as "the thirst of the atmosphere") is for a given location and across a timescaleof interest. EDDI maps use atmospheric evaporative demand anomalies across a timescale of interest relative to its climatology to indicate the spatial extent and severity of drought.
EDDI can offer early warning of agricultural drought, hydrologic drought, and fire-weather risk by providing near-real-time information on the emergence or persistence of anomalous evaporative demand in a region. A particular strength of EDDI is in capturing the precursor signals of water stress at weekly to monthly timescales, and EDDI can serve as an indicator of both rapidly evolving "flash" droughts (developing over a few weeks) and sustained droughts (developing over months but lasting up to years).
EDDI was created by NOAA’s Physical Sciences Laboratory and later transitioned to NOAA’s National Weather Service Climate Prediction Center in September 2025.
Currently, EDDI is generated daily—with a 5-day lag-time—by analyzing a near-real-time atmospheric dataset. This lag-time results from the procedures to quality control the meteorological data used to estimate evaporative demand. There is also an ongoing effort to forecast EDDI based on subseasonal and seasonal climate-forecast information.
The Evaporative Demand Drought Index (EDDI) is a drought monitoring tool that shows the anomaly in daily evaporative demand over a given period of time. Evaporative demand is the atmospheric influence on the drying of the landscape, or "the thirst of the atmosphere." Unusually high evaporative demand can lead to moisture stress on the land surface, and ultimately to drought—even when precipitation has been near-normal.
EDDI can serve as an indicator of both rapidly evolving "flash" droughts and sustained droughts and can offer early warning of agricultural drought, hydrologic drought, and fire-weather risk.
A drought index combines multiple drought indicators (e.g., precipitation, temperature, soil moisture) to depict drought conditions. For some products, like the U.S. Drought Monitor, authors combine their analysis of drought indicators with input from local observers. Other drought indices, like the Standardized Precipitation Index (SPI), use an objective calculation to describe the severity, location, timing, and/or duration of drought.
Learn MoreFlash drought is the rapid onset or intensification of drought. Unlike slow-evolving drought, which is caused by a decline in precipitation, flash drought occurs when low precipitation is accompanied by abnormally high temperatures, high winds, and/or changes in radiation. These sometimes-rapid changes can quickly raise evapotranspiration rates and remove available water from the landscape.
Learn MoreDrought can result in reduced growth rates, increased stress on vegetation, and alterations or transformations to the plant community and/or the entire ecosystem. During periods of drought, plants increase their demand for water through increased evapotranspiration and longer growing seasons.
Learn MoreDuring drought conditions, fuels for wildfire, such as grasses and trees, can dry out and become more flammable. Drought can also increase the probability of ignition and the rate at which fire spreads. Temperature, soil moisture, humidity, wind speed, and fuel availability (vegetation) are all factors that interact to influence the frequency of large wildfires.
Learn MoreA drought index combines multiple drought indicators (e.g., precipitation, temperature, soil moisture) to depict drought conditions. For some products, like the U.S. Drought Monitor, authors combine their analysis of drought indicators with input from local observers. Other drought indices, like the Standardized Precipitation Index (SPI), use an objective calculation to describe the severity, location, timing, and/or duration of drought.
Learn MoreFlash drought is the rapid onset or intensification of drought. Unlike slow-evolving drought, which is caused by a decline in precipitation, flash drought occurs when low precipitation is accompanied by abnormally high temperatures, high winds, and/or changes in radiation. These sometimes-rapid changes can quickly raise evapotranspiration rates and remove available water from the landscape.
Learn MoreDrought can result in reduced growth rates, increased stress on vegetation, and alterations or transformations to the plant community and/or the entire ecosystem. During periods of drought, plants increase their demand for water through increased evapotranspiration and longer growing seasons.
Learn MoreDuring drought conditions, fuels for wildfire, such as grasses and trees, can dry out and become more flammable. Drought can also increase the probability of ignition and the rate at which fire spreads. Temperature, soil moisture, humidity, wind speed, and fuel availability (vegetation) are all factors that interact to influence the frequency of large wildfires.
Learn MoreDrought Conditions
ED4: Exceptional Drought
Compared to "normal" conditions, evaporative demand is greater than 98% to 100% of historical values. Learn more about these categories.
ED3: Extreme Drought
Compared to "normal" conditions, evaporative demand is greater than 95% to 98% of historical values. Learn more about these categories.
ED2: Severe Drought
Compared to "normal" conditions, evaporative demand is greater than 90% to 95% of historical values. Learn more about these categories.
ED1: Moderate Drought
Compared to "normal" conditions, evaporative demand is greater than 80% to 90% of previous values. Learn more about these categories.
ED0: Abnormally Dry
Compared to "normal" conditions, evaporative demand is greater than 70% to 80% of historical values. Learn more about these categories.
Wet Conditions
EW0: Abnormally Wet
Compared to "normal" conditions, current evaporative demand is in the bottom 20% to 30% of historical values (i.e., only 20%–30% of previous values had lower evaporative demand). Learn more about these categories.
EW1: Moderate Wet
Compared to "normal" conditions, current evaporative demand is in the bottom 10% to 20% of historical values (i.e., only 10%–20% of previous values had lower evaporative demand). Learn more about these categories.
EW2: Severe Wet
Compared to "normal" conditions, current evaporative demand is in the bottom 5% to 10% of historical values (i.e., only 5%–10% of previous values had lower evaporative demand). Learn more about these categories.
EW3: Extreme Wet
Compared to "normal" conditions, current evaporative demand is in the bottom 2% to 5% of historical values (i.e., only 2%–5% of previous values had lower evaporative demand). Learn more about these categories.
EW4: Exceptional Wet
Compared to "normal" conditions, current evaporative demand is in the bottom 0% to 2% of historical values (i.e., less than 2% of previous values had lower evaporative demand). Learn more about these categories.
Drought Conditions
ED4: Exceptional Drought
Compared to "normal" conditions, evaporative demand is greater than 98% to 100% of historical values. Learn more about these categories.
ED3: Extreme Drought
Compared to "normal" conditions, evaporative demand is greater than 95% to 98% of historical values. Learn more about these categories.
ED2: Severe Drought
Compared to "normal" conditions, evaporative demand is greater than 90% to 95% of historical values. Learn more about these categories.
ED1: Moderate Drought
Compared to "normal" conditions, evaporative demand is greater than 80% to 90% of previous values. Learn more about these categories.
ED0: Abnormally Dry
Compared to "normal" conditions, evaporative demand is greater than 70% to 80% of historical values. Learn more about these categories.
Wet Conditions
EW0: Abnormally Wet
Compared to "normal" conditions, current evaporative demand is in the bottom 20% to 30% of historical values (i.e., only 20%–30% of previous values had lower evaporative demand). Learn more about these categories.
EW1: Moderate Wet
Compared to "normal" conditions, current evaporative demand is in the bottom 10% to 20% of historical values (i.e., only 10%–20% of previous values had lower evaporative demand). Learn more about these categories.
EW2: Severe Wet
Compared to "normal" conditions, current evaporative demand is in the bottom 5% to 10% of historical values (i.e., only 5%–10% of previous values had lower evaporative demand). Learn more about these categories.
EW3: Extreme Wet
Compared to "normal" conditions, current evaporative demand is in the bottom 2% to 5% of historical values (i.e., only 2%–5% of previous values had lower evaporative demand). Learn more about these categories.
EW4: Exceptional Wet
Compared to "normal" conditions, current evaporative demand is in the bottom 0% to 2% of historical values (i.e., less than 2% of previous values had lower evaporative demand). Learn more about these categories.
The Evaporative Demand Drought Index (EDDI) is a drought monitoring tool that shows the anomaly in daily evaporative demand over a given period of time. Evaporative demand is the atmospheric influence on the drying of the landscape, or "the thirst of the atmosphere." Unusually high evaporative demand can lead to moisture stress on the land surface, and ultimately to drought—even when precipitation has been near-normal.
EDDI can serve as an indicator of both rapidly evolving "flash" droughts and sustained droughts and can offer early warning of agricultural drought, hydrologic drought, and fire-weather risk.
The Evaporative Demand Drought Index is updated daily, with a 5-day delay. This delay results from the procedures to quality control the meteorological data used to estimate evaporative demand.
The Evaporative Demand Drought Index (EDDI) is updated daily, with a 5-day delay. This delay results from the procedures to quality control the meteorological data used to estimate evaporative demand.
A drought index combines multiple drought indicators (e.g., precipitation, temperature, soil moisture) to depict drought conditions. For some products, like the U.S. Drought Monitor, authors combine their analysis of drought indicators with input from local observers. Other drought indices, like the Standardized Precipitation Index (SPI), use an objective calculation to describe the severity, location, timing, and/or duration of drought.
Learn MoreFlash drought is the rapid onset or intensification of drought. Unlike slow-evolving drought, which is caused by a decline in precipitation, flash drought occurs when low precipitation is accompanied by abnormally high temperatures, high winds, and/or changes in radiation. These sometimes-rapid changes can quickly raise evapotranspiration rates and remove available water from the landscape.
Learn MoreDrought can result in reduced growth rates, increased stress on vegetation, and alterations or transformations to the plant community and/or the entire ecosystem. During periods of drought, plants increase their demand for water through increased evapotranspiration and longer growing seasons.
Learn MoreDuring drought conditions, fuels for wildfire, such as grasses and trees, can dry out and become more flammable. Drought can also increase the probability of ignition and the rate at which fire spreads. Temperature, soil moisture, humidity, wind speed, and fuel availability (vegetation) are all factors that interact to influence the frequency of large wildfires.
Learn MoreA drought index combines multiple drought indicators (e.g., precipitation, temperature, soil moisture) to depict drought conditions. For some products, like the U.S. Drought Monitor, authors combine their analysis of drought indicators with input from local observers. Other drought indices, like the Standardized Precipitation Index (SPI), use an objective calculation to describe the severity, location, timing, and/or duration of drought.
Learn MoreFlash drought is the rapid onset or intensification of drought. Unlike slow-evolving drought, which is caused by a decline in precipitation, flash drought occurs when low precipitation is accompanied by abnormally high temperatures, high winds, and/or changes in radiation. These sometimes-rapid changes can quickly raise evapotranspiration rates and remove available water from the landscape.
Learn MoreDrought can result in reduced growth rates, increased stress on vegetation, and alterations or transformations to the plant community and/or the entire ecosystem. During periods of drought, plants increase their demand for water through increased evapotranspiration and longer growing seasons.
Learn MoreDuring drought conditions, fuels for wildfire, such as grasses and trees, can dry out and become more flammable. Drought can also increase the probability of ignition and the rate at which fire spreads. Temperature, soil moisture, humidity, wind speed, and fuel availability (vegetation) are all factors that interact to influence the frequency of large wildfires.
Learn MoreHow to
How do I use the EDDI site?
- On the main website, click the static images to view up-to-date maps for a 3-month EDDI, 3-month EDDI 30-day change map, and 3-month EDDI attribution maps showing individual meteorological drivers such as specific humidity and temperature.
- Click the button for Experimental Evaporative Demand Drought Index to view more detailed EDDI information and data. This page provides access to near-real-time maps (with a five-day latency due to the most recent information being five days old) depicting EDDI, changes in EDDI, and attribution of EDDI to individual meteorological drivers, with timescales that measure E0 anomalies across the 1 to 12 weeks and 1 to 12 months prior to the most current date.
- Select the Current Conditions section of the EDDI web page to view current EDDI maps, change maps, and attribution maps. Select a timescale from the dropdown menu and click “apply” to update the maps.
- Access EDDI data for recent years from the Climate Prediction Center’s FTP. Additional historical EDDI data can be requested by emailing the EDDI points of contact at the Climate Prediction Center (Yutong.Pan@noaa.gov, Hailan.Wang@noaa.gov).
- Select the Map Archive section of the EDDI web page to view past EDDI maps. Select a date and timescale from the dropdown menu and click “apply” to update the maps.
- Select the Time Series section of the EDDI web page to generate historical time series data and plots of EDDI for a specified region in the contiguous United States. The time series is produced as a table for different timescales (e.g., 1 to 12 months at the end of a given month) and includes historical data from 1980 to the latest complete year.
- Select the Resources section of the EDDI web page to view background material, media mentions, and other documentation for EDDI.
For more information, read the EDDI User Guide and refer to this graphic on How to Read an EDDI Map.
Access
Evaporative Demand Drought Index (EDDI): Official EDDI website hosted by NOAA’s Climate Prediction Center
Access EDDI Data: Access netCDF files for recent years via the Climate Prediction Center’s FTP repository. You can request additional historical EDDI data files by emailing EDDI points of contact at the Climate Prediction Center.
National Weather Service EDDI Web Map Service: Access raster layers for near real-time EDDI category and EDDI category changes at 24 timescales, ranging from 1 week through 12 months, and view EDDI data as an interactive map layer in ArcGIS Online.
GridMET-Based EDDI
In addition to the EDDI produced by NOAA's Physical Science Laboratory and NOAA’s Climate Prediction Center (which is based on NLDAS-2 data), the Drought.gov team produces an EDDI product via the Climate Engine tool that uses the GridMET daily dataset, using a 1991–2020 reference period, a non-parametric distribution, and Penman-Monteith PET (potential evapotranspiration).
View more documentation on the GridMET-based EDDI from Climate Engine.
Documention
The Evaporative Demand Drought Index (EDDI) uses atmospheric evaporative demand (E0) anomalies across a timescale of interest relative to its climatology to indicate the spatial extent and severity of drought. The E0 is calculated using the Penman-Monteith FAO56 reference evapotranspiration formulation (0.5-m tall reference crop), driven by data on temperature, humidity, wind speed, and incoming solar radiation, with these data extracted from the operational North American Land Data Assimilation System phase 2 (NLDAS-2) dataset. For a particular time window, EDDI is estimated by standardizing the E0 anomalies relative to the same accumulation time-window in the whole period of record (1979-present), using a rank-based non-parametric method described in Hobbins et al. (2016). EDDI data are available at a ~12-km resolution (0.125° lat and long) across the contiguous U.S. since January 1, 1980, and are updated daily. The CPC-hosted EDDI products use a climatology period of 1980–2021, while EDDI maps hosted by PSL use a climatology period of 1980–2015.
References
- NOAA’s Climate Prediction Center: Product Description Document: Evaporative Demand Drought Index Monitoring (Contiguous U.S.)
- Michael Hobbins, Andrew Wood, Daniel McEvoy, Justin Huntington, Charles Morton, James Verdin, Martha Anderson, and Christopher Hain. (2016). “The Evaporative Demand Drought Index: Part I – Linking Drought Evolution to Variations in Evaporative Demand.” Journal of Hydrometeorology, 17(6),1745-1761.
- Daniel J. McEvoy, Justin L. Huntington, Michael T. Hobbins, Andrew Wood, Charles Morton, James Verdin, Martha Anderson, and Christopher Hain. (2016). “The Evaporative Demand Drought index: Part II – CONUS-wide Assessment Against Common Drought Indicators.”Journal of Hydrometeorology, 17(6), 1763-1779.