Crop Moisture Index (CMI)
National Weather Service (NWS) Climate Prediction Center (CPC)
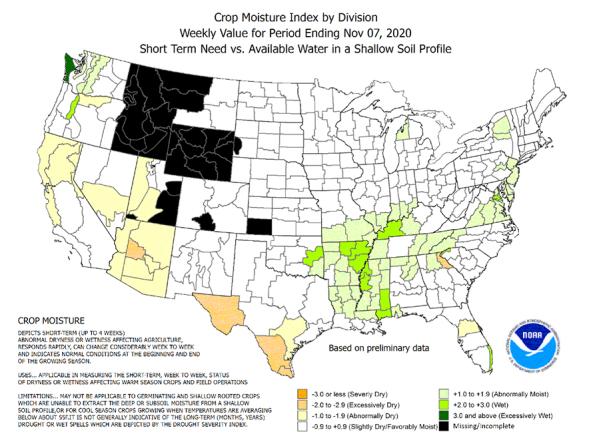
The CMI gives the short-term or current status of purely agricultural drought or moisture surplus and can change rapidly from week to week. The CMI indicate general conditions and not local variations caused by isolated rain. Calculation of the CMI are made for 350 climatic divisions in the United States and Puerto Rico. Input to the calculations include the weekly precipitation total and average temperature, division constants (water capacity of the soil, etc.) and previous history of the indices. The CMI can be used to measure the status of dryness or wetness affecting warm season crops and field activities.
How to
What can I do with these data?
- Check weekly measurement of short-term needs vs. available water (dry to wet)
How do I use the site?
- Data Tables: Select a Region to view weekly data. Archived data are located under the “Archives” section.
- Crop Moisture Index Map: depiects short-term (up to 4 weeks) abnormal dryness or wetness affecting agriculture.
Access
Data Tables: home page for the Palmer Drought Severity and Crop Moisture Indices.
Crop Moisture Index map: depicts short-term (up to 4 weeks) abnormal dryness or wetness affecting agriculture. Map updates weekly.
