Groundwater and Soil Moisture Conditions from GRACE Data Assimilation
National Aeronautics and Space Administration (NASA) Gravity Recovery and Climate Experiment (GRACE), National Drought Mitigation Center, University of Nebraska – Lincoln
Scientists at NASA’s Goddard Space Flight Center generate groundwater and soil moisture drought indicators each week based on data from NASA's Gravity Recovery and Climate Experiment (GRACE) and GRACE Follow On satellites, which have been collecting data since 2002. They use a computer model that combines water storage anomaly data from these GRACE satellites with a long-term meteorological dataset to produce a continuous record of soil moisture and groundwater conditions going back to1948.
The team produces both global and contiguous U.S. (CONUS) maps for surface soil moisture, root zone (1 meter) soil moisture, and shallow groundwater. The CONUS maps are produced at a 0.125 degree resolution, while the global maps are at a 0.25 degree resolution.
The drought indicators describe current wet or dry conditions, expressed as a percentile showing the probability of occurrence within the period of record (1948-2014 for CONUS and 1948-2012 for global data). Lower values (warm colors) indicate drier than normal conditions, and higher values (blues) indicate wetter than normal conditions. These are provided as both images and binary data files.
Data and maps are available at nasagrace.unl.edu through a partnership with the National Drought Mitigation Center.
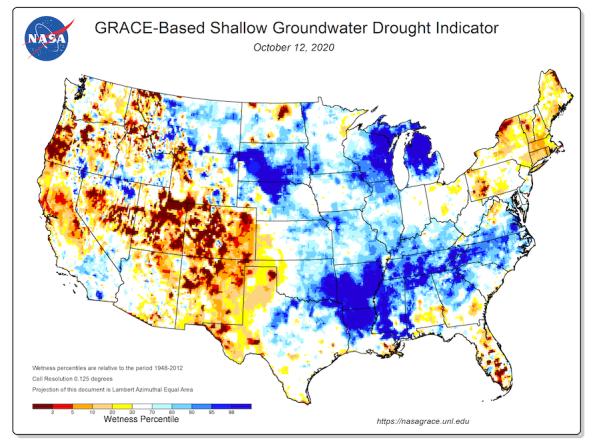
The GRACE-Based Shallow Groundwater Drought Indicator describes current groundwater conditions, expressed as a percentile showing the probability of occurrence within the period of record from 1948–2012. This product is based on terrestrial water storage observations derived from NASA GRACE satellite data and integrated with other observations, using a sophisticated numerical model of land surface water and energy processes.
Red and orange hues indicate drier groundwater conditions, while blue hues indicate wetter conditions.
The GRACE-Based Surface Soil Moisture Drought Indicator describes the current wet or dry conditions of the top 2 cm of soil, expressed as a percentile showing the probability of occurrence within the period of record from 1948–2012. This product is based on terrestrial water storage observations derived from NASA GRACE satellite data and integrated with other observations, using a sophisticated numerical model of land surface water and energy processes.
Red and orange hues indicate drier soil moisture conditions, while blue hues indicate wetter conditions.
The GRACE-Based Root Zone Soil Moisture Drought Indicator describes the current wet or dry conditions of the top 1 meter of soil, expressed as a percentile showing the probability of occurrence within the period of record from 1948–2012. This product is based on terrestrial water storage observations derived from NASA GRACE satellite data and integrated with other observations, using a sophisticated numerical model of land surface water and energy processes.
Red and orange hues indicate drier soil moisture conditions, while blue hues indicate wetter conditions.
Soil moisture plays an important role in drought and flood forecasting, agricultural monitoring, forest fire prediction, water supply management, and other natural resource activities. Soil moisture observations can forewarn of impending drought or flood conditions before other more standard indicators are triggered.
Learn MoreFlash drought is the rapid onset or intensification of drought. Unlike slow-evolving drought, which is caused by a decline in precipitation, flash drought occurs when low precipitation is accompanied by abnormally high temperatures, high winds, and/or changes in radiation. These sometimes-rapid changes can quickly raise evapotranspiration rates and remove available water from the landscape.
Learn MoreDrought can reduce the water availability and water quality necessary for productive farms, ranches, and grazing lands, resulting in significant negative direct and indirect economic impacts to the agricultural sector. Monitoring agricultural drought typically focuses on examining levels of precipitation, evaporative demand, soil moisture, and surface/groundwater quantity and quality.
Learn MoreDrought can result in reduced growth rates, increased stress on vegetation, and alterations or transformations to the plant community and/or the entire ecosystem. During periods of drought, plants increase their demand for water through increased evapotranspiration and longer growing seasons.
Learn MoreSoil moisture plays an important role in drought and flood forecasting, agricultural monitoring, forest fire prediction, water supply management, and other natural resource activities. Soil moisture observations can forewarn of impending drought or flood conditions before other more standard indicators are triggered.
Learn MoreFlash drought is the rapid onset or intensification of drought. Unlike slow-evolving drought, which is caused by a decline in precipitation, flash drought occurs when low precipitation is accompanied by abnormally high temperatures, high winds, and/or changes in radiation. These sometimes-rapid changes can quickly raise evapotranspiration rates and remove available water from the landscape.
Learn MoreDrought can reduce the water availability and water quality necessary for productive farms, ranches, and grazing lands, resulting in significant negative direct and indirect economic impacts to the agricultural sector. Monitoring agricultural drought typically focuses on examining levels of precipitation, evaporative demand, soil moisture, and surface/groundwater quantity and quality.
Learn MoreDrought can result in reduced growth rates, increased stress on vegetation, and alterations or transformations to the plant community and/or the entire ecosystem. During periods of drought, plants increase their demand for water through increased evapotranspiration and longer growing seasons.
Learn MoreShallow Groundwater: Wetness Percentile
Surface Soil Moisture: Wetness Percentile
Root Zone Soil Moisture: Wetness Percentile
The GRACE-Based Shallow Groundwater Drought Indicator describes current groundwater conditions, expressed as a percentile showing the probability of occurrence within the period of record from 1948–2012. This product is based on terrestrial water storage observations derived from NASA GRACE satellite data and integrated with other observations, using a sophisticated numerical model of land surface water and energy processes.
Red and orange hues indicate drier groundwater conditions, while blue hues indicate wetter conditions.
The GRACE-Based Surface Soil Moisture Drought Indicator describes the current wet or dry conditions of the top 2 cm of soil, expressed as a percentile showing the probability of occurrence within the period of record from 1948–2012. This product is based on terrestrial water storage observations derived from NASA GRACE satellite data and integrated with other observations, using a sophisticated numerical model of land surface water and energy processes.
Red and orange hues indicate drier soil moisture conditions, while blue hues indicate wetter conditions.
The GRACE-Based Root Zone Soil Moisture Drought Indicator describes the current wet or dry conditions of the top 1 meter of soil, expressed as a percentile showing the probability of occurrence within the period of record from 1948–2012. This product is based on terrestrial water storage observations derived from NASA GRACE satellite data and integrated with other observations, using a sophisticated numerical model of land surface water and energy processes.
Red and orange hues indicate drier soil moisture conditions, while blue hues indicate wetter conditions.
Data from NASA GRACE are updated weekly on Mondays, and this Drought.gov map is updated every Tuesday.
Data from NASA GRACE are updated weekly on Mondays, and this Drought.gov map is updated every Tuesday.
Data from NASA GRACE are updated weekly on Mondays, and this Drought.gov map is updated every Tuesday.
Soil moisture plays an important role in drought and flood forecasting, agricultural monitoring, forest fire prediction, water supply management, and other natural resource activities. Soil moisture observations can forewarn of impending drought or flood conditions before other more standard indicators are triggered.
Learn MoreFlash drought is the rapid onset or intensification of drought. Unlike slow-evolving drought, which is caused by a decline in precipitation, flash drought occurs when low precipitation is accompanied by abnormally high temperatures, high winds, and/or changes in radiation. These sometimes-rapid changes can quickly raise evapotranspiration rates and remove available water from the landscape.
Learn MoreDrought can reduce the water availability and water quality necessary for productive farms, ranches, and grazing lands, resulting in significant negative direct and indirect economic impacts to the agricultural sector. Monitoring agricultural drought typically focuses on examining levels of precipitation, evaporative demand, soil moisture, and surface/groundwater quantity and quality.
Learn MoreDrought can result in reduced growth rates, increased stress on vegetation, and alterations or transformations to the plant community and/or the entire ecosystem. During periods of drought, plants increase their demand for water through increased evapotranspiration and longer growing seasons.
Learn MoreSoil moisture plays an important role in drought and flood forecasting, agricultural monitoring, forest fire prediction, water supply management, and other natural resource activities. Soil moisture observations can forewarn of impending drought or flood conditions before other more standard indicators are triggered.
Learn MoreFlash drought is the rapid onset or intensification of drought. Unlike slow-evolving drought, which is caused by a decline in precipitation, flash drought occurs when low precipitation is accompanied by abnormally high temperatures, high winds, and/or changes in radiation. These sometimes-rapid changes can quickly raise evapotranspiration rates and remove available water from the landscape.
Learn MoreDrought can reduce the water availability and water quality necessary for productive farms, ranches, and grazing lands, resulting in significant negative direct and indirect economic impacts to the agricultural sector. Monitoring agricultural drought typically focuses on examining levels of precipitation, evaporative demand, soil moisture, and surface/groundwater quantity and quality.
Learn MoreDrought can result in reduced growth rates, increased stress on vegetation, and alterations or transformations to the plant community and/or the entire ecosystem. During periods of drought, plants increase their demand for water through increased evapotranspiration and longer growing seasons.
Learn MoreSoil moisture plays an important role in drought and flood forecasting, agricultural monitoring, forest fire prediction, water supply management, and other natural resource activities. Soil moisture observations can forewarn of impending drought or flood conditions before other more standard indicators are triggered.
Learn MoreFlash drought is the rapid onset or intensification of drought. Unlike slow-evolving drought, which is caused by a decline in precipitation, flash drought occurs when low precipitation is accompanied by abnormally high temperatures, high winds, and/or changes in radiation. These sometimes-rapid changes can quickly raise evapotranspiration rates and remove available water from the landscape.
Learn MoreDrought can reduce the water availability and water quality necessary for productive farms, ranches, and grazing lands, resulting in significant negative direct and indirect economic impacts to the agricultural sector. Monitoring agricultural drought typically focuses on examining levels of precipitation, evaporative demand, soil moisture, and surface/groundwater quantity and quality.
Learn MoreDrought can result in reduced growth rates, increased stress on vegetation, and alterations or transformations to the plant community and/or the entire ecosystem. During periods of drought, plants increase their demand for water through increased evapotranspiration and longer growing seasons.
Learn MoreAccess
Groundwater and Soil Moisture Conditions from GRACE Data Assimilation Maps: Home page for these map products, which were developed in partnership with the National Drought Mitigation Center.
Map Archive: View past maps and download them as a PNG or PDF.
Global Data Archive: Download global data from 2003 to the present.
CONUS Data Archive: Download data for the contiguous U.S. (CONUS) from 2002 to the present.
Map Comparison Slider: Compare GRACE drought indicator maps for two dates with an interactive slider.
How to
What can I do with these data?
- View weekly groundwater, root zone, and surface soil moisture maps and compare those with previous weeks.
How do I use the site?
- Roll your cursor over the different map products at the bottom of the page
- To download image, select the “.PNG” or “.PDF” icons below each map product
- View archived maps, compare maps or download data using the tabs at the top of the page.
Documentation
Getirana, A., M. Rodell, S. Kumar, H.K. Beaudoing, K. Arsenault, B. Zaitchik, H. Save, and S. Bettadpur. (2020). GRACE improves seasonal groundwater forecast initialization over the U.S., Journal of Hydrometeorology 21(1): 59-71.
Li, B., M. Rodell, S.V. Kumar, H.K. Beaudoing, A. Getirana, B.F. Zaitchik, L.G. Goncalves, C. Cossetin, S. Bhanja, A. Mukherjee, S. Tian, N. Tangdamrongsub, D. Long, J. Nanteza, J. Lee, F. Policelli, I. B. Goni, D. Daira, M. Bila, G. de Lannoy, D. Mocko, and S. C. Steele-Dunne. (2019). Global GRACE data assimilation for groundwater and drought monitoring: advances and challenges, Water Resources Research 55(9): 7564–7586.
Kumar, S.V., B.F. Zaitchik, C.D. Peters-Lidard, M. Rodell, R. Reichle, B. Li, M. Jasinski, D. Mocko, A. Getirana, G. De Lannoy, M. Cosh, C.R. Hain, and M. Anderson. (2016). Assimilation of gridded GRACE terrestrial water storage estimates in the North American Land Data Assimilation System, Journal of Hydrometeorology 17: 1951-1972.
Houborg, R., M. Rodell, B. Li, R. Reichle, and B. Zaitchik. (2012). Drought indicators based on model assimilated GRACE terrestrial water storage observations, Water Resources Research 48: W07525.
Zaitchik, B.F., M. Rodell, and R.H. Reichle. (2008). Assimilation of GRACE terrestrial water storage data into a land surface model: Results for the Mississippi River Basin, Journal of Hydrometeorology 9(3): 535-548.