U.S. Gridded Standardized Precipitation Evapotranspiration Index (SPEI) from nClimGrid-Daily
National Oceanic and Atmospheric Administration (NOAA) National Centers for Environmental Information (NCEI)
The Standardized Precipitation Evapotranspiration Index (SPEI) is a drought index that measures the difference between water supply (precipitation) and water demand (potential evapotranspiration). Potential evapotranspiration (PET) represents the "thirst" of the atmosphere and is a measure of how much water would evaporate from the ground and transpire (be released as vapor) from plants, assuming enough water was available. For these reasons, PET values can be driven by water demand factors such as temperature, sunlight, wind, and humidity. For example, warmer temperatures tend to increase evapotranspiration, which can dry the landscape and make droughts more intense. By combining these inputs, the SPEI gives us a more complete picture of water availability.
This U.S. gridded SPEI is derived from the nClimGrid-Daily dataset and includes timescales of 1, 2, and 3 weeks, as well as 1, 2, 3, 4, 6, 9, and 12 months. SPEI values near 0 represent near-normal conditions, positive values represent above-normal (wetter) conditions, and negative values represent below-normal (drier) conditions.
nClimGrid-Daily is a gridded dataset, produced by NOAA's National Centers for Environmental Information, that includes area averages of daily maximum, minimum, and average temperatures and daily precipitation amounts for the contiguous United States from January 1, 1951 to the present. Data are derived from morning and midnight observations from the Global Historical Climatology Network-Daily (GHCNd) dataset, and contain processing techniques that address the spatial and temporal variations that affect the quality and homogeneity of the fields.
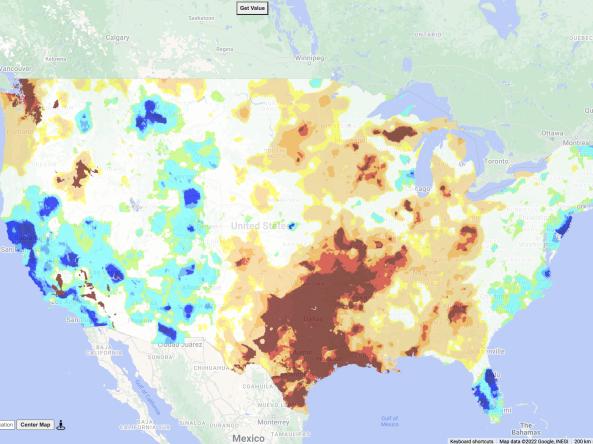
The Standardized Precipitation Evapotranspiration Index (SPEI) shows how precipitation (water supply) and potential evapotranspiration (water demand) deviate from average historical conditions for a given time range.
Warmer temperatures can increase evapotranspiration (the process by which water is transferred from the land to the atmosphere by evaporation from the soil and by transpiration from plants), which can dry the landscape. Scientists have identified evapotranspiration as an early warning indicator of flash drought.
This map shows the SPEI for the past month (30 days), based on NOAA data. Red, orange, and yellow hues indicate drier conditions, while green and blue hues indicate wetter conditions.
The Standardized Precipitation Evapotranspiration Index (SPEI) shows how precipitation (water supply) and potential evapotranspiration (water demand) deviate from average historical conditions for a given time range.
Warmer temperatures can increase evapotranspiration (the process by which water is transferred from the land to the atmosphere by evaporation from the soil and by transpiration from plants), which can dry the landscape. Scientists have identified evapotranspiration as an early warning indicator of flash drought.
This map shows the SPEI for the past 90 days, based on NOAA data. Red, orange, and yellow hues indicate drier conditions, while green and blue hues indicate wetter conditions.
The Standardized Precipitation Evapotranspiration Index (SPEI) shows how precipitation (water supply) and potential evapotranspiration (water demand) deviate from average historical conditions for a given time range.
Warmer temperatures can increase evapotranspiration (the process by which water is transferred from the land to the atmosphere by evaporation from the soil and by transpiration from plants), which can dry the landscape. Scientists have identified evapotranspiration as an early warning indicator of flash drought.
This map shows the SPEI for the past 6 months, based on NOAA data. Red, orange, and yellow hues indicate drier conditions, while green and blue hues indicate wetter conditions.
A drought index combines multiple drought indicators (e.g., precipitation, temperature, soil moisture) to depict drought conditions. For some products, like the U.S. Drought Monitor, authors combine their analysis of drought indicators with input from local observers. Other drought indices, like the Standardized Precipitation Index (SPI), use an objective calculation to describe the severity, location, timing, and/or duration of drought.
Learn MoreDrought is defined as the lack of precipitation over an extended period of time, usually for a season or more, that results in a water shortage. Changes in precipitation can substantially disrupt crops and livestock, influence the frequency and intensity of severe weather events, and affect the quality and quantity of water available for municipal and industrial use.
Learn MoreAir temperature can have wide-ranging effects on natural processes. Warmer air temperatures increase evapotranspiration—which is the combination of evaporation from the soil and bodies of water and transpiration from plants—and lower soil moisture.
Learn MoreFlash drought is the rapid onset or intensification of drought. Unlike slow-evolving drought, which is caused by a decline in precipitation, flash drought occurs when low precipitation is accompanied by abnormally high temperatures, high winds, and/or changes in radiation. These sometimes-rapid changes can quickly raise evapotranspiration rates and remove available water from the landscape.
Learn MoreA drought index combines multiple drought indicators (e.g., precipitation, temperature, soil moisture) to depict drought conditions. For some products, like the U.S. Drought Monitor, authors combine their analysis of drought indicators with input from local observers. Other drought indices, like the Standardized Precipitation Index (SPI), use an objective calculation to describe the severity, location, timing, and/or duration of drought.
Learn MoreDrought is defined as the lack of precipitation over an extended period of time, usually for a season or more, that results in a water shortage. Changes in precipitation can substantially disrupt crops and livestock, influence the frequency and intensity of severe weather events, and affect the quality and quantity of water available for municipal and industrial use.
Learn MoreAir temperature can have wide-ranging effects on natural processes. Warmer air temperatures increase evapotranspiration—which is the combination of evaporation from the soil and bodies of water and transpiration from plants—and lower soil moisture.
Learn MoreFlash drought is the rapid onset or intensification of drought. Unlike slow-evolving drought, which is caused by a decline in precipitation, flash drought occurs when low precipitation is accompanied by abnormally high temperatures, high winds, and/or changes in radiation. These sometimes-rapid changes can quickly raise evapotranspiration rates and remove available water from the landscape.
Learn MoreDry Conditions
D4 (-2.0 or less)
The Standardized Precipitation Evapotranspiration Index (SPEI) value for this location is -2.0 or less, indicating exceptional drought (D4) conditions.
D3 (-1.9 to -1.6)
The Standardized Precipitation Evapotranspiration Index (SPEI) value for this location is between -1.9 to -1.6, indicating extreme drought (D3) conditions.
D2 (-1.5 to -1.3)
The Standardized Precipitation Evapotranspiration Index (SPEI) value for this location is between -1.5 to -1.3, indicating severe drought (D2) conditions.
D1 (-1.2 to -0.8)
The Standardized Precipitation Evapotranspiration Index (SPEI) value for this location is between -1.2 to -0.8, indicating moderate drought (D1) conditions.
D0 (-0.7 to -0.5)
The Standardized Precipitation Evapotranspiration Index (SPEI) value for this location is between -0.7 to -0.5, indicating abnormally dry (D0) conditions.
Wet Conditions
W0 (0.5 to 0.7)
The Standardized Precipitation Evapotranspiration Index (SPEI) value for this location is between 0.5 to 0.7, indicating abnormally wet (W0) conditions.
W1 (0.8 to 1.2)
The Standardized Precipitation Evapotranspiration Index (SPEI) value for this location is between 0.8 to 1.2, indicating moderate wet (W1) conditions.
W2 (1.3 to 1.5)
The Standardized Precipitation Evapotranspiration Index (SPEI) value for this location is between 1.3 to 1.5, indicating severe wet (W2) conditions.
W3 (1.6 to 1.9)
The Standardized Precipitation Evapotranspiration Index (SPEI) value for this location is between 1.6 to 1.9, indicating extreme wet (W3) conditions.
W4 (2.0 or more)
The Standardized Precipitation Evapotranspiration Index (SPEI) value for this location is 2.0 or greater, indicating exceptional wet (W4) conditions.
Dry Conditions
D4 (-2.0 or less)
The Standardized Precipitation Evapotranspiration Index (SPEI) value for this location is -2.0 or less, indicating exceptional drought (D4) conditions.
D3 (-1.9 to -1.6)
The Standardized Precipitation Evapotranspiration Index (SPEI) value for this location is between -1.9 to -1.6, indicating extreme drought (D3) conditions.
D2 (-1.5 to -1.3)
The Standardized Precipitation Evapotranspiration Index (SPEI) value for this location is between -1.5 to -1.3, indicating severe drought (D2) conditions.
D1 (-1.2 to -0.8)
The Standardized Precipitation Evapotranspiration Index (SPEI) value for this location is between -1.2 to -0.8, indicating moderate drought (D1) conditions.
D0 (-0.7 to -0.5)
The Standardized Precipitation Evapotranspiration Index (SPEI) value for this location is between -0.7 to -0.5, indicating abnormally dry (D0) conditions.
Wet Conditions
W0 (0.5 to 0.7)
The Standardized Precipitation Evapotranspiration Index (SPEI) value for this location is between 0.5 to 0.7, indicating abnormally wet (W0) conditions.
W1 (0.8 to 1.2)
The Standardized Precipitation Evapotranspiration Index (SPEI) value for this location is between 0.8 to 1.2, indicating moderate wet (W1) conditions.
W2 (1.3 to 1.5)
The Standardized Precipitation Evapotranspiration Index (SPEI) value for this location is between 1.3 to 1.5, indicating severe wet (W2) conditions.
W3 (1.6 to 1.9)
The Standardized Precipitation Evapotranspiration Index (SPEI) value for this location is between 1.6 to 1.9, indicating extreme wet (W3) conditions.
W4 (2.0 or more)
The Standardized Precipitation Evapotranspiration Index (SPEI) value for this location is 2.0 or greater, indicating exceptional wet (W4) conditions.
The Standardized Precipitation Evapotranspiration Index (SPEI) shows how precipitation (water supply) and potential evapotranspiration (water demand) deviate from average historical conditions for a given time range.
Warmer temperatures can increase evapotranspiration (the process by which water is transferred from the land to the atmosphere by evaporation from the soil and by transpiration from plants), which can dry the landscape. Scientists have identified evapotranspiration as an early warning indicator of flash drought.
This map shows the SPEI for the past month (30 days), based on NOAA data. Red, orange, and yellow hues indicate drier conditions, while green and blue hues indicate wetter conditions.
The Standardized Precipitation Evapotranspiration Index (SPEI) shows how precipitation (water supply) and potential evapotranspiration (water demand) deviate from average historical conditions for a given time range.
Warmer temperatures can increase evapotranspiration (the process by which water is transferred from the land to the atmosphere by evaporation from the soil and by transpiration from plants), which can dry the landscape. Scientists have identified evapotranspiration as an early warning indicator of flash drought.
This map shows the SPEI for the past 90 days, based on NOAA data. Red, orange, and yellow hues indicate drier conditions, while green and blue hues indicate wetter conditions.
The Standardized Precipitation Evapotranspiration Index (SPEI) shows how precipitation (water supply) and potential evapotranspiration (water demand) deviate from average historical conditions for a given time range.
Warmer temperatures can increase evapotranspiration (the process by which water is transferred from the land to the atmosphere by evaporation from the soil and by transpiration from plants), which can dry the landscape. Scientists have identified evapotranspiration as an early warning indicator of flash drought.
This map shows the SPEI for the past 6 months, based on NOAA data. Red, orange, and yellow hues indicate drier conditions, while green and blue hues indicate wetter conditions.
SPEI data are updated daily, with a delay of 3–4 days.
SPEI data are updated daily, with a delay of 3–4 days.
SPEI data are updated daily, with a delay of 3–4 days.
A drought index combines multiple drought indicators (e.g., precipitation, temperature, soil moisture) to depict drought conditions. For some products, like the U.S. Drought Monitor, authors combine their analysis of drought indicators with input from local observers. Other drought indices, like the Standardized Precipitation Index (SPI), use an objective calculation to describe the severity, location, timing, and/or duration of drought.
Learn MoreDrought is defined as the lack of precipitation over an extended period of time, usually for a season or more, that results in a water shortage. Changes in precipitation can substantially disrupt crops and livestock, influence the frequency and intensity of severe weather events, and affect the quality and quantity of water available for municipal and industrial use.
Learn MoreAir temperature can have wide-ranging effects on natural processes. Warmer air temperatures increase evapotranspiration—which is the combination of evaporation from the soil and bodies of water and transpiration from plants—and lower soil moisture.
Learn MoreFlash drought is the rapid onset or intensification of drought. Unlike slow-evolving drought, which is caused by a decline in precipitation, flash drought occurs when low precipitation is accompanied by abnormally high temperatures, high winds, and/or changes in radiation. These sometimes-rapid changes can quickly raise evapotranspiration rates and remove available water from the landscape.
Learn MoreA drought index combines multiple drought indicators (e.g., precipitation, temperature, soil moisture) to depict drought conditions. For some products, like the U.S. Drought Monitor, authors combine their analysis of drought indicators with input from local observers. Other drought indices, like the Standardized Precipitation Index (SPI), use an objective calculation to describe the severity, location, timing, and/or duration of drought.
Learn MoreDrought is defined as the lack of precipitation over an extended period of time, usually for a season or more, that results in a water shortage. Changes in precipitation can substantially disrupt crops and livestock, influence the frequency and intensity of severe weather events, and affect the quality and quantity of water available for municipal and industrial use.
Learn MoreAir temperature can have wide-ranging effects on natural processes. Warmer air temperatures increase evapotranspiration—which is the combination of evaporation from the soil and bodies of water and transpiration from plants—and lower soil moisture.
Learn MoreFlash drought is the rapid onset or intensification of drought. Unlike slow-evolving drought, which is caused by a decline in precipitation, flash drought occurs when low precipitation is accompanied by abnormally high temperatures, high winds, and/or changes in radiation. These sometimes-rapid changes can quickly raise evapotranspiration rates and remove available water from the landscape.
Learn MoreA drought index combines multiple drought indicators (e.g., precipitation, temperature, soil moisture) to depict drought conditions. For some products, like the U.S. Drought Monitor, authors combine their analysis of drought indicators with input from local observers. Other drought indices, like the Standardized Precipitation Index (SPI), use an objective calculation to describe the severity, location, timing, and/or duration of drought.
Learn MoreDrought is defined as the lack of precipitation over an extended period of time, usually for a season or more, that results in a water shortage. Changes in precipitation can substantially disrupt crops and livestock, influence the frequency and intensity of severe weather events, and affect the quality and quantity of water available for municipal and industrial use.
Learn MoreAir temperature can have wide-ranging effects on natural processes. Warmer air temperatures increase evapotranspiration—which is the combination of evaporation from the soil and bodies of water and transpiration from plants—and lower soil moisture.
Learn MoreFlash drought is the rapid onset or intensification of drought. Unlike slow-evolving drought, which is caused by a decline in precipitation, flash drought occurs when low precipitation is accompanied by abnormally high temperatures, high winds, and/or changes in radiation. These sometimes-rapid changes can quickly raise evapotranspiration rates and remove available water from the landscape.
Learn MoreHow to
How to use this site:
- Datasets are in netCDF format.
- The netCDF files are readable by many software packages.
Access
Access nClimGrid-Daily Data from NCEI:
Access nClimGrid-Daily SPEI Maps:
Documentation & Metadata
- nClimGrid-Daily Metadata
- User Guide: Provides basic information, references with additional information, and points of contact for the collection and processing of nClimGrid-Daily.
- Dataset Documentation Downloads:
- Journal Article: Durre, Imke, Anthony Arguez, Carl J. Schreck III, Michael F. Squires, and Russell S. Vose. (2022.) Daily High-Resolution Temperature and Precipitation Fields for the Contiguous United States from 1951 to Present. Journal of Atmospheric and Oceanic Technology.