Gridded Climate Datasets: NOAA's nClimGrid - Daily
National Oceanic and Atmospheric Administration (NOAA) National Centers for Environmental Information (NCEI)
nClimGrid-Daily is a gridded dataset from NOAA's National Centers for Environmental Information (NCEI) that includes area averages of daily maximum, minimum, and average temperatures and daily precipitation amounts for the contiguous United States from January 1, 1951 to the present. The dataset is designed for climate monitoring and other applications that rely on placing event-specific meteorological patterns into a long-term historical context. Data are derived from morning and midnight observations from the Global Historical Climatology Network-Daily (GHCNd) dataset, and contain processing techniques that address the spatial and temporal variations that affect the quality and homogeneity of the fields.
Area averages are available for common regional groupings, including census tracts, counties, climate divisions, states, major hydrologic units, and Weather Forecast Office regions. Data are also available for report-specific regions from NCEI's climate monitoring reports and the Fifth National Climate Assessment (NCA5).
The nClimGrid-Daily auxiliary product provides daily gridded fields of counts of the number of Tmax, Tmin, and Prcp observations within 48.3 km (30 miles) of each grid point. These counts were designed to help the U.S. Army Corps of Engineers determine uncertainty in the grid point estimates.
This map shows the average maximum daily temperature for the past 7 days compared to the historical average (1991–2020) for the same 7 days, based on climate data from NOAA's nClimGrid-Daily dataset. Negative values (blue hues) indicate colder than normal temperatures, and positive values (red hues) indicate warmer than normal temperatures.
This map shows the average maximum daily temperature for the past 30 days compared to the historical average (1991–2020) for the same 30 days, based on climate data from NOAA's nClimGrid-Daily dataset. Negative values (blue hues) indicate colder than normal temperatures, and positive values (red hues) indicate warmer than normal temperatures.
Air temperature can have wide-ranging effects on natural processes. Warmer air temperatures increase evapotranspiration—which is the combination of evaporation from the soil and bodies of water and transpiration from plants—and lower soil moisture.
Learn MoreDrought can reduce the water availability and water quality necessary for productive farms, ranches, and grazing lands, resulting in significant negative direct and indirect economic impacts to the agricultural sector. Monitoring agricultural drought typically focuses on examining levels of precipitation, evaporative demand, soil moisture, and surface/groundwater quantity and quality.
Learn MoreAir temperature can have wide-ranging effects on natural processes. Warmer air temperatures increase evapotranspiration—which is the combination of evaporation from the soil and bodies of water and transpiration from plants—and lower soil moisture.
Learn MoreDrought can reduce the water availability and water quality necessary for productive farms, ranches, and grazing lands, resulting in significant negative direct and indirect economic impacts to the agricultural sector. Monitoring agricultural drought typically focuses on examining levels of precipitation, evaporative demand, soil moisture, and surface/groundwater quantity and quality.
Learn MoreDeparture from Normal Max Temperature (°F)
>8°F Below Normal
The average maximum temperature was more than 8°F colder than normal for this location.
6–8°F Below Normal
The average maximum temperature was 6–8°F colder than normal for this location.
4–6°F Below Normal
The average maximum temperature was 4–6°F colder than normal for this location.
3–4°F Below Normal
The average maximum temperature was 3–4°F colder than normal for this location.
1–3°F Below Normal
The average maximum temperature was 1–3°F colder than normal for this location.
0–1°F Below Normal
The average maximum temperature was 0–1°F colder than normal for this location.
0–1°F Above Normal
The average maximum temperature was 0–1°F warmer than normal for this location.
1–3°F Above Normal
The average maximum temperature was 1–3°F warmer than normal for this location.
3–4°F Above Normal
The average maximum temperature was 3–4°F warmer than normal for this location.
4–6°F Above Normal
The average maximum temperature was 4–6°F warmer than normal for this location.
6–8°F Above Normal
The average maximum temperature was 6–8°F warmer than normal for this location.
>8°F Above Normal
The average maximum temperature was more than 8°F warmer than normal for this location.
Departure from Normal Max Temperature (°F)
>8°F Below Normal
The average maximum temperature was more than 8°F colder than normal for this location.
6–8°F Below Normal
The average maximum temperature was 6–8°F colder than normal for this location.
4–6°F Below Normal
The average maximum temperature was 4–6°F colder than normal for this location.
3–4°F Below Normal
The average maximum temperature was 3–4°F colder than normal for this location.
1–3°F Below Normal
The average maximum temperature was 1–3°F colder than normal for this location.
0–1°F Below Normal
The average maximum temperature was 0–1°F colder than normal for this location.
0–1°F Above Normal
The average maximum temperature was 0–1°F warmer than normal for this location.
1–3°F Above Normal
The average maximum temperature was 1–3°F warmer than normal for this location.
3–4°F Above Normal
The average maximum temperature was 3–4°F warmer than normal for this location.
4–6°F Above Normal
The average maximum temperature was 4–6°F warmer than normal for this location.
6–8°F Above Normal
The average maximum temperature was 6–8°F warmer than normal for this location.
>8°F Above Normal
The average maximum temperature was more than 8°F warmer than normal for this location.
This map shows the average maximum daily temperature for the past 7 days compared to the historical average (1991–2020) for the same 7 days, based on climate data from NOAA's nClimGrid-Daily dataset. Negative values (blue hues) indicate colder than normal temperatures, and positive values (red hues) indicate warmer than normal temperatures.
This map shows the average maximum daily temperature for the past 30 days compared to the historical average (1991–2020) for the same 30 days, based on climate data from NOAA's nClimGrid-Daily dataset. Negative values (blue hues) indicate colder than normal temperatures, and positive values (red hues) indicate warmer than normal temperatures.
Temperature data from NOAA's nClimGrid-Daily dataset are updated daily, with a delay of 3 to 4 days to allow for data collection and quality control.
Temperature data from NOAA's nClimGrid-Daily dataset are updated daily, with a delay of 3 to 4 days to allow for data collection and quality control.
Air temperature can have wide-ranging effects on natural processes. Warmer air temperatures increase evapotranspiration—which is the combination of evaporation from the soil and bodies of water and transpiration from plants—and lower soil moisture.
Learn MoreDrought can reduce the water availability and water quality necessary for productive farms, ranches, and grazing lands, resulting in significant negative direct and indirect economic impacts to the agricultural sector. Monitoring agricultural drought typically focuses on examining levels of precipitation, evaporative demand, soil moisture, and surface/groundwater quantity and quality.
Learn MoreAir temperature can have wide-ranging effects on natural processes. Warmer air temperatures increase evapotranspiration—which is the combination of evaporation from the soil and bodies of water and transpiration from plants—and lower soil moisture.
Learn MoreDrought can reduce the water availability and water quality necessary for productive farms, ranches, and grazing lands, resulting in significant negative direct and indirect economic impacts to the agricultural sector. Monitoring agricultural drought typically focuses on examining levels of precipitation, evaporative demand, soil moisture, and surface/groundwater quantity and quality.
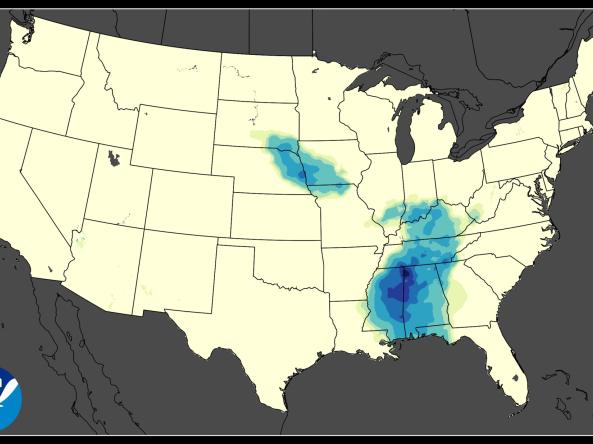
Learn MoreThis map shows precipitation over the past 30 days as a percentage of the historical average (1991–2020) for the same 30 days, based on climate data from NOAA's nClimGrid-Daily dataset. Negative values (brown hues) indicate below-normal precipitation, and positive values (blue/green hues) indicate above-normal precipitation.
This map shows precipitation over the past 60 days as a percentage of the historical average (1991–2020) for the same 60 days, based on climate data from NOAA's nClimGrid-Daily dataset. Negative values (brown hues) indicate below-normal precipitation, and positive values (blue/green hues) indicate above-normal precipitation.
Drought is defined as the lack of precipitation over an extended period of time, usually for a season or more, that results in a water shortage. Changes in precipitation can substantially disrupt crops and livestock, influence the frequency and intensity of severe weather events, and affect the quality and quantity of water available for municipal and industrial use.
Learn MorePeriods of drought can lead to inadequate water supply, threatening the health, safety, and welfare of communities. Streamflow, groundwater, reservoir, and snowpack data are key to monitoring and forecasting water supply.
Learn MoreDrought is defined as the lack of precipitation over an extended period of time, usually for a season or more, that results in a water shortage. Changes in precipitation can substantially disrupt crops and livestock, influence the frequency and intensity of severe weather events, and affect the quality and quantity of water available for municipal and industrial use.
Learn MorePeriods of drought can lead to inadequate water supply, threatening the health, safety, and welfare of communities. Streamflow, groundwater, reservoir, and snowpack data are key to monitoring and forecasting water supply.
Learn MorePrecipitation Shown as a Percentage of Normal Conditions
<25% of Normal
Precipitation was only 0% to 25% of the historical average for this location, compared to the same date range from 1991–2020.
25%–50% of Normal
Precipitation was 25% to 50% of the historical average for this location, compared to the same date range from 1991–2020.
50%–75% of Normal
Precipitation was 50% to 75% of the historical average for this location, compared to the same date range from 1991–2020.
75%–100% of Normal
Precipitation was 75% to 100% of the historical average for this location, compared to the same date range from 1991–2020.
100%–150% of Normal
Precipitation was 100% to 150% of the historical average for this location, compared to the same date range from 1991–2020.
150%–200% of Normal
Precipitation was 150% to 200% of the historical average for this location, compared to the same date range from 1991–2020.
200%–300% of Normal
Precipitation was 200% to 300% of the historical average for this location, compared to the same date range from 1991–2020.
>300% of Normal
Precipitation was greater than 300% of the historical average for this location, compared to the same date range from 1991–2020.
Precipitation Shown as a Percentage of Normal Conditions
<25% of Normal
Precipitation was only 0% to 25% of the historical average for this location, compared to the same date range from 1991–2020.
25%–50% of Normal
Precipitation was 25% to 50% of the historical average for this location, compared to the same date range from 1991–2020.
50%–75% of Normal
Precipitation was 50% to 75% of the historical average for this location, compared to the same date range from 1991–2020.
75%–100% of Normal
Precipitation was 75% to 100% of the historical average for this location, compared to the same date range from 1991–2020.
100%–150% of Normal
Precipitation was 100% to 150% of the historical average for this location, compared to the same date range from 1991–2020.
150%–200% of Normal
Precipitation was 150% to 200% of the historical average for this location, compared to the same date range from 1991–2020.
200%–300% of Normal
Precipitation was 200% to 300% of the historical average for this location, compared to the same date range from 1991–2020.
>300% of Normal
Precipitation was greater than 300% of the historical average for this location, compared to the same date range from 1991–2020.
This map shows precipitation over the past 30 days as a percentage of the historical average (1991–2020) for the same 30 days, based on climate data from NOAA's nClimGrid-Daily dataset. Negative values (brown hues) indicate below-normal precipitation, and positive values (blue/green hues) indicate above-normal precipitation.
This map shows precipitation over the past 60 days as a percentage of the historical average (1991–2020) for the same 60 days, based on climate data from NOAA's nClimGrid-Daily dataset. Negative values (brown hues) indicate below-normal precipitation, and positive values (blue/green hues) indicate above-normal precipitation.
Precipitation data from NOAA's nClimGrid-Daily dataset are updated daily, with a delay of 3 to 4 days to allow for data collection and quality control.
Precipitation data from NOAA's nClimGrid-Daily dataset are updated daily, with a delay of 3 to 4 days to allow for data collection and quality control.
Drought is defined as the lack of precipitation over an extended period of time, usually for a season or more, that results in a water shortage. Changes in precipitation can substantially disrupt crops and livestock, influence the frequency and intensity of severe weather events, and affect the quality and quantity of water available for municipal and industrial use.
Learn MorePeriods of drought can lead to inadequate water supply, threatening the health, safety, and welfare of communities. Streamflow, groundwater, reservoir, and snowpack data are key to monitoring and forecasting water supply.
Learn MoreDrought is defined as the lack of precipitation over an extended period of time, usually for a season or more, that results in a water shortage. Changes in precipitation can substantially disrupt crops and livestock, influence the frequency and intensity of severe weather events, and affect the quality and quantity of water available for municipal and industrial use.
Learn MorePeriods of drought can lead to inadequate water supply, threatening the health, safety, and welfare of communities. Streamflow, groundwater, reservoir, and snowpack data are key to monitoring and forecasting water supply.
Learn MoreHow to
How to use this site:
- Datasets are in text, CSV, netCDF and cloud-optimized geotiff (COG) formats.
- The netCDF and geotiff/cog files are readable by many software packages.
- In addition to FTP access, the nClimGrid-Daily files are now available via web-accessible folders and THREDDS catalogs.
Access
Documentation
- nClimGrid-Daily Metadata
- User Guide: Provides basic information, references with additional information, and points of contact for the collection and processing of nClimGrid-Daily.
- Dataset Documentation Downloads:
- Journal Article: Durre, Imke, Anthony Arguez, Carl J. Schreck III, Michael F. Squires, and Russell S. Vose. (2022.) Daily High-Resolution Temperature and Precipitation Fields for the Contiguous United States from 1951 to Present. Journal of Atmospheric and Oceanic Technology.