NCEI Climate at a Glance (CAG) Temperature Anomalies
National Oceanic and Atmospheric Administration (NOAA) National Centers for Environmental Information (NCEI)
The global-scale Climate at a Glance (CAG) temperature anomaly data is derived from the Global Historical Climatology Network-Monthly (GHCN-M) data set and International Comprehensive Ocean-Atmosphere Data Set (ICOADS). This tool provides an analysis of monthly and annual temperatures for the globe and is intended for the study of climate variability and change.
How to
What can I do with this?
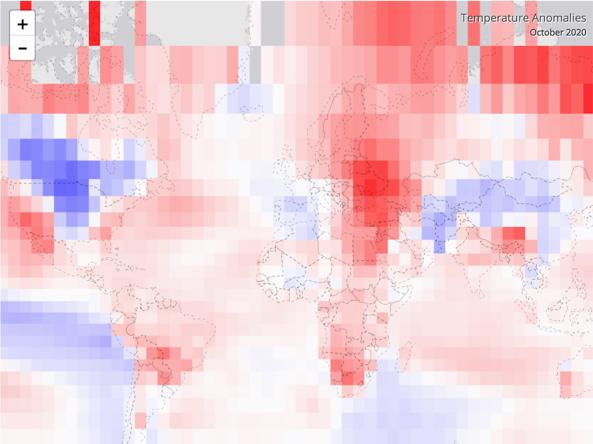
Map of Temperature Anomalies View a map of temperature anomalies at various spatial scales including global, national, regional, satewide, divisional, county, and city
Time Series View a graph of temperature anomalies over a specified period of time for the selected spatial scale
Temperature Rankings Identify temperature ranking of specified month and year for the selected spatial scale
Haywood Plot View a haywood plot graph of the selected spatial scale with top ranked years for abnormally warm and cold identified
Access
Climate at a Glance Temperature Anomalies: Global Mapping Page
Climate at a Glance Temperature Anomalies Data: Monthly NetCDF available through NCEI THREDDS data server
Documentation
Helpful links to general information, specific technical instructions, and referenced articles related to this dataset.
Climate at a Glance Temperature Anomalies Background Information