Study Finds Regional and Demographic Increases of Respiratory Mortality During Drought
As with many other climate-related disasters, drought can lead to negative health outcomes. The significant impacts that drought can have on respiratory illness, such as bronchitis, Chronic obstructive pulmonary disease (COPD), and asthma, are of particular concern. Drier conditions can increase dust, smoke, and other particulate matter, contributing to reduced air quality that exacerbates these existing respiratory illnesses. As the impacts of climate change become more apparent, there has been a growing interest in understanding these potential relationships.
To better understand the negative impacts of drought on respiratory mortality, a new NIDIS-funded study, published in the International Journal of Environmental Research and Public Health, examined the effects of monthly drought exposure on respiratory-related deaths in different U.S. NOAA climate regions from 2000–2018. The investigation used different drought indicators, namely, the United States Drought Monitor (USDM) and the 6-month and 12-month Evaporative Demand Drought Index (EDDI), to capture the severity of medium- to long-term droughts.
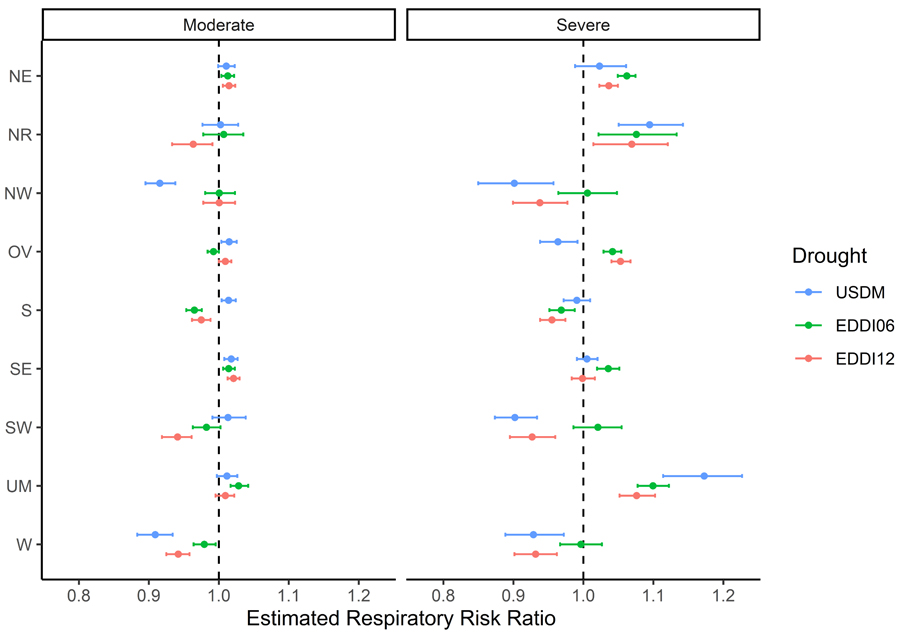
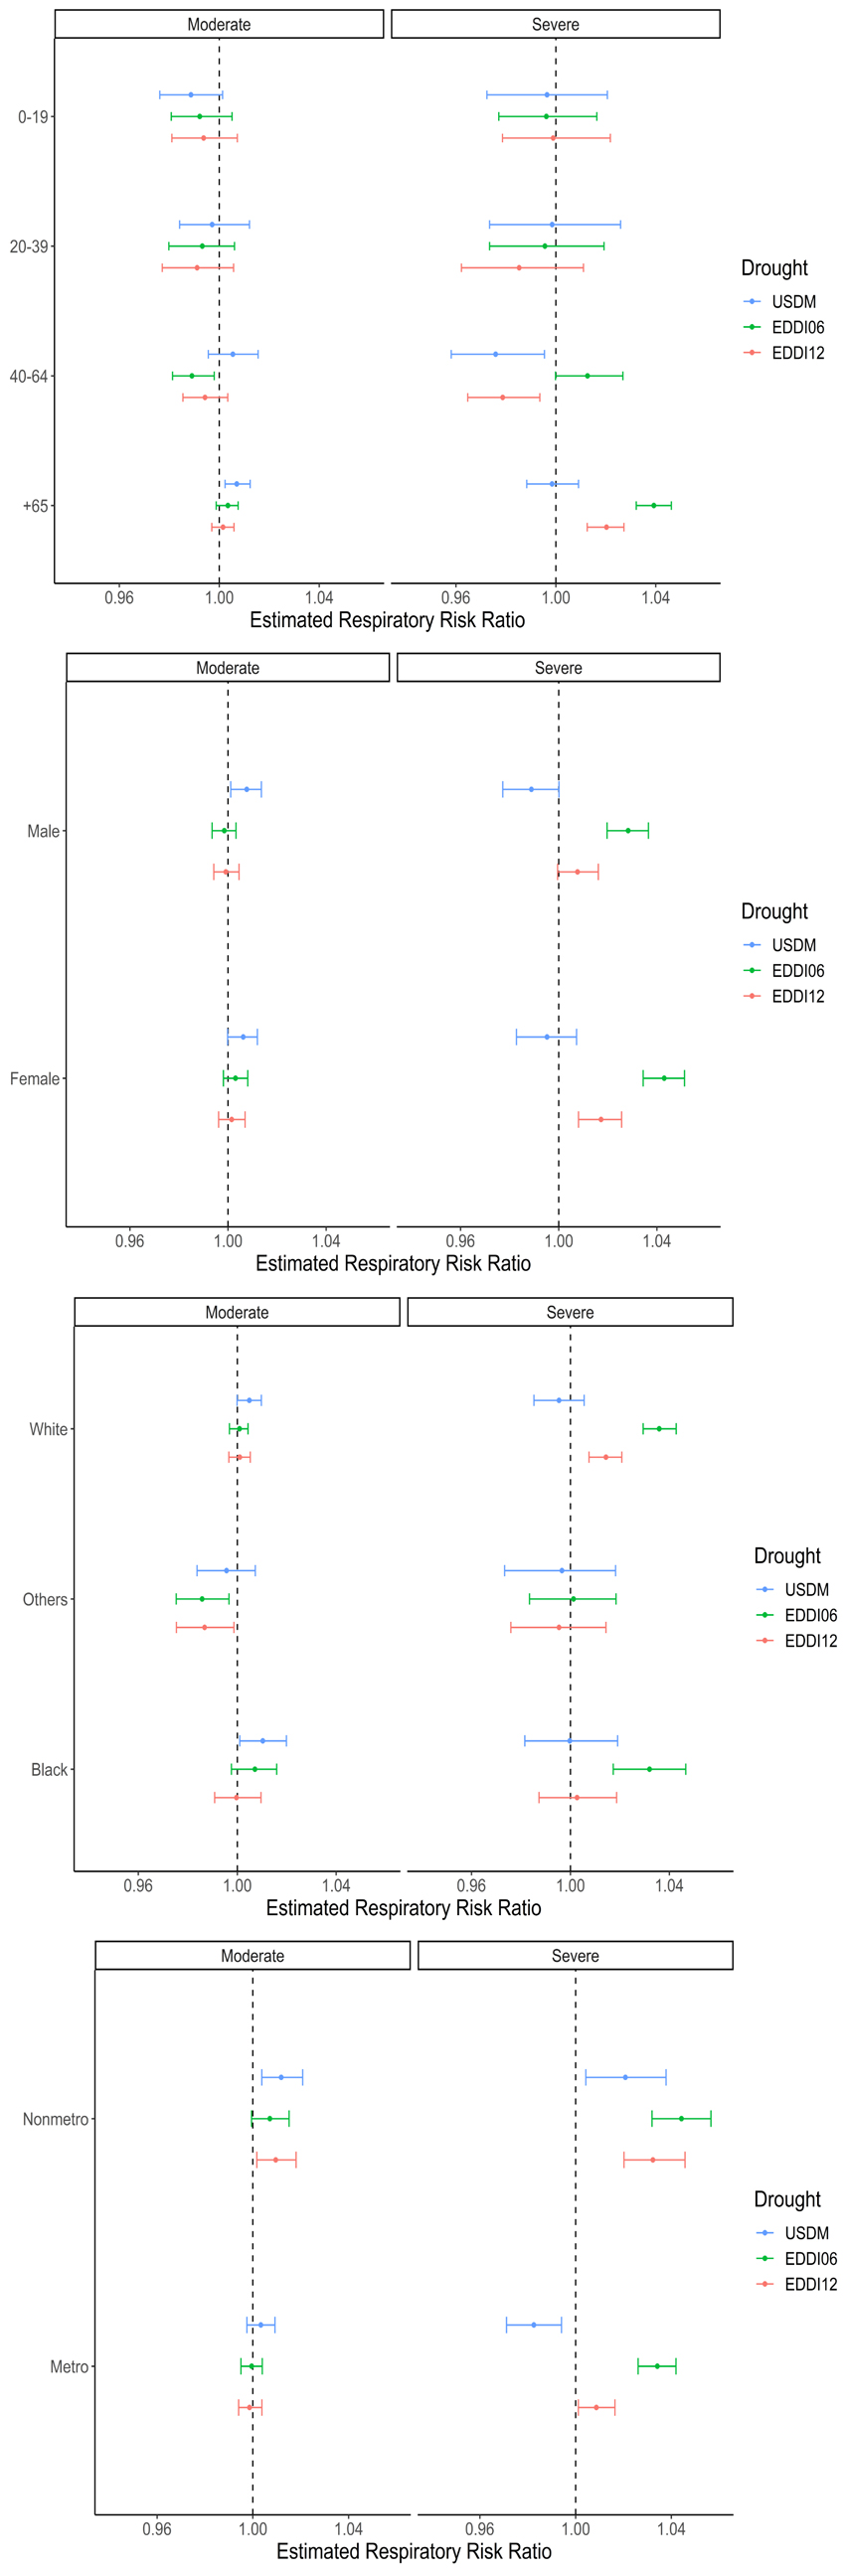
As opposed to regions that are frequently in drought, the study found that geographical regions with fewer drought events (derived from USDM drought categories) had a higher respiratory mortality risk ratio. During moderate and severe drought exposure, the respiratory mortality risk ratio in the general population increased up to 6.0% in the Northeast, 9.0% in the Northern Rockies and Plains, 5.2% in the Ohio Valley, 3.5% in the Southeast, and 15.9% in the Upper Midwest. Other regions showed protective or no effects from drought exposure. The researchers presume that the protective or no effects are the result of more complex interactions between drought and respiratory mortality in specific locations, but research is required to determine whether or not a potential association exists. The results also showed that age, ethnicity, sex, and urbanicity resulted in more affected population subgroups in certain climate regions.
Results of this study provide a valuable insight into the negative impact of drought on respiratory mortality in different U.S. climate regions, which can be utilized by public health practitioners and officers to provide early warnings to the public, develop targeted mitigation strategies, and design messaging to populations of higher concern.
This study was funded in part by NIDIS through a research project led by the University of Nebraska Medical Center—Evaluation of Drought Indicators for Improved Decision-Making in Public Health and Emergency Preparedness: Reducing Drought’s Burden on Health. Learn more about this research, or read the journal article.