Summer 2023 in Review: A Look Back at Drought Across the U.S. in 10 Maps
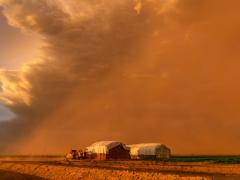
We’re just days away from turning the page from summer to fall. Drought in the United States expanded and intensified in Summer 2023, largely influenced by not only lack of precipitation, but extreme heat and evaporative demand. While the number and size of wildfires were relatively small in the western U.S. compared to recent summers, unhealthy levels of smoke still poured into the contiguous United States from record-breaking Canadian wildfires, and a wildfire in dry Maui destroyed the town of Lahaina.
The maps below show how precipitation, temperature, and evaporative demand influenced drought and wildfires across the United States and Canada during Summer 2023.
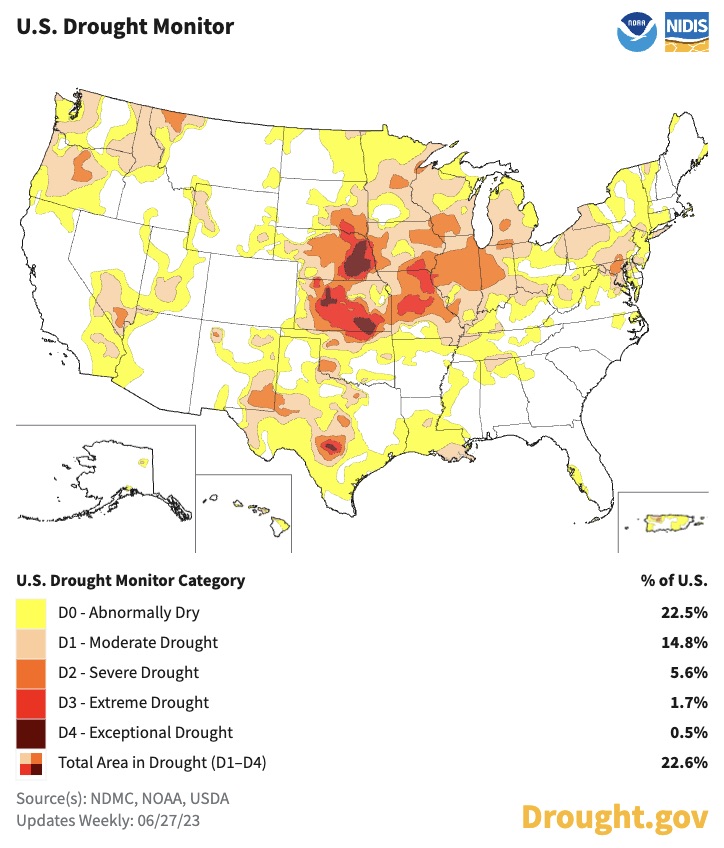
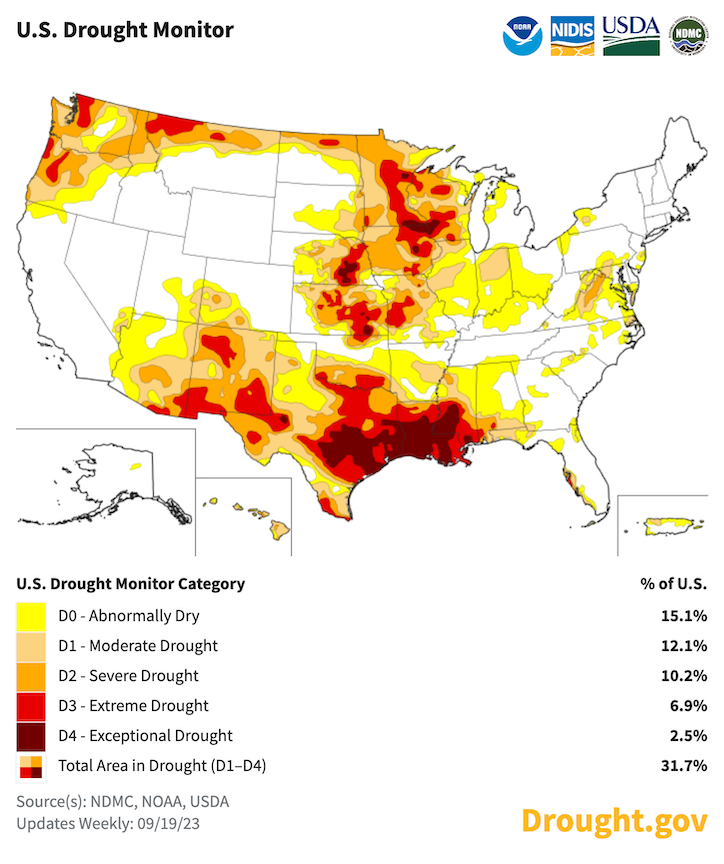
Summer Began With the Worst Drought in the Plains and Midwest and Ended With the Worst Drought Across the Southern U.S.
The first U.S. Drought Monitor issued this summer was on June 27, 2023. As shown on the first map below, after an epically wet winter in much of the West, drought was only present in the Northwest, a few pockets in western Wyoming, and the Southwest. The worst drought in the U.S. was on the Central Plains (Nebraska, Kansas) and east into the Midwest (Iowa, Missouri). While not as bad, most of the rest of the Midwest was still Abnormally Dry (D0) or in drought. Same for the Mid-Atlantic. Farther south, Texas had an area in Extreme/Exceptional Drought (D3–D4), but was mostly dealing with Abnormally Dry (D0) to Moderate Drought (D1) conditions. The same is true for Louisiana into Mississippi. Hawaii had dryness and drought, particularly on Maui. Overall, 22.6% of the U.S. was in drought.
This week’s U.S. Drought Monitor will be the last of Summer 2023. In general, areas in drought stayed in drought or worsened, and new drought developed. The worst hit areas this summer received little rain and a lot of extreme heat. This particularly applies across the southern U.S. from New Mexico to Alabama, including Texas, Louisiana, and Mississippi. Meanwhile, conditions have improved a bit in the Central Plains and Midwest, and Mid-Atlantic. Conditions have deteriorated further in parts of the Pacific Northwest, Upper Midwest, and Hawaii. Overall, 31.7% of the U.S. is in drought.
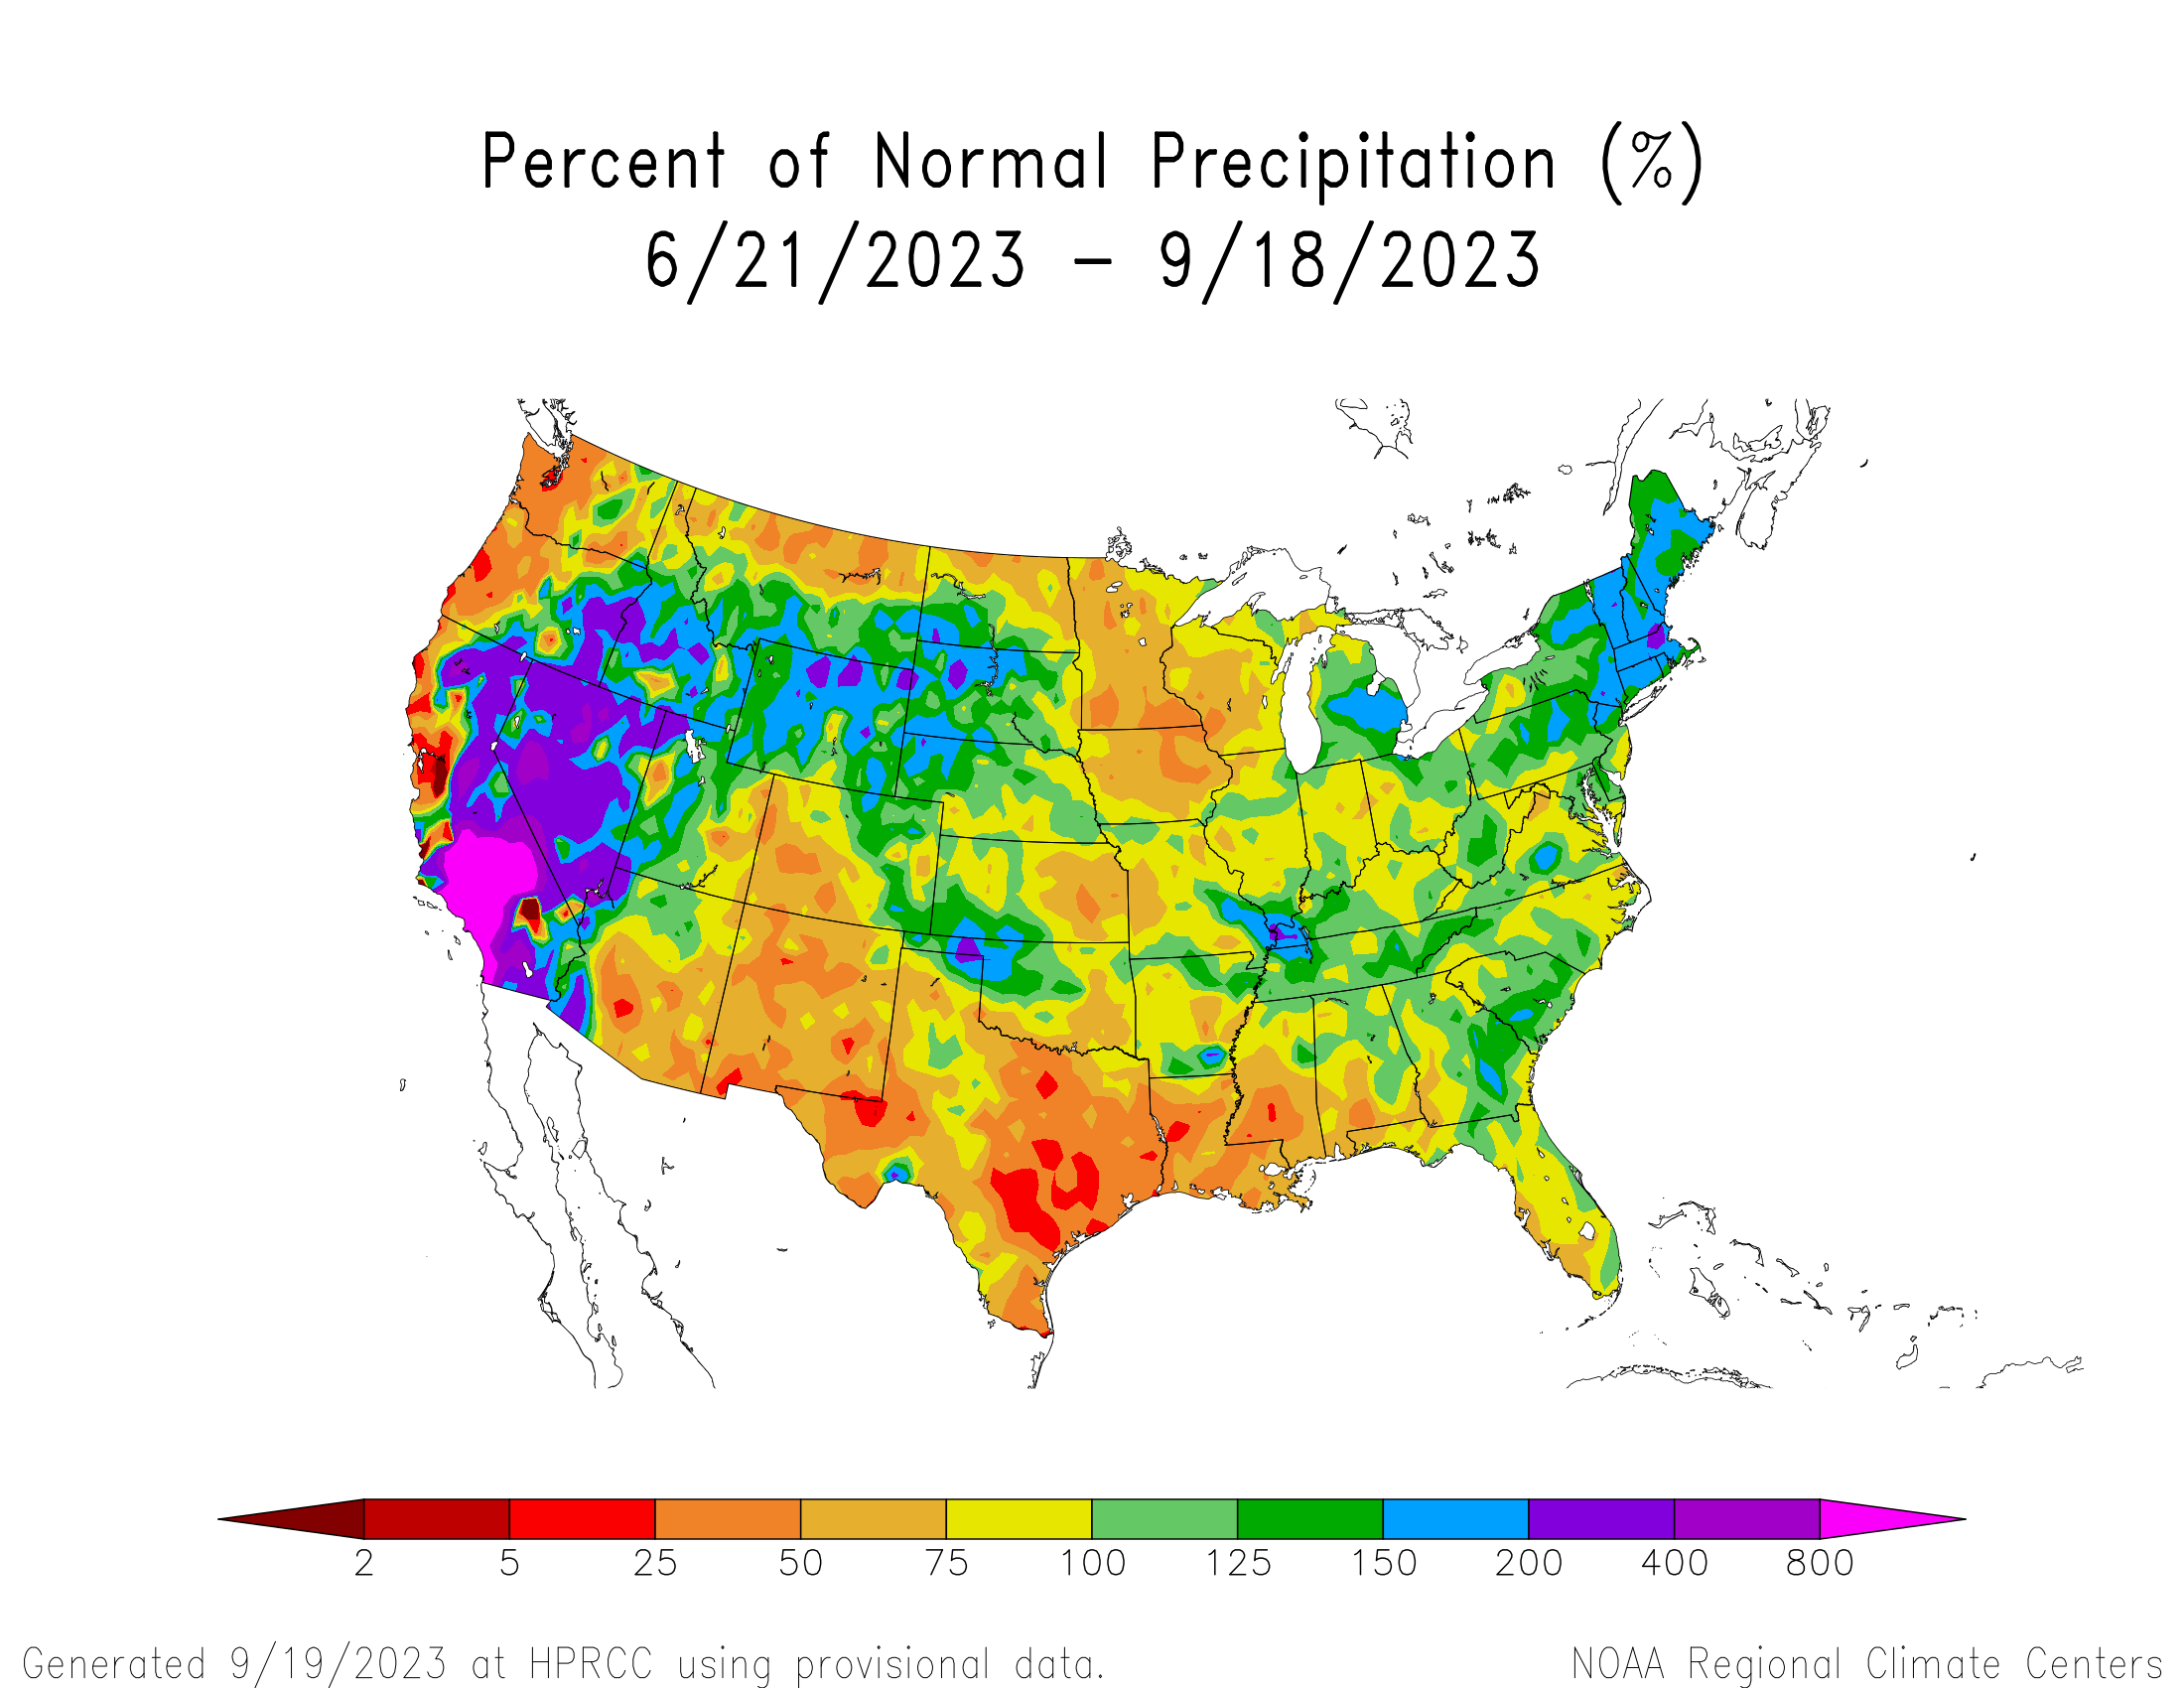
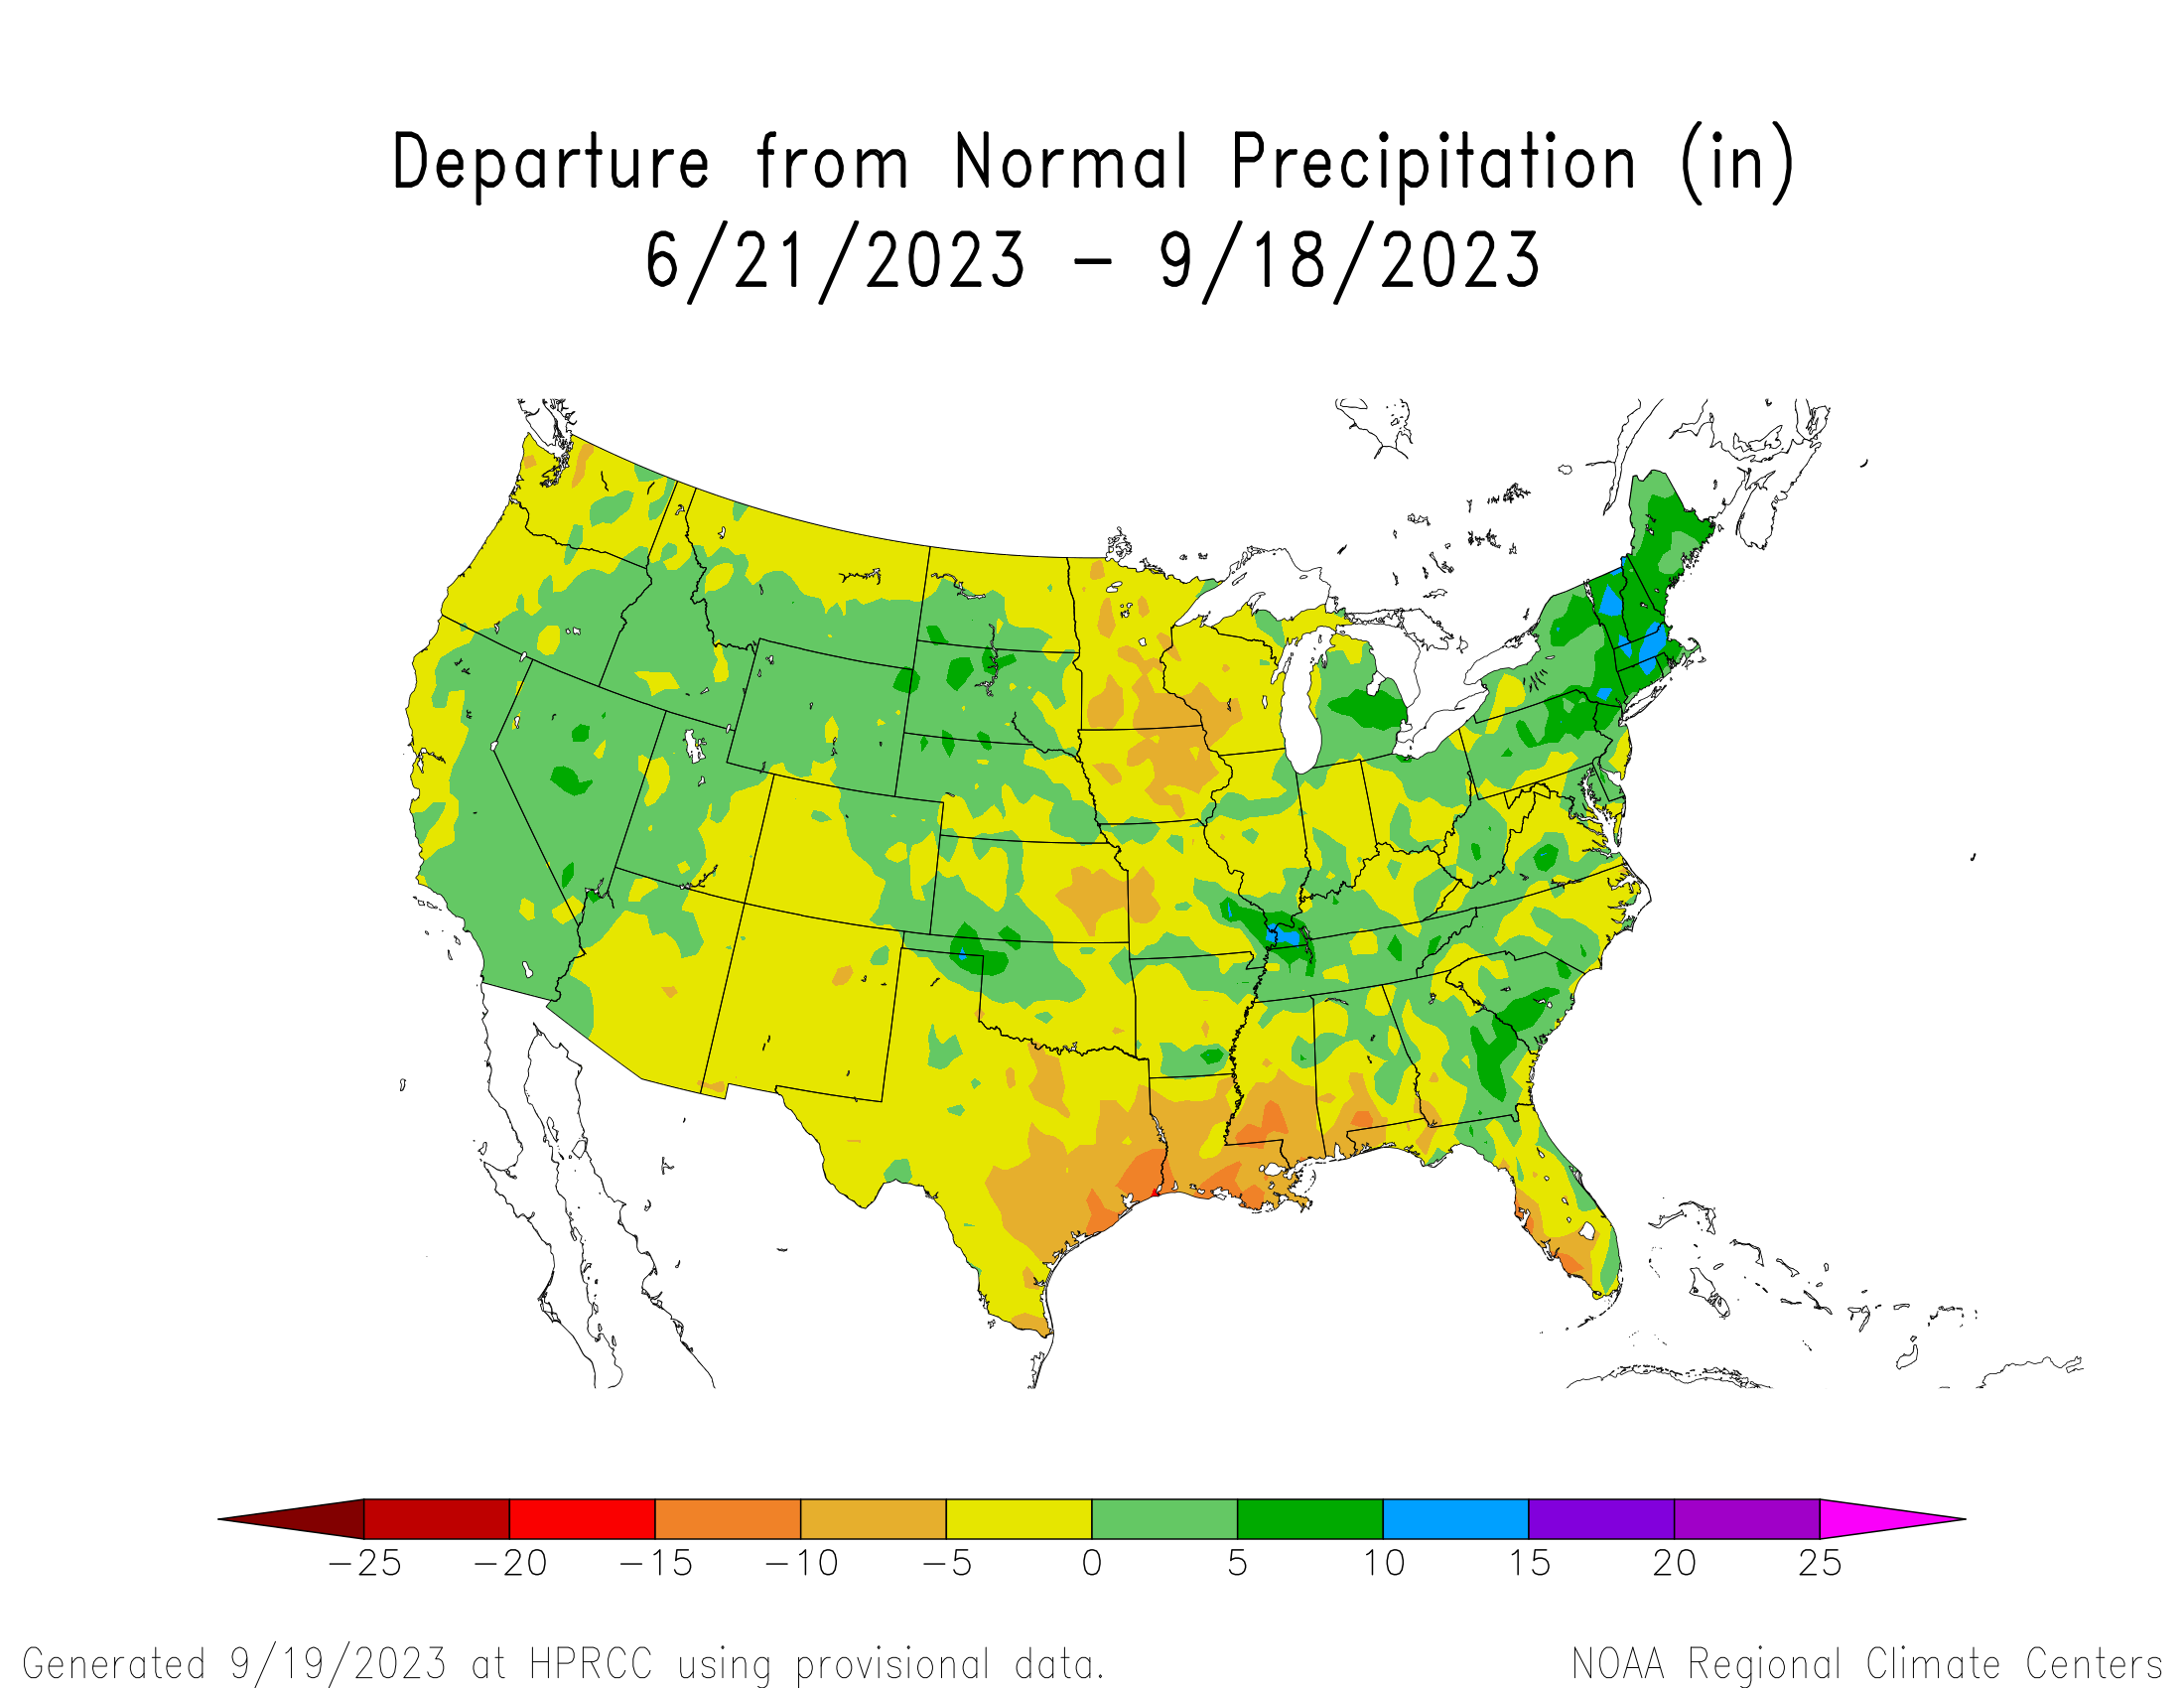
Lack of Precipitation in the Northern and Southern U.S.
The two maps below show that the driest regions this summer were the Pacific Northwest coast to the Upper Midwest, and the southern U.S., particularly from Arizona to the Florida panhandle. Other dry areas included southwestern Colorado, the Kansas/Missouri border, and the Florida Gulf Coast. Wet areas included most of the rest of the West, western Great Plains, the Northeast, and a few other pockets.
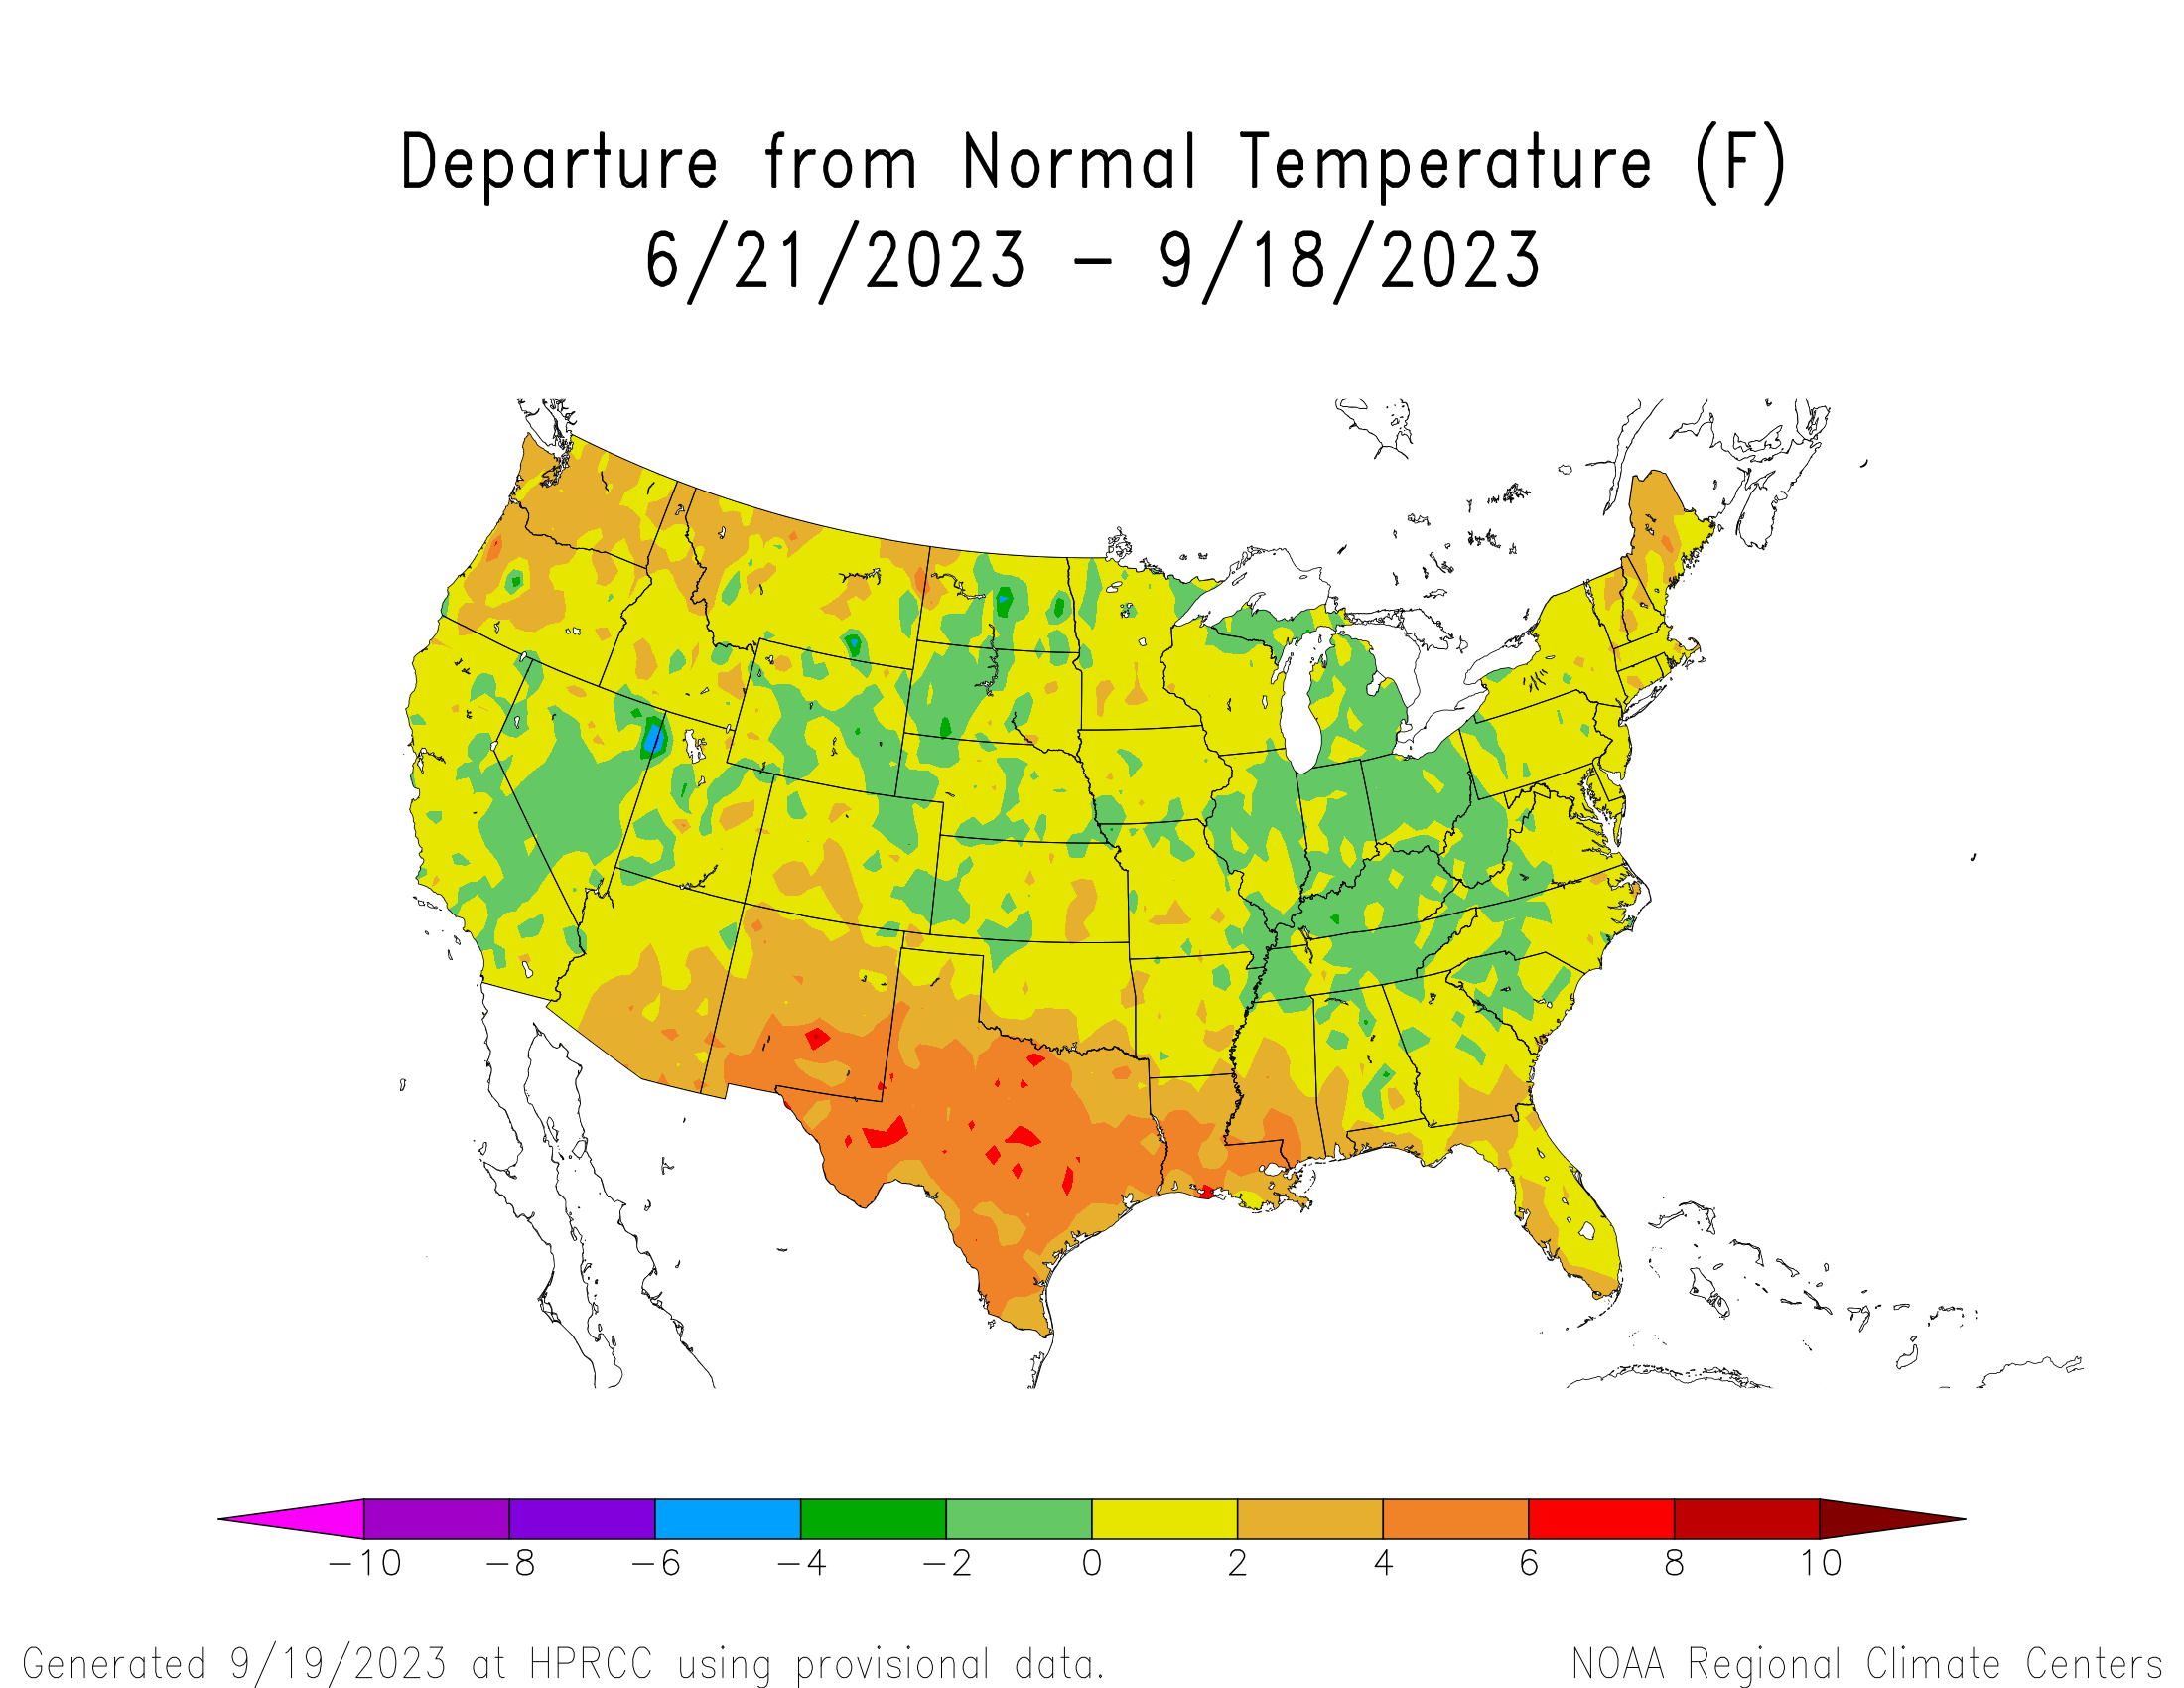
Record-Breaking Heat in the Southern U.S.
Summer temperatures were generally warmer than normal, with areas of extreme and record-breaking heat in the southern United States. Parts of the West, Plains, and Midwest were cooler than normal.
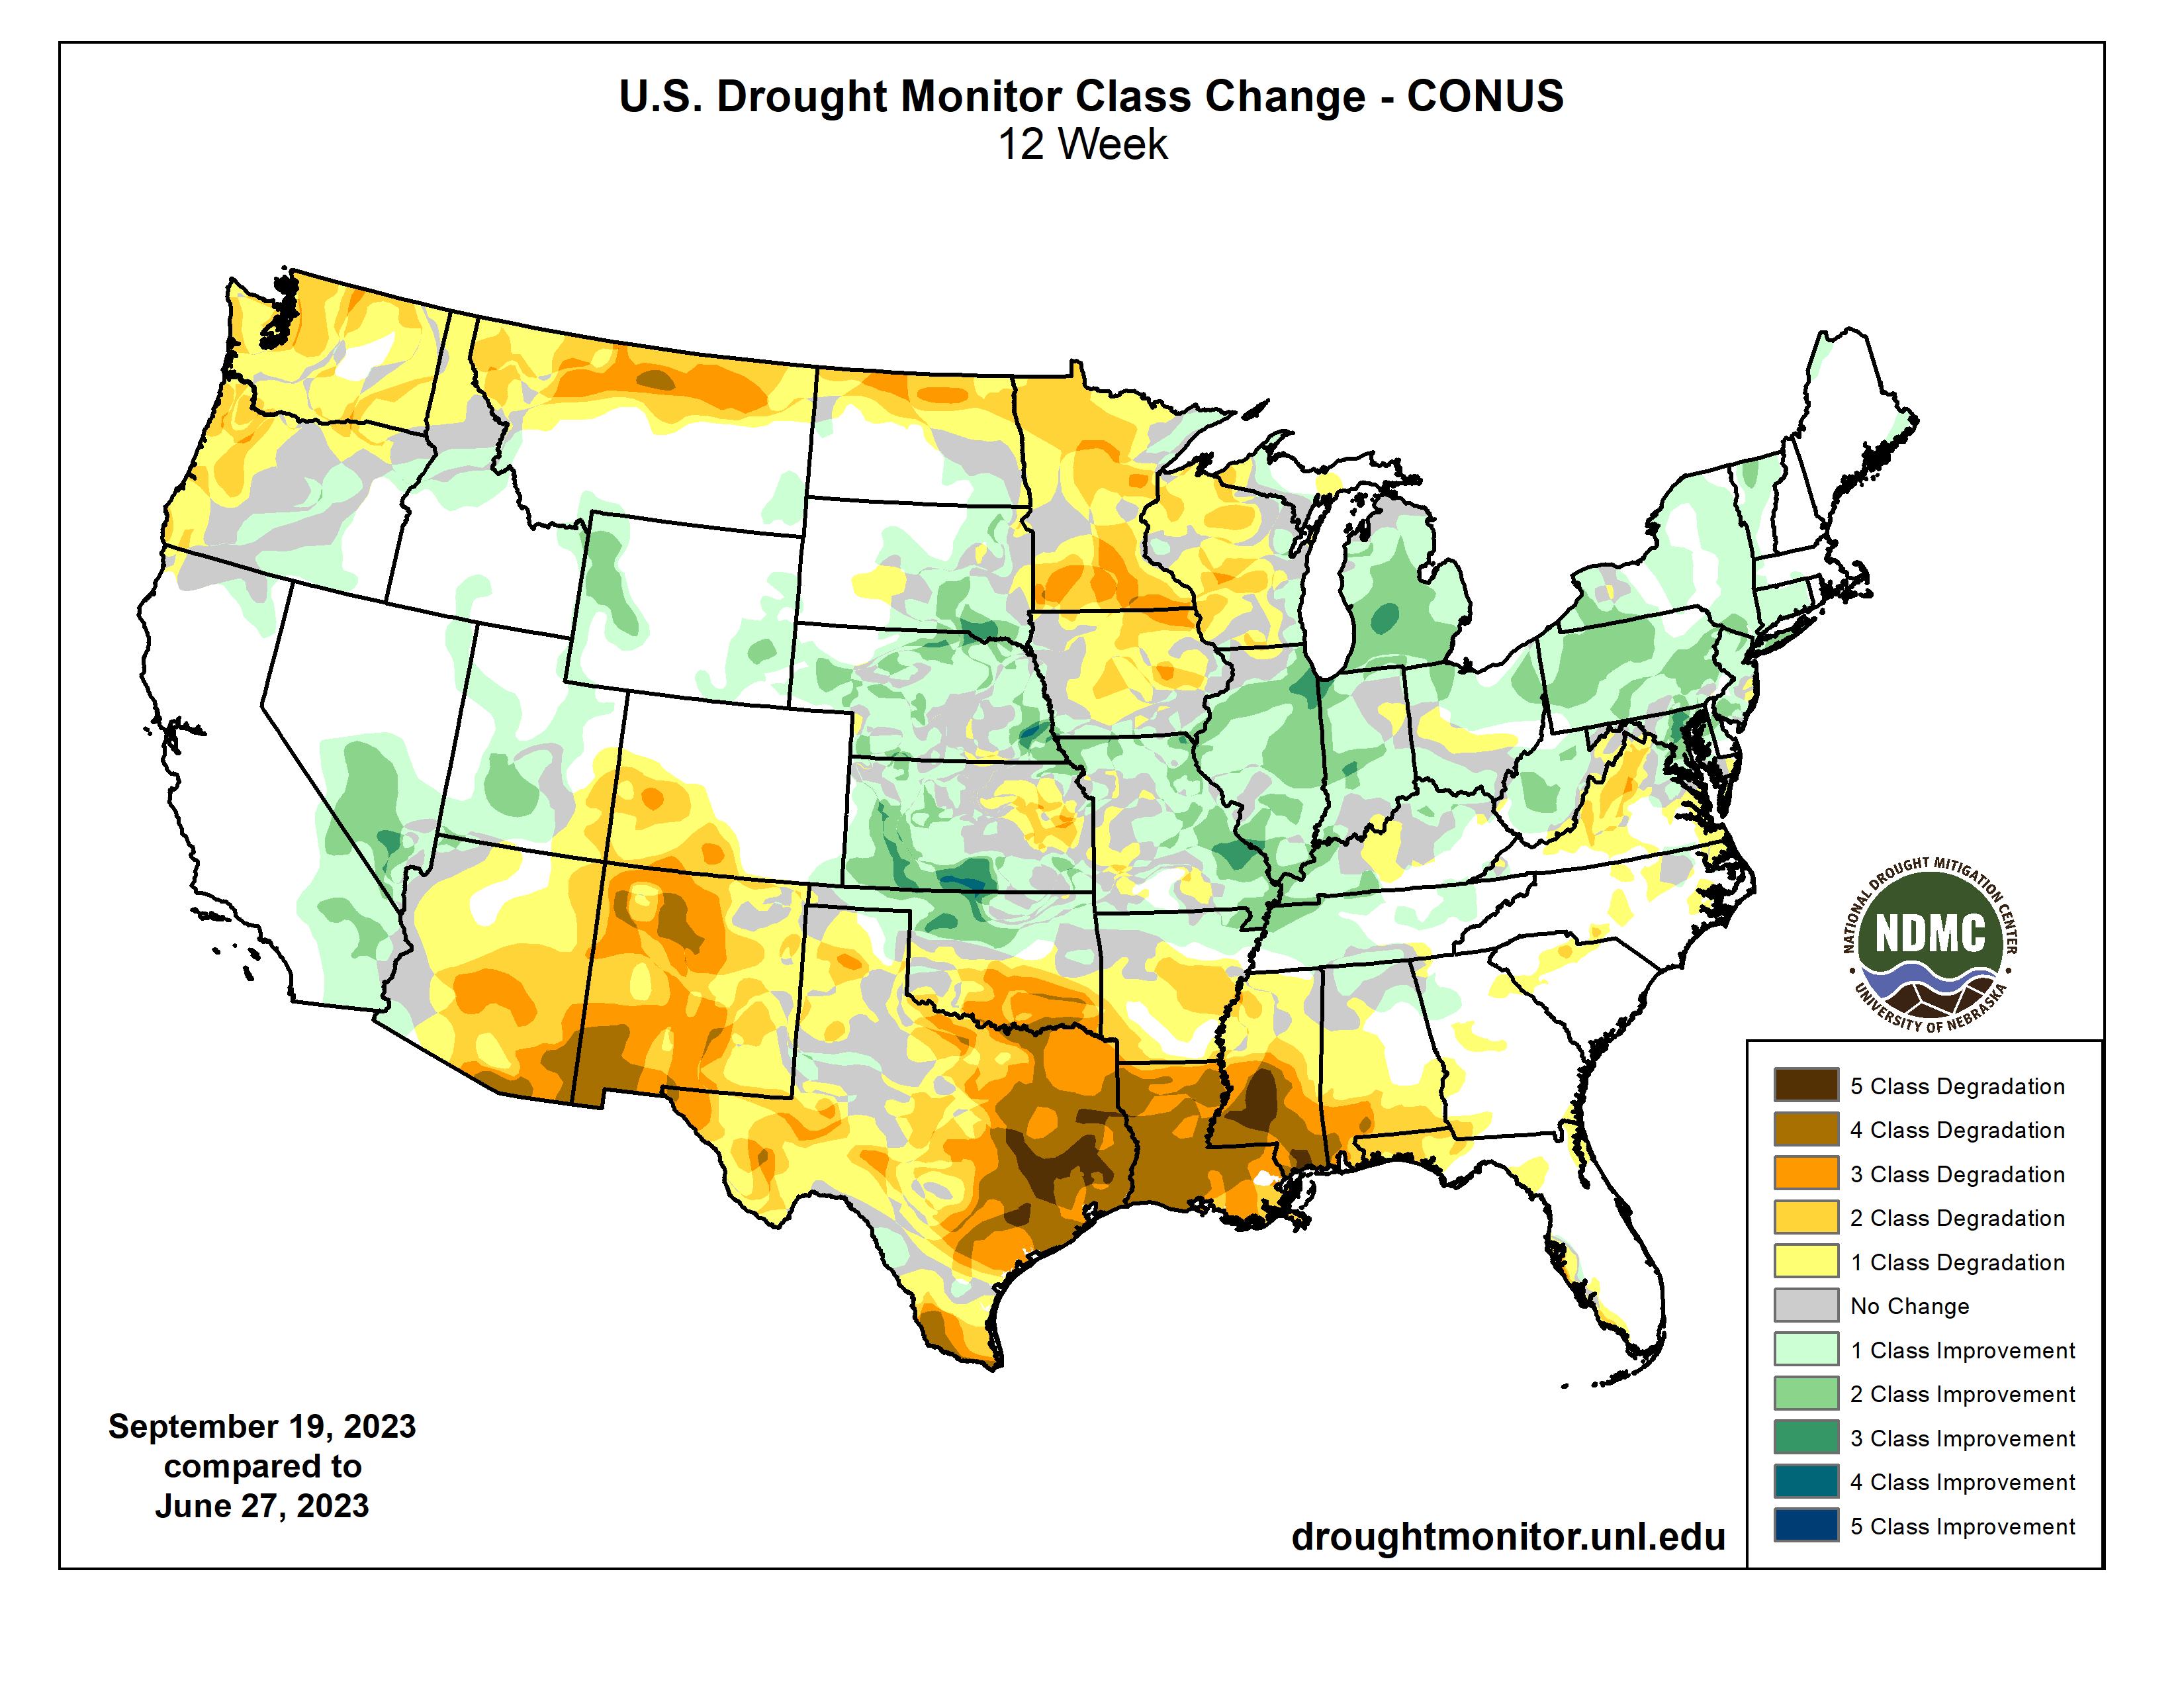
Drought Worsened in Many Regions
The greatest drought class degradations this summer occurred in eastern Texas, Louisiana, southern Mississippi, and southwestern Alabama. Other regions with degradations included the Northwest, very northern Rockies, Northern Plains, Upper Midwest, Southwest, and Hawaii. Other parts of the West, Central Plains, rest of the Midwest, Mid-Atlantic, and Northeast saw improvements.
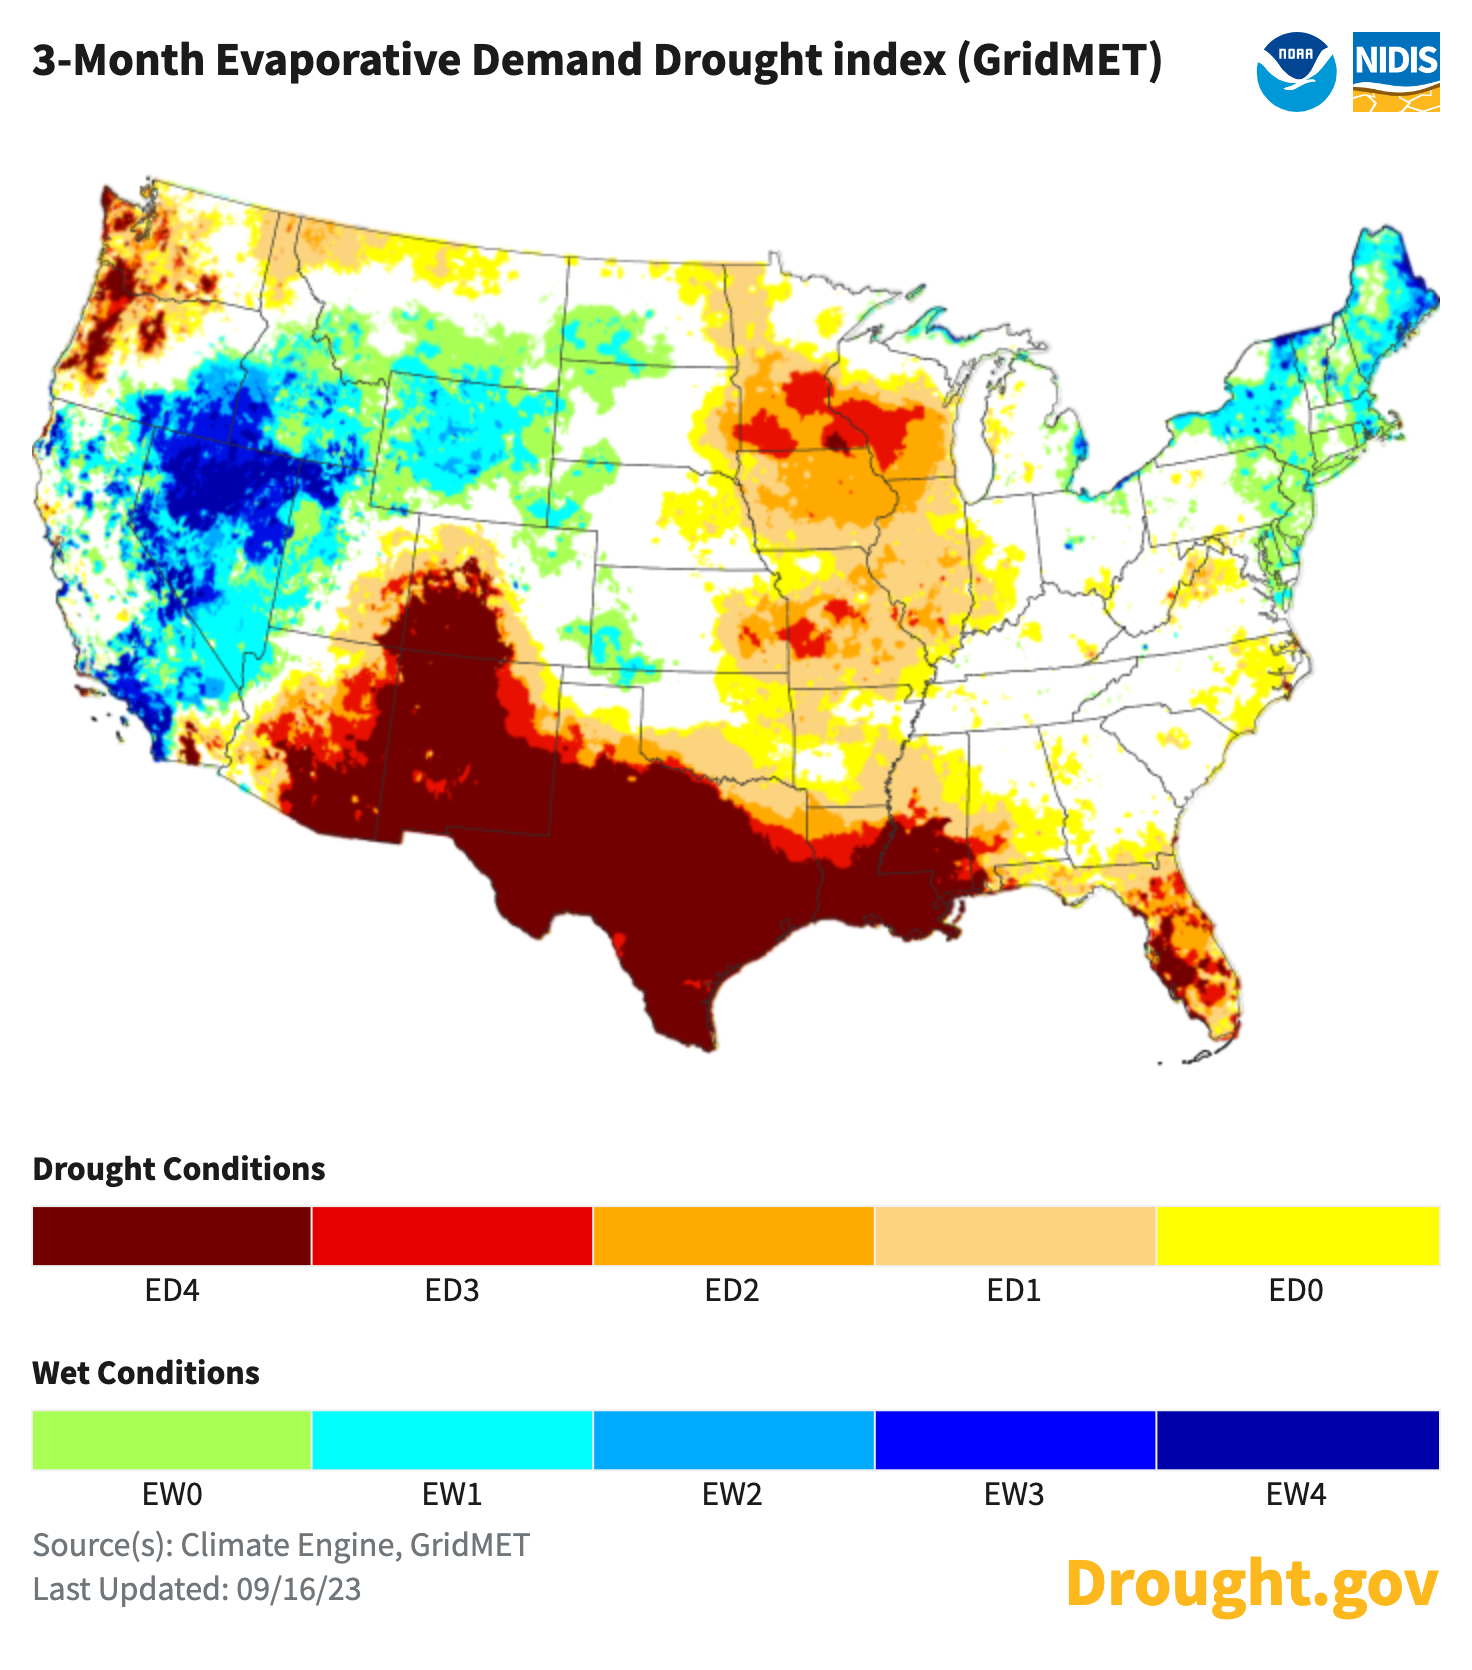
A Thirsty Atmosphere in the Northwest, Midwest, and Southern U.S.
Evaporative demand is the atmospheric influence on the drying of the landscape, or "the thirst of the atmosphere." Unusually high evaporative demand can lead to moisture stress on the land surface, and ultimately to drought—even when precipitation has been near-normal. The Evaporative Demand Drought Index (EDDI) is a drought monitoring tool that shows the anomaly in daily evaporative demand over a given period time. The 3-month EDDI shows why drought worsened across several regions, particularly, in the Southwest, Texas, and South.
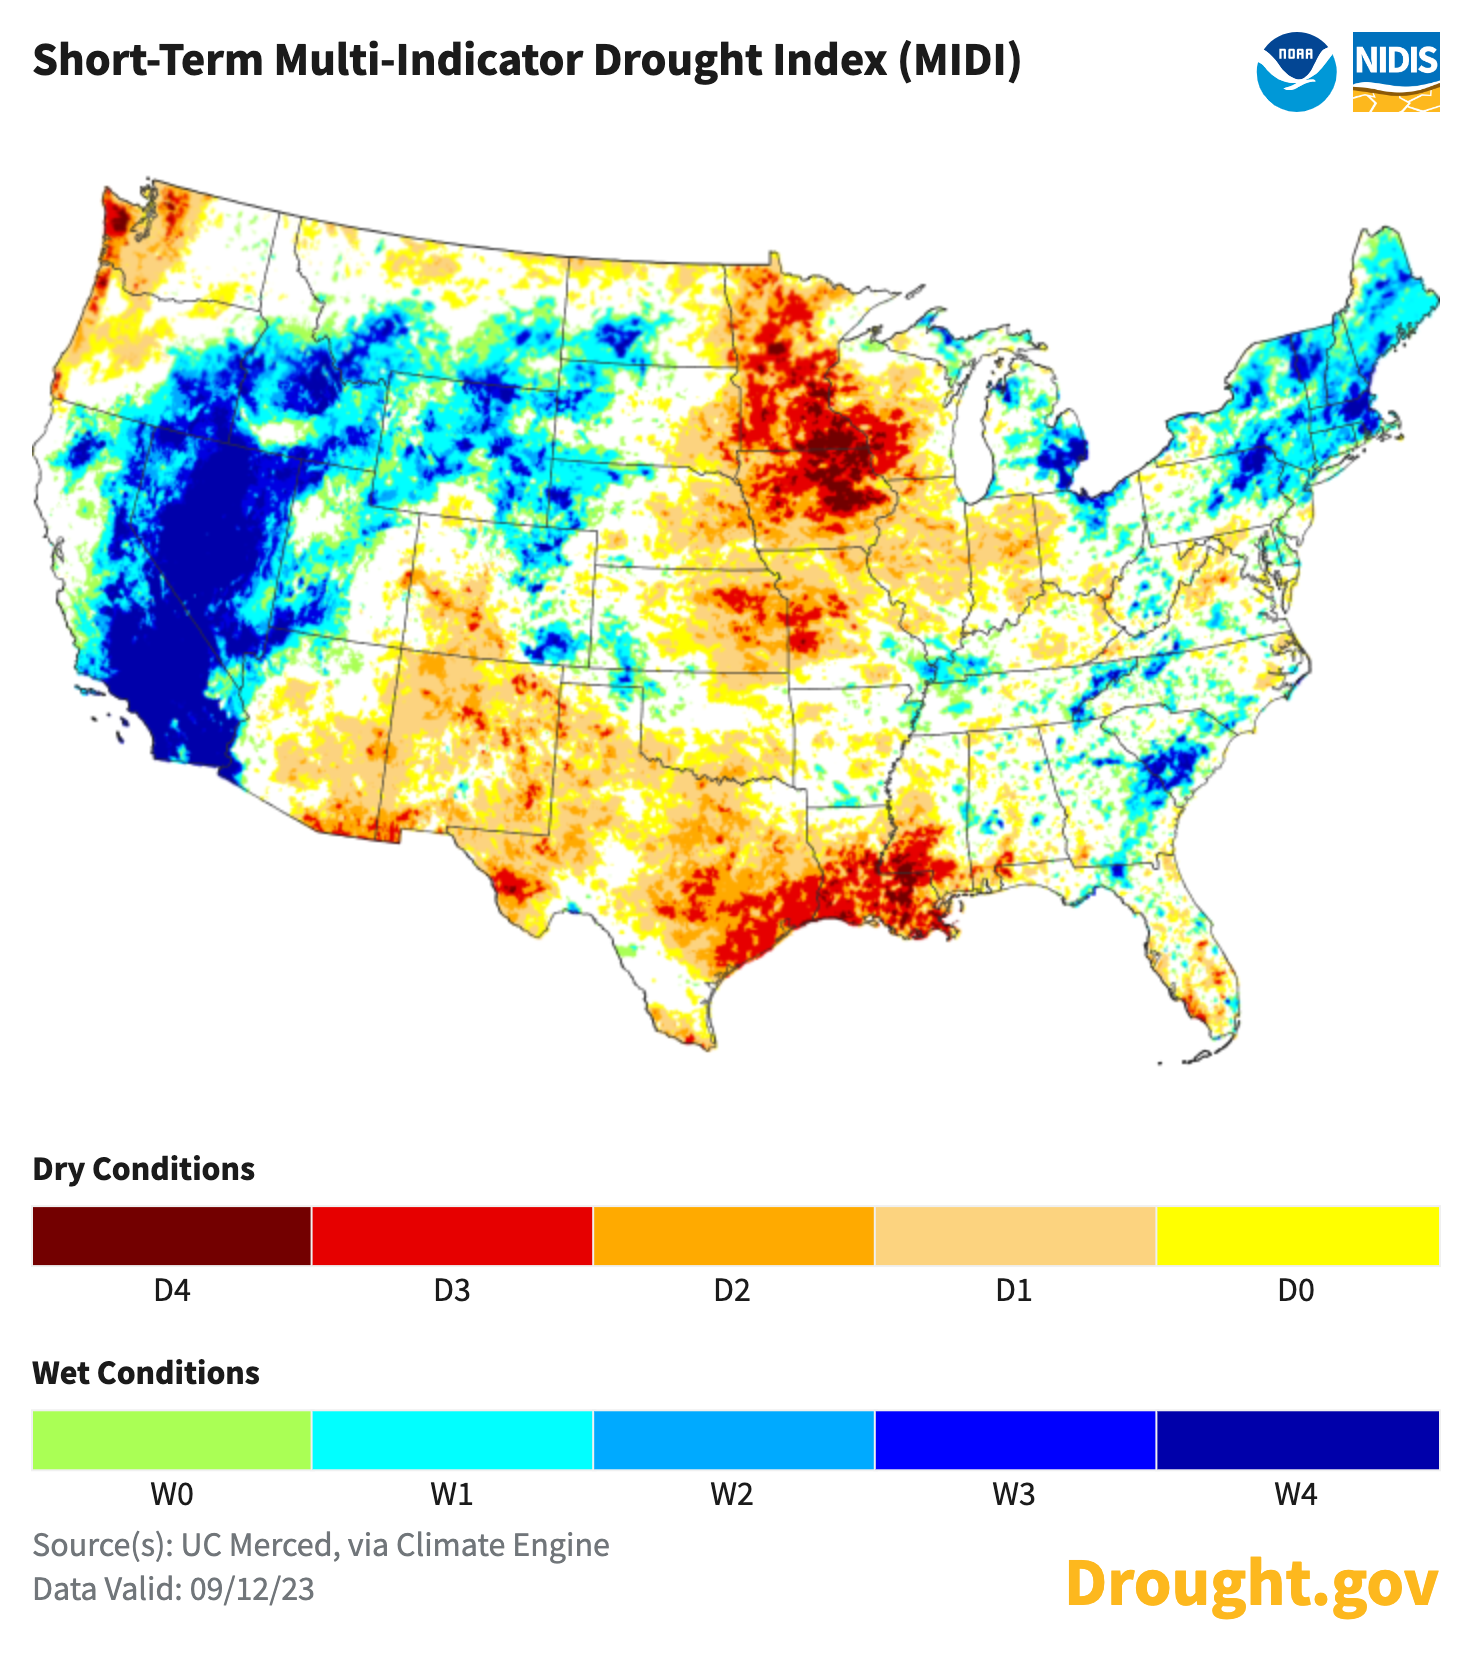
Short-Term Dryness in the Northwest, Upper Midwest, Central Plains, and Southern U.S.
The Multi-Indicator Drought Index (MIDI) looks at current drought conditions across the U.S. by integrating several key drought indices into one objective, computer-generated map. The Short-Term MIDI approximates drought impacts from changes in precipitation and moisture over a short-term period (looking back up to 90 days). The Short-Term MIDI looking back from September 12 shows the driest conditions along the Northwest coast, Upper Midwest, Kansas/Missouri border, and southeastern Texas to Mississippi.
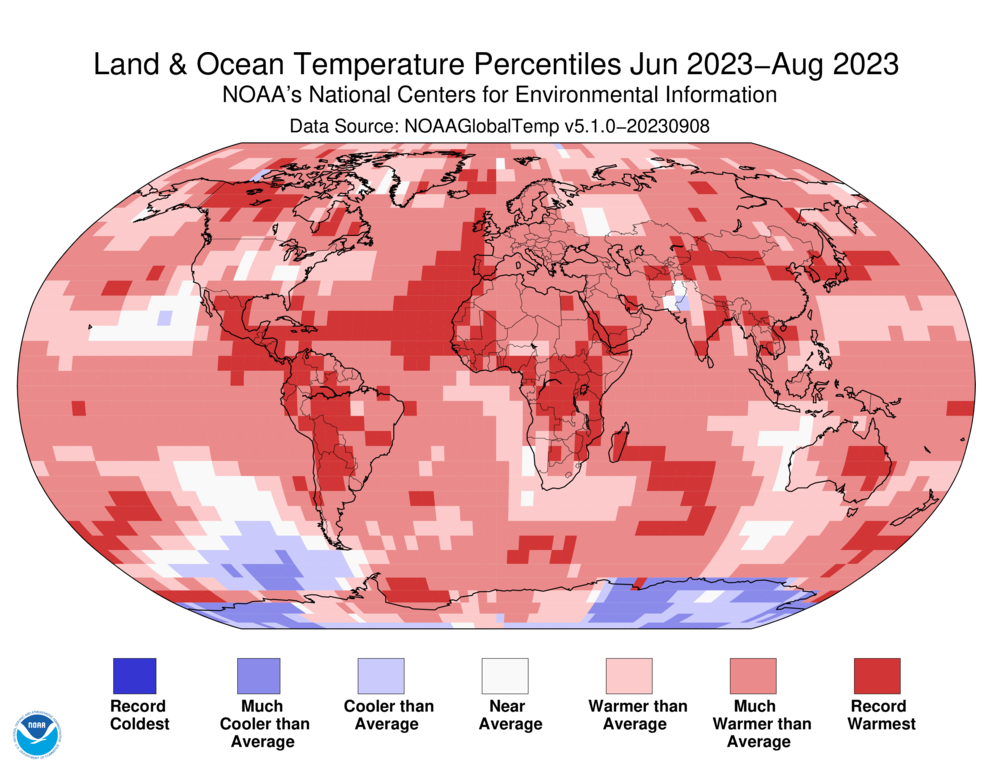
Warmest Summer on Record in North America
North America had its warmest meteorological summer on record. The record heat in Canada helps explain the record-breaking wildfire season that sent smoke streaming into the United States (see next map). Asia, Africa, South America, and the Arctic also had their warmest June–August periods, and Oceania had its warmest winter on record. Europe had its third-warmest summer.
Record-Breaking Canadian Wildfires Sent Smoke Across the U.S.
The Fire Information for Resource Management System (FIRMS) US/Canada is a joint effort by NASA and the USDA Forest Service to provide access to low latency satellite imagery and science data products from satellite assets to identify the location, extent and intensity of wildfire activity and its effects. As shown on the map below from September 15, 2023, the United States didn't have many summer wildfires outside of the Northwest. However, many U.S. towns and cities spent parts of the summer shrouded in smoke coming down from a record-breaking Canadian wildfire season.