A Dashboard for Communicating UMRB Soil Moisture and Snowpack
In the Upper Missouri River Basin (UMRB), catastrophic floods and droughts between 2011 and 2017 highlighted the need for more and better water information to deliver earlier warnings and respond to extremes from both sides of the water supply spectrum. To address this data need, the Infrastructure Investment and Jobs Act funded three complementary projects in the UMRB focused on improved monitoring, data acquisition, and data application
- The buildout of 540 new mesonet stations across the basin, led by the U.S. Army Corps of Engineers, in partnership with state mesonets and tribal nations
- A data acquisition and use pilot led by the National Weather Service National Mesonet Program
- The UMRB Data Value Study, led by NOAA’s National Integrated Drought Information System (NIDIS), to evaluate how these data can support improvements to water resource models, drought monitoring capabilities, and other applications
In the last few years, many new UMRB mesonet stations have come online. However, monitoring drought typically involves looking at hydrological indicators, such as soil moisture and snowpack, through the lens of historical conditions—which requires many years of historical data. The Upper Missouri River Basin (UMRB) Soil Moisture and Snowpack Dashboard—a component of the NIDIS-led UMRB Data Value Study—offers map products that enable the drought monitoring community to use data from new UMRB stations within the first year of station establishment.
To create this product, a research team from NOAA’s National Centers for Environmental Information, the Cooperative Institute for Satellite Earth System Studies, and South Dakota State University ingested soil moisture and snowpack data from mesonet stations across Montana, Nebraska, North Dakota, South Dakota, and Wyoming and created an experimental UMRB Soil Moisture and Snow Maps Dashboard on Drought.gov.
This dashboard—which features interactive soil moisture and snowpack maps and is updated weekly—explores approaches for utilizing in situ data to visualize soil moisture conditions in ways that directly communicate impacts to vegetation, have implications for drought monitoring, and that do not rely on the availability of extended periods of record.
The UMRB Soil Moisture and Snow Maps Dashboard can be used to support local decision-making and planning around droughts, floods, and agriculture in the Upper Missouri Basin. It also offers a template for networks in other regions exploring options for communicating soil moisture information from a limited data record.
For more information, please contact Elise Osenga (elise.osenga@noaa.gov).
Project Snapshot
Ronald Leeper, Cooperative Institute for Satellite Earth System Studies (CISESS), NOAA's National Centers for Environmental Information (NCEI)
Nathan Edwards, South Dakota State University (SDSU); Laura Edwards, SDSU; Michael Palecki, formerly NOAA/NCEI; Steve Ansari, NOAA/NCEI
Results of This Research
- The research team created an experimental UMRB Soil Moisture and Snow Maps Dashboard on Drought.gov and documented their methodology. The Dashboard features interactive maps based on UMRB mesonet station data, updated weekly on Tuesdays:
- Fractional Available Water (FAW)
- Categorized Soil Moisture
- 1-Week, 4-Week, 8-Week, and 12-Week Soil Moisture Change Maps
- Current Snow Depth Conditions
- Still in development: Frozen Soil Conditions (Soil Frost and Thaw Depth)
- CSV files of these soil moisture and snowpack data are delivered to the U.S. Drought Monitor authors weekly to supplement the suite of drought indicators the authors use to create their weekly map of drought conditions.
- All soil moisture maps are available for three depths: topsoil (average of 2-inch and 4-inch depth observations), subsoil (8-inch and 20-inch depths), and total column.
- Soil moisture conditions are reported in metrics that account for, or are independent of, soil type.
- The approaches used to create this dashboard can utilize datasets within the first year of their period of record.
- For an overview of this project, watch this webinar presentation from the research team.
Related Data & Maps
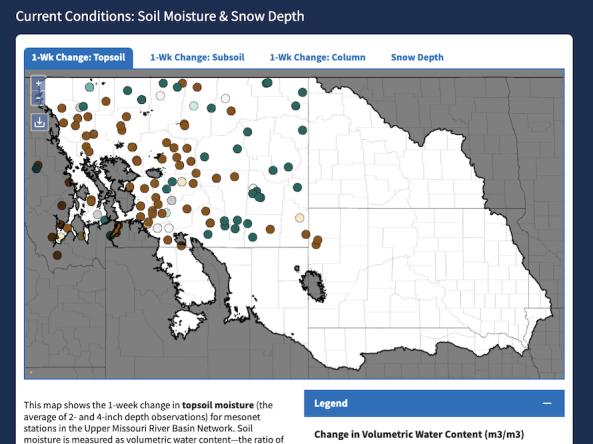
The Upper Missouri River Basin Soil Moisture and Snowpack Dashboard displays interactive maps of station-based soil moisture and snowpack data from the five state mesonets in the Upper Missou