CW3E West Coast Freezing Level Forecasts
UC San Diego Scripps Institute of Oceanography Center for Western Weather and Water Extremes (CW3E)
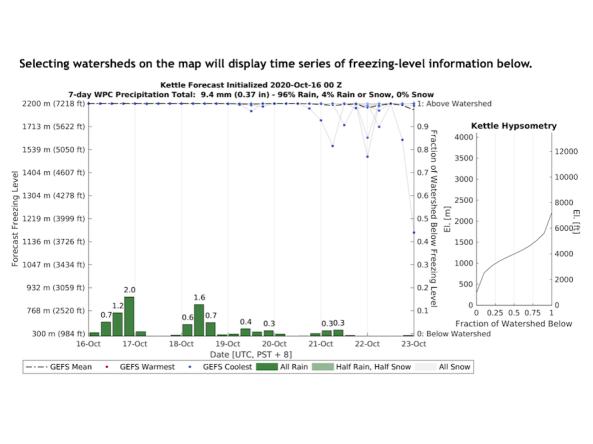
The Center for Western Weather and Water Extremes (CW3E) uses Global Ensemble Forecast System (GEFS) forecasts to show the evolution of the freezing level above, within, or below a watershed's terrain (i.e., forecast near-surface temperatures being above or below freezing, and precipitation falling as rain or snow). The maps show the fraction of GEFS ensemble members with freezing levels below the terrain height (i.e., near-surface temperatures below freezing) when the 21 GEFS ensemble members are downscaled to a 1-km digital elevation model.
Access
CW3E: Homepage of the Center for Western Weather and Water Extremes
CW3E West Coast Freezing Level Forecasts: GEFS forecasts to show the probabilities for the western states’ watershed of the freezing level being above or below the terrain height.
How To
How to use these data:
Select a watershed on the interactive map to display time series of freezing-level information.
Dark or light shading indicates greater GEFS certainty, whereas shading in between indicates less certainty about temperature relative to freezing and thus precipitation phase. NOAA Weather Prediction Center 6-hourly precipitation is also contoured in mm on the map in yellow, and HUC8 watershed boundaries are shown. GEFS freezing levels are drawn for elevations below 3,500 meters, and are no longer bias corrected.