The Climate Explorer
NOAA National Weather Service's Climate Prediction Center (CPC), National Environmental Modeling and Analysis Center (NEMAC)
Individuals, businesses, and communities of all sizes can use the Climate Explorer to understand how climate conditions in their locations are projected to change over coming decades. This information—derived from global climate models—can help people assess potential exposure, vulnerability, and risk to their assets.
Built to accompany the U.S. Climate Resilience Toolkit, the Climate Explorer offers graphs and maps of observed and projected temperature, precipitation, and related climate variables for every county in the contiguous United States. Additionally, the tool now offers hindcasts and projections for Alaskan boroughs.
The tool also displays historical observations of temperature, precipitation, and related variables from 1950 to 2013 for the contiguous United States. Observations are averages calculated from quality-checked ground-based weather stations across the country. Users can compare graphs of observed conditions to climate model simulations (hindcasts, or projections generated for the past) for the same period. Comparing the range of observations to the simulations can provide insights on the models' collective ability to predict the future for the given variable in a given county. For temperature-related variables, the range of observations are generally within the envelope of simulations (hindcasts). For some variables—especially precipitation-related variables—comparing observations with hindcasts reveals limitations of the models.
How To
How to use this tool:
- To get started, enter a county, city, or zip code within the contiguous United States.
- For a given location, choose from a variety of interactive maps and charts, including climate, high tide flooding, historical weather data, and historical thresholds.
- Use the tools at the top and bottom of the map to adjust settings, including timeframe, visualization method (map or chart), and threshold.
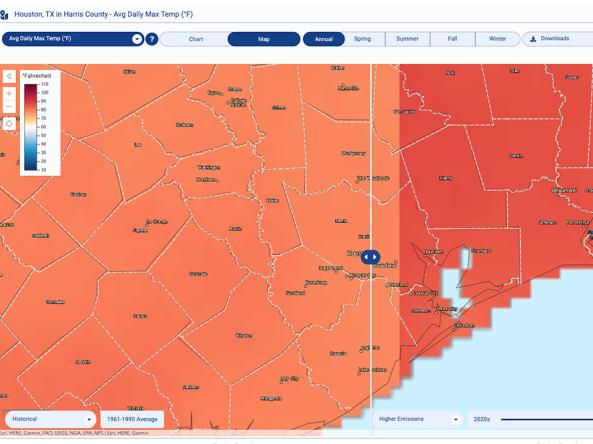
- For the Climate Map, move the line in the middle of the map with your mouse to view historical conditions or the lower emissions projection (choose one) side-by-side with the higher or lower emissions climate projection (choose one).
- To download data, click the download button and select your preferred data format.
Access
The Climate Explorer: Explore graphs and maps of historical and projected climate variables for any county in the contiguous United States.
Documentation
About the Climate Explorer: Information about the Climate Explorer web application and its data sources.
Glossary: A glossary of terms used throughout the tool.