Water Deficit Trends Tool
Associated Agencies
High Plains Regional Climate Center
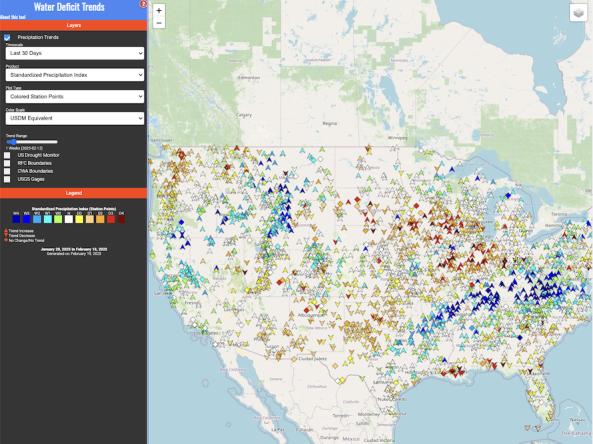
The High Plains Regional Climate Center’s Water Deficit Trends tool provides information on long-term changes in precipitation across the country.
The interactive map allows users to view current drought, precipitation, and trend data, alongside the current U.S. Drought Monitor; 7-, 14-, and 28-day U.S. Geological Survey streamflows; and National Weather Service River Forecast Center and County Warning Area boundaries. Select any Applied Climate Information System (ACIS) station to analyze trends across the past 6 months of long-term data, and view the data in an exportable table, graph, or report.
How To
- Use the dropdown menus on the left to select data and display options, including:
- Timescale
- Product
- Plot type (colored station points or station points on contours)
- Color scale
- Then, use the Trend Range sliding scale to select the time range across which a trend will be calculated, from 0 to 12 weeks. The points on the map will either display a diamond (no change), an up arrow (increasing), or a down arrow (decreasing) for the selected time range.
- Use the check boxes to select any other layers to display.
- Click the layers icon in the top right corner to select a new basemap or view additional layers like population density, snow cover, SMAP analyzed surface soil moisture, and more.
- Click on any station on the map to view precipitation, temperature, Standardized Precipitation Index (SPI), Standardized Precipitation Evapotranspiration Index (SPEI), and U.S. Drought Monitor data for that station via an interactive timeseries graph, table, and water trend report.
- You can also download the data as an image, PDF, or CSV file.
Documentation & Metadata
- Surface observations are derived from data available through the Applied Climate Information System (ACIS). View ACIS metadata.
- USGS stream gage data was made available through the USGS National Water Information System. View metadata.
- HPRCC developed the SPI and SPEI indices in cooperation with the National Drought Mitigation Center. Learn more on the ACIS Climate Maps web page.
- The USGS base map layers were made available through the USGS National Geospatial Program's National Map.
- NASA's Earth Observing System Data and Information System provided the population density, Normalized Difference Snow Index (NDSI) Snow Cover, 3-Day Flood Window, Global Landslide Hazard Distribution, Leaf Area Index, and Surface Soil Moisture map layers.
Partner(s)
Representative Image