Quarterly Climate Impacts and Outlook for the Mid-Atlantic Region for December 2023–February 2024. Dated April 2024.
Average temperatures for the winter season were four to six degrees above normal for most of the region. The eastern portion of the region experienced wetter than normal conditions, up to 200 percent of normal precipitation.
Quarterly Climate Impacts and Outlook for the Midwest Region for December 2023–January 2024. Dated March 2024.
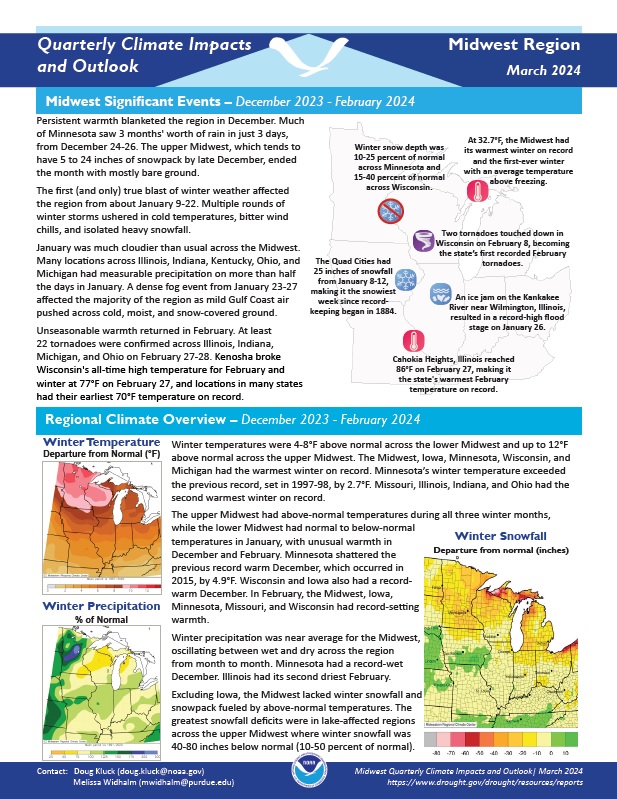
Winter temperatures were 4-8°F above normal across the lower Midwest and up to 12°Fabove normal across the upper Midwest. The Midwest, Iowa, Minnesota, Wisconsin, andMichigan had the warmest winter on record. Winter precipitation was near average for the Midwest, oscillating between wet and dry across the region from month to month. Minnesota had a record-wet December. Illinois had its second driest February.
Quarterly Climate Impacts and Outlook for the Southern Region for December 2023–February 2024. Dated March 2024.
Quarterly Climate Impacts and Outlook for the Great Lakes Region for December 2023–February 2024. Dated March 2024.
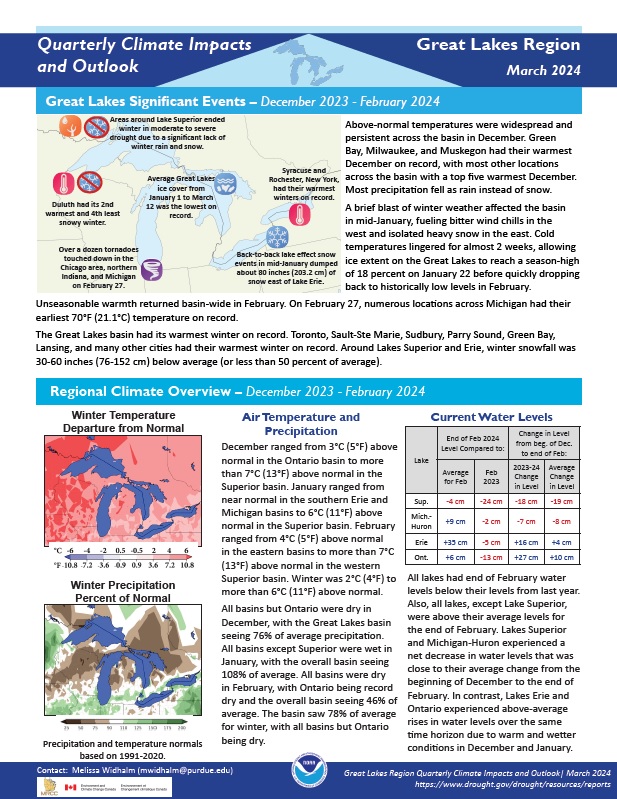
Winter was 2°C (4°F) to more than 6°C (11°F) above normal. The basin saw 78% of average precipitation for winter, with all basins but Ontario being dry.
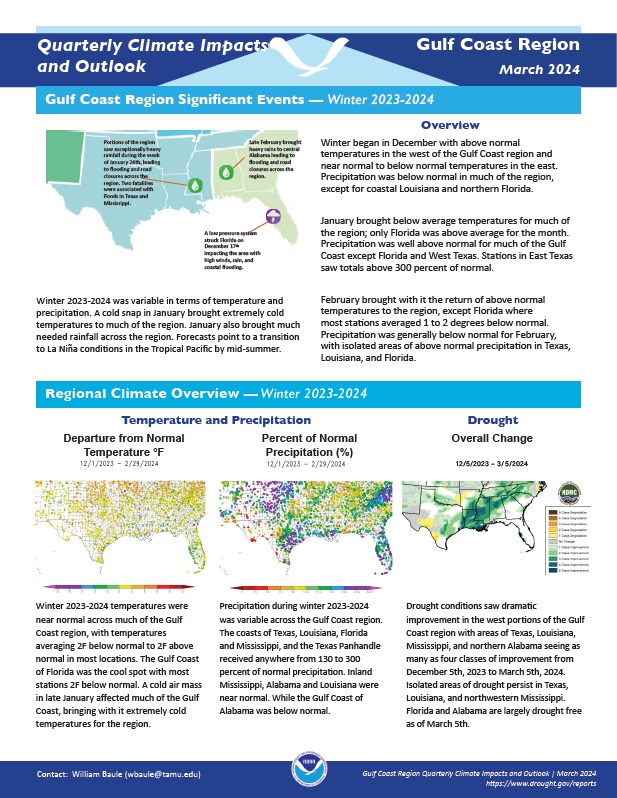
Quarterly Climate Impacts and Outlook for the Gulf Coast Region for December 2023–February 2024. Dated March 2024.
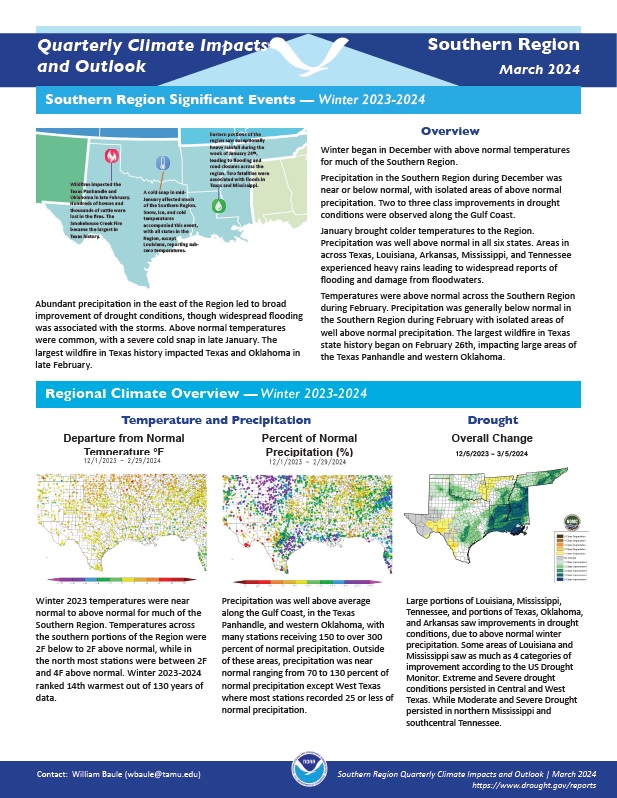
Winter 2023-2024 temperatures were near normal across much of the Gulf Coast region, with temperatures averaging 2F below normal to 2F above normal in most locations. The Gulf Coast of Florida was the cool spot with most stations 2F below normal. Precipitation during winter 2023-2024 was variable across the Gulf Coast region.
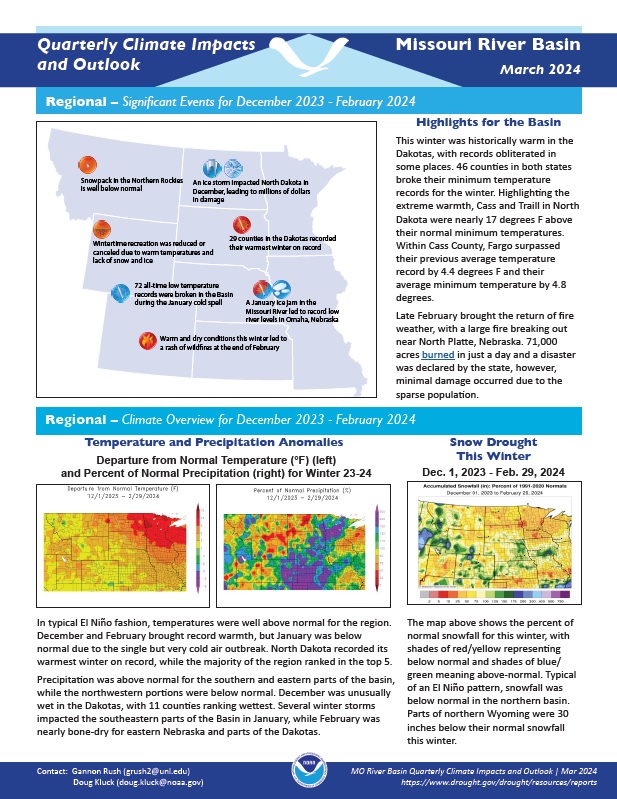
Quarterly Climate Impacts and Outlook for the Missouri River Basin for December 2023–February 2024. Dated March 2024.
In typical El Niño fashion, temperatures were well above normal for the region. North Dakota recorded its warmest winter on record, while the majority of the region ranked in the top 5. Precipitation was above normal for the southern and eastern parts of the basin, while the northwestern portions were below normal.
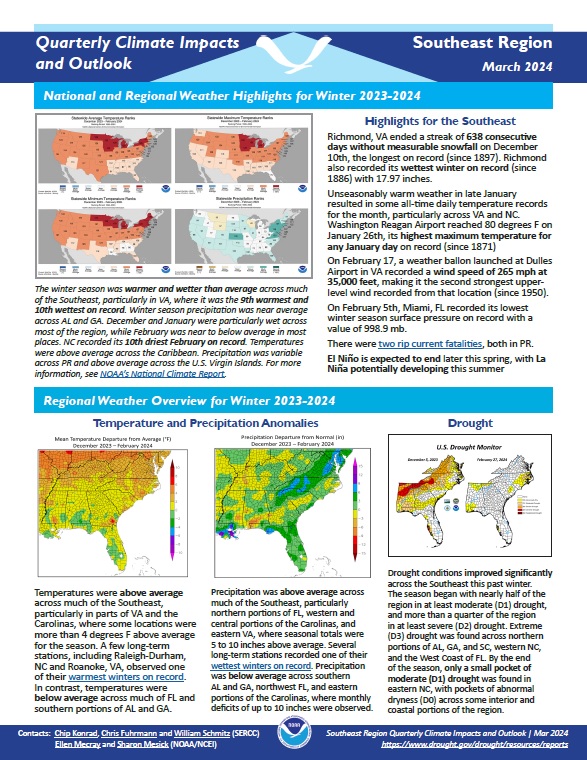
Quarterly Climate Impacts and Outlook for the Southeast and Caribbean Region for December 2023–February 2024. Dated March 2024. (Updated April 2024 to add Spanish translation of Caribbean information.)
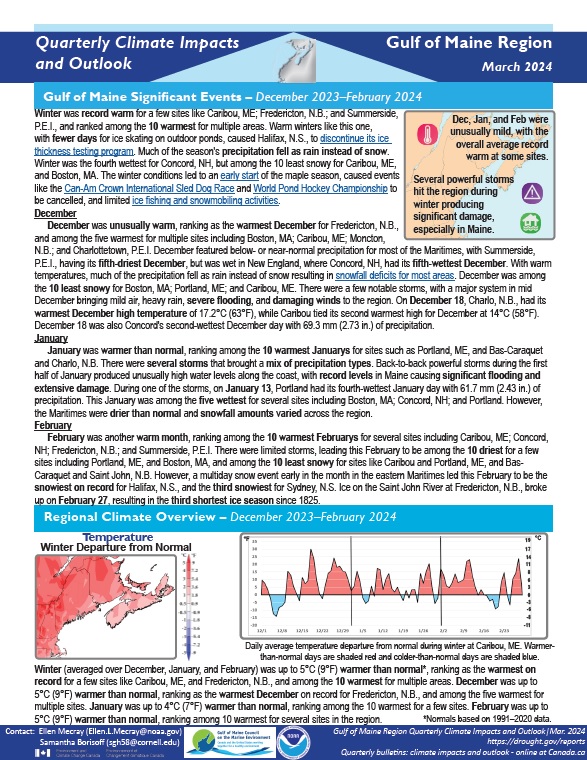
Quarterly Climate Impacts and Outlook for the Gulf of Maine Region for December 2023–February 2024. Dated March 2024.
Winter was up to 5°C (9°F) warmer than normal, ranking as the warmest on record for a few sites like Caribou, Maine, and Fredericton, N.B., and among the 10 warmest for multiple areas. Precipitation for winter ranged from 50% of normal to more than 200% of normal.
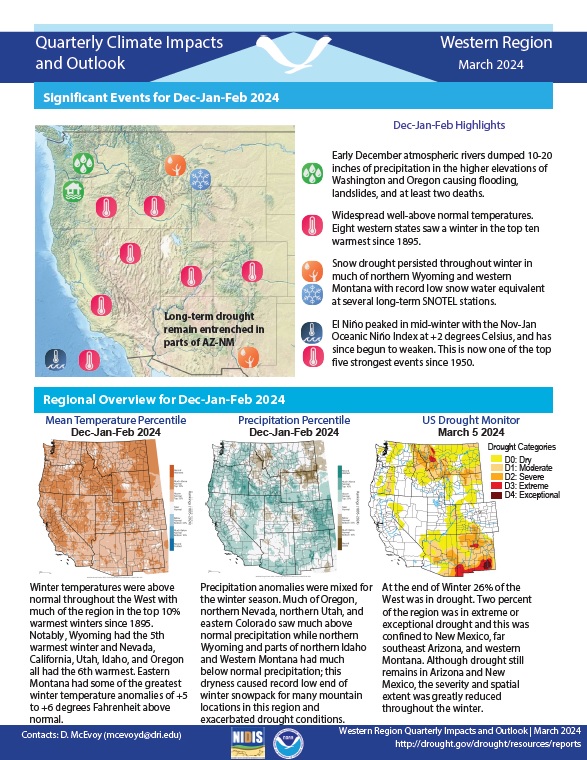
Quarterly Climate Impacts and Outlook for the Western Region for December 2023–February 2024. Dated March 2024.
Winter temperatures were above normal throughout the West with much of the region in the top 10% warmest winters since 1895. Precipitation anomalies were mixed for the winter season. Much of Oregon, northern Nevada, northern Utah, and eastern Colorado saw much above normal precipitation while northern Wyoming and parts of northern Idaho and Western Montana had much below normal precipitation.
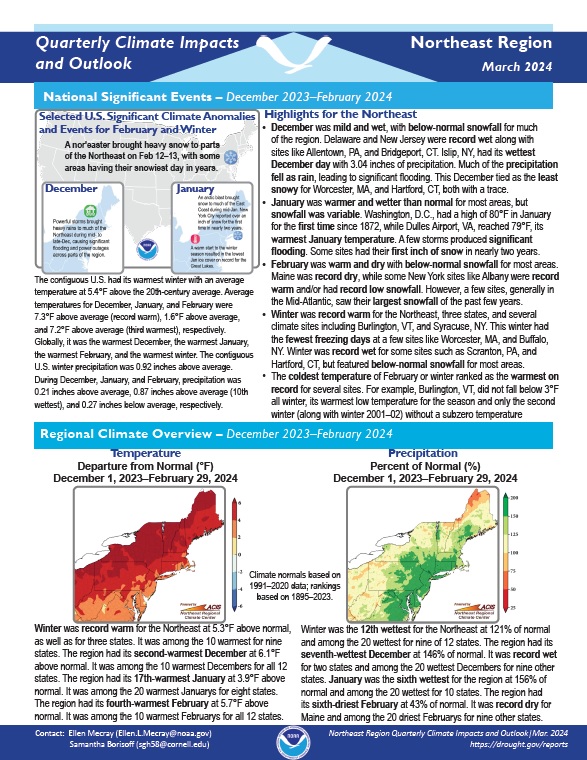
Quarterly Climate Impacts and Outlook for the Northeast Region for December 2023–February 2024. Dated March 2024.
Winter was record warm for the Northeast at 5.3°F above normal, as well as for three states. It was among the 10 warmest for nine states. Winter was the 12th wettest for the Northeast at 121% of normal and among the 20 wettest for nine of 12 states.