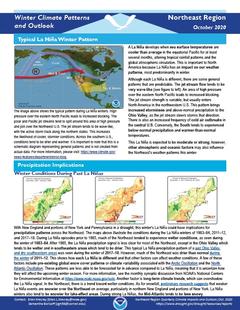
Provides a definition of La Nina; a look back at previous La Nina winters; other factors; and the outlook for winter temperatures and precipitation.
NOAA’s Regional Climate Services Program created these Outlooks to inform the public about climate impacts within their respective regions. Each regional report contains easy-to-understand language, and anyone can access them through the Drought Portal.
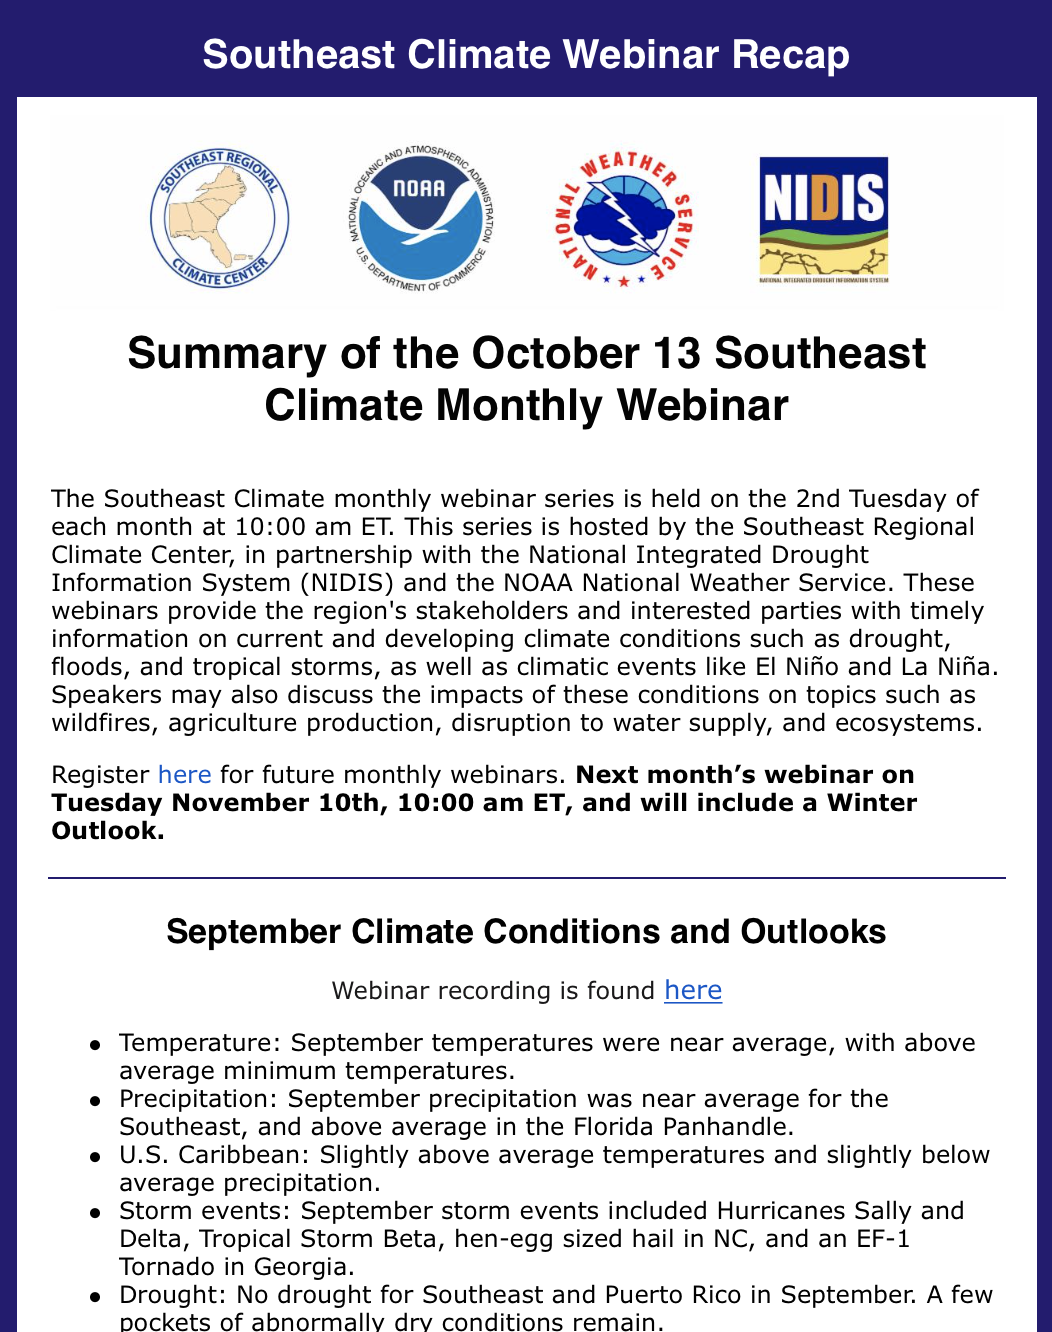
This climate conditions and outlook update was originally sent via email to the Southeast DEWS email list.
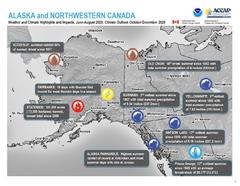
Quarterly Climate Impacts and Outlook for Alaska and Northwestern Canada for June – August 2020; outlook for October – December 2020. Dated October 2020.
Summer was cloudy and wetter than normal over eastern Alaska, Yukon, Northwest Territories and Northern BC. Temperatures were generally colder than normal or close to normal in Yukon, Northwest Territories and Northern BC.
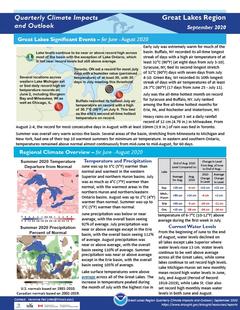
Quarterly Climate Impacts and Outlook for the Great Lakes Region for June – August 2020. Dated September 2020.
Summer was overall very warm across the basin. Several areas of the basin, stretching from Minnesota to Michigan and New York, had one of their top 10 warmest summers for minimum air temperature. In eastern and southern Ontario, temperatures remained above normal almost continuously from mid-June to mid-August. Summer precipitation was near or above average except in the Erie basin, with the overall basin seeing 105% of average.
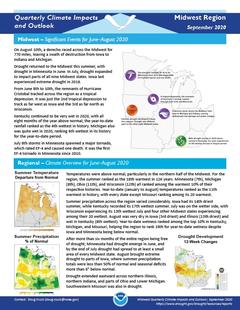
uarterly Climate Impacts and Outlook for the Midwest Region for June – August 2020. Dated September 2020.
Temperatures were above normal, particularly in the northern half of the Midwest. For the region, the summer ranked as the 18th warmest in 126 years. Summer precipitation across the region varied considerably. Iowa had its 14th driest summer, while Kentucky recorded its 17th wettest summer.
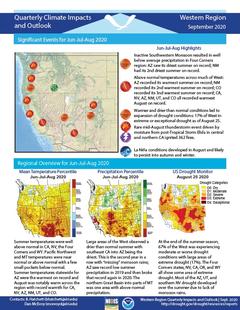
Quarterly Climate Impacts and Outlook for the Western Region for June – August 2020. Dated September 2020.
Summer temperatures were well above normal in California, Nevada, the Four Corners and Wyoming. Pacific Northwest and Montana temperatures were near normal or above normal with a few small pockets below normal. Large areas of the West observed a drier than normal summer with southeast California into Arizona being the driest. This is the second year in a row with “missing” monsoon rains.
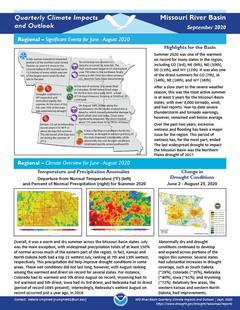
Quarterly Climate Impacts and Outlook for the Missouri River Basin June – August 2020. Dated September 2020.
Summer 2020 was one of the warmest on record for many states in the region, including CO (3rd), NE (9th), ND (10th), SD (11th), and WY (11th). It was also one of the driest summers for CO (7th), IA (14th), NE (16th), and WY (16th).
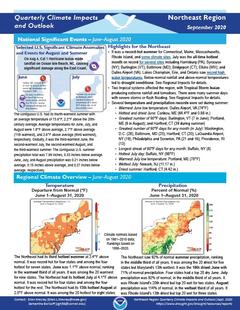
Quarterly Climate Impacts and Outlook for the Northeast Region for June – August 2020. Dated September 2020.
The Northeast had its third hottest summer at 2.4°F above normal. It was record hot for four states and among the four hottest for seven states. The Northeast saw 92% of normal summer precipitation, ranking in the middle third of all years. It was among the 20 driest for five states but Maryland's 13th wettest.
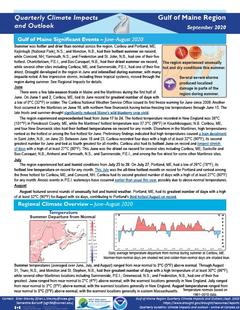
Quarterly Climate Impacts and Outlook for the Gulf of Maine Region for June – August 2020. Dated September 2020.
Summer was hotter and drier than normal across the region. Caribou and Portland, ME; Kejimkujik (National Park), N.S.; and Moncton, N.B., had their hottest summer on record, while Concord, NH; Yarmouth, N.S.; and Fredericton and St. John, N.B., had one of their five hottest. Charlottetown, P.E.I., and Bas-Caraquet, N.B., had their driest summer on record, while several other sites including Caribou, ME, and Summerside, P.E.I., had one of their five driest.
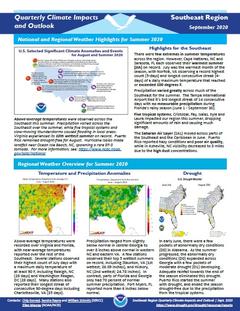
Quarterly Climate Impacts and Outlook for the Southeast Region for June – August 2020. Dated September 2020.
Above-average temperatures were recorded over Virginia and Florida, with near-average temperatures reported over the rest of the Southeast. A few stations observed their top 5 wettest summers on record, including Staunton, VA and Hickory, NC. In contrast, parts of Florida and Georgia only had 70 percent of normal summer precipitation.